Morphologic and Molecular Heterogeneity of High-grade Serous Carcinoma Precursor Lesions
- PMID: 38298022
- PMCID: PMC10930374
- DOI: 10.1097/PAS.0000000000002187
Morphologic and Molecular Heterogeneity of High-grade Serous Carcinoma Precursor Lesions
Abstract
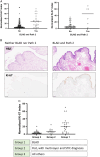
Serous tubal intraepithelial carcinoma (STIC) is the fallopian tube precursor lesion for most cases of pelvic high-grade serous carcinoma (HGSC). To date, the morphologic, molecular, and clinical heterogeneity of STIC and a less atypical putative precursor lesion, termed serous tubal intraepithelial lesion, has not been well characterized. Better understanding of precursor heterogeneity could impact the clinical management of women with incidental STICs (without concurrent carcinoma) identified in cases of prophylactic or opportunistic salpingectomy. This study analyzed morphologic and molecular features of 171 STICs and 21 serous tubal intraepithelial lesions. We assessed their histologic features, Ki-67 and p53 staining patterns, and genome-wide DNA copy number alterations. We classified all precursor lesions into 2 morphologic subtypes, one with a flat surface (Flat) and the other characterized by budding, loosely adherent, or detached (BLAD) morphology. On the basis of pathology review by a panel of 8 gynecologic pathologists, we found 87 BLAD, 96 Flat, and 9 indeterminate lesions. As compared with Flat lesions, BLAD lesions were more frequently diagnostic of STIC ( P <0.0001) and were found concurrently with HGSC ( P <0.0001). BLAD morphology was also characterized by higher Ki-67 proliferation index ( P <0.0001), presence of epithelial stratification ( P <0.0001), and increased lymphocyte density ( P <0.0001). BLAD lesions also exhibited more frequent DNA copy number gain/amplification at the CCNE1 or CMYC loci canonical to HGSCs ( P <0.0001). Both BLAD morphology and STIC diagnoses are independent risk factors for an elevated Ki-67 proliferation index. No correlation was observed between BLAD and Flat lesions with respect to patient age, presence of germline BRCA1/2 mutation, or p53 staining pattern. These findings suggest that tubal precursor lesions are morphologically and molecularly heterogeneous, laying the foundation for further studies on the pathogenesis of HGSC initiation and identifying histologic features predictive of poor patient outcomes.
Copyright © 2024 The Author(s). Published by Wolters Kluwer Health, Inc.
Conflict of interest statement
Supported by the Break Through Cancer (BTC-IOC), the Richard W. TeLinde Endowment from the Johns Hopkins University, NIH/NCI (U2CCA271891, P50CA228991, R01CA260628, and R01CA215483). C.D. is a consultant to Exact Sciences and has been paid in equity and income. C.D. is a founder of Belay Diagnostics. C.D. is an inventor of some technologies. The companies named above as well as other companies have licensed previously described technologies related to the work described in this paper from Johns Hopkins University. Licenses to these technologies are or will be associated with equity or royalty payments to the inventors as well as Johns Hopkins University. The terms of all of these arrangements are being managed by Johns Hopkins University in accordance with its conflict of interest policies. Conflicts of Interest and Source of Funding: The authors have disclosed that they have no significant relationships with, or financial interest in, any commercial companies pertaining to this article.
Figures


References
-
- Piek JM, van Diest PJ, Zweemer RP, et al. Dysplastic changes in prophylactically removed Fallopian tubes of women predisposed to developing ovarian cancer. J Pathol. 2001;195:451–456. - PubMed
-
- Crum CP, Drapkin R, Miron A, et al. The distal fallopian tube: a new model for pelvic serous carcinogenesis. Curr Opin Obstet Gynecol. 2007;19:3–9. - PubMed
MeSH terms
Substances
Grants and funding
LinkOut - more resources
Full Text Sources
Medical
Research Materials
Miscellaneous

