. 2024 Jan 10;10(2):e24186.
doi: 10.1016/j.heliyon.2024.e24186. eCollection 2024 Jan 30.

Multi-epitopes vaccine design for surface glycoprotein against SARS-CoV-2 using immunoinformatic approach

Affiliations

Multi-epitopes vaccine design for surface glycoprotein against SARS-CoV-2 using immunoinformatic approach

Sarmad Frogh Arshad et al. Heliyon. .

Abstract

Background: The recent COVID vaccinations have successfully reduced death and severity but did not stop the transmission of viruses by the emerging SARS-CoV-2 strain. There is a need for better and long-lasting dynamic vaccines for numerous prevailing strains and the evolving SARS-CoV-2 virus, necessitating the development of broad-spectrum strains being used to stop infection by reducing the spread rate and re-infection. The spike (S) glycoprotein is one of the proteins expressed commonly in the early phases of SARS-CoV-2 infection. It has been identified as the most immunogenic protein of SARS-CoV-2.

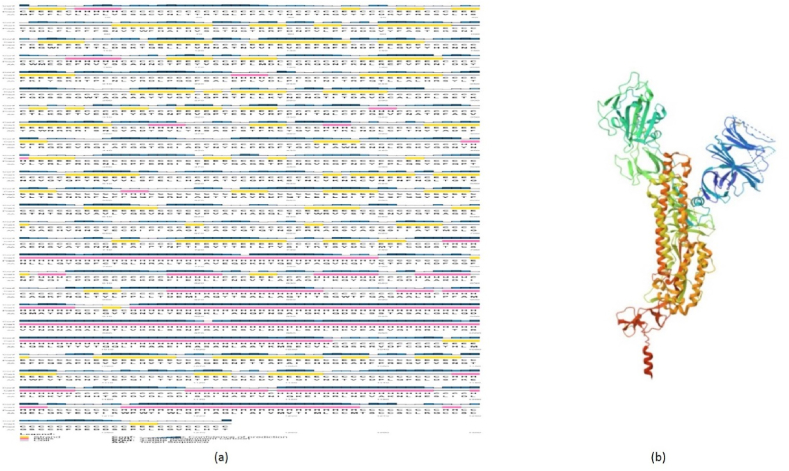
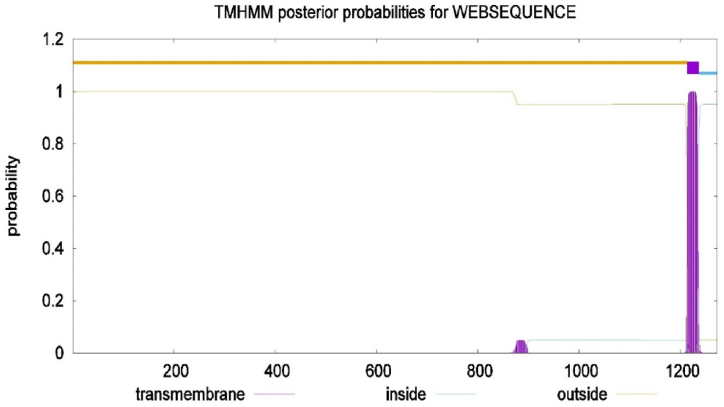
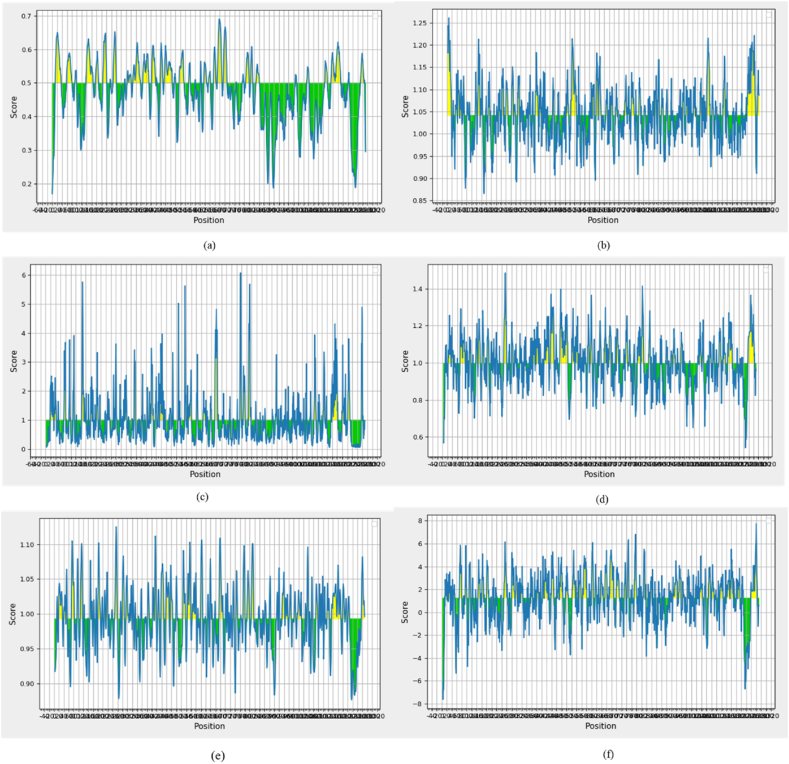
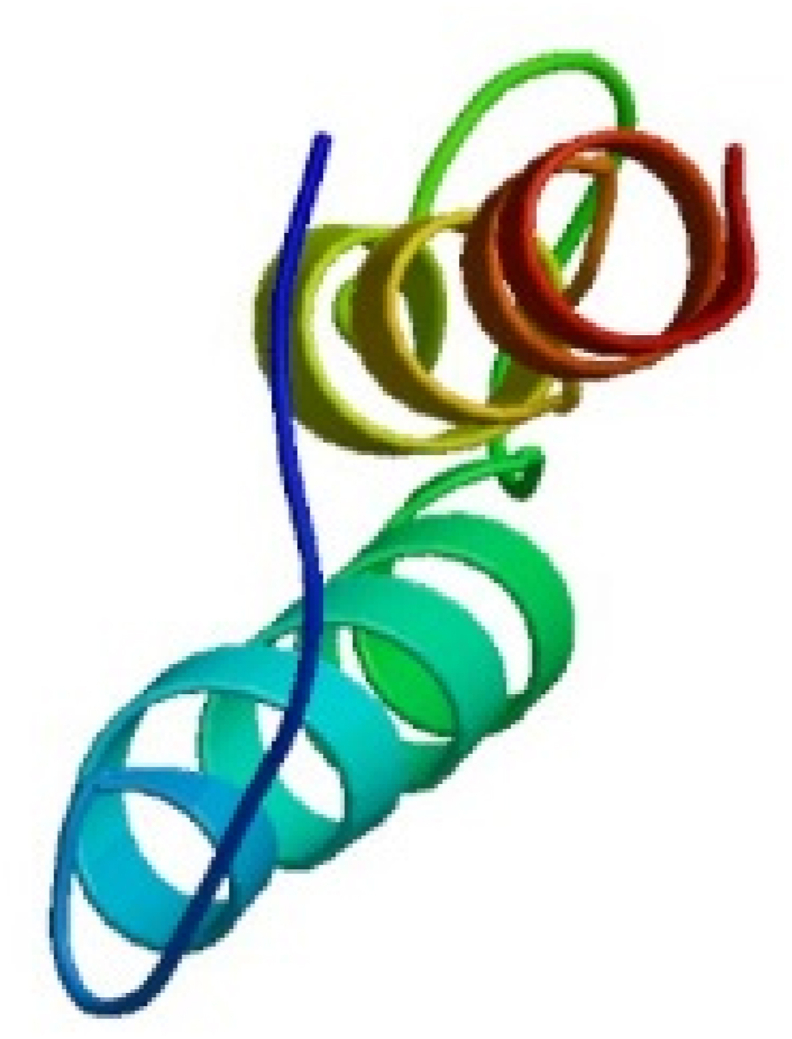
Methods: In this study, advanced bioinformatics techniques have been exploited to design the novel multi-epitope vaccine using conserved S protein portions from widespread strains of SARS-CoV-2 to predict B cell and T cell epitopes. These epitopes were selected based on toxicity, antigenicity score and immunogenicity. Epitope combinations were used to construct the maximum potent multi-epitope construct with potential immunogenic features. EAAAK, AAY, and GPGPG were used as linkers to construct epitopes.

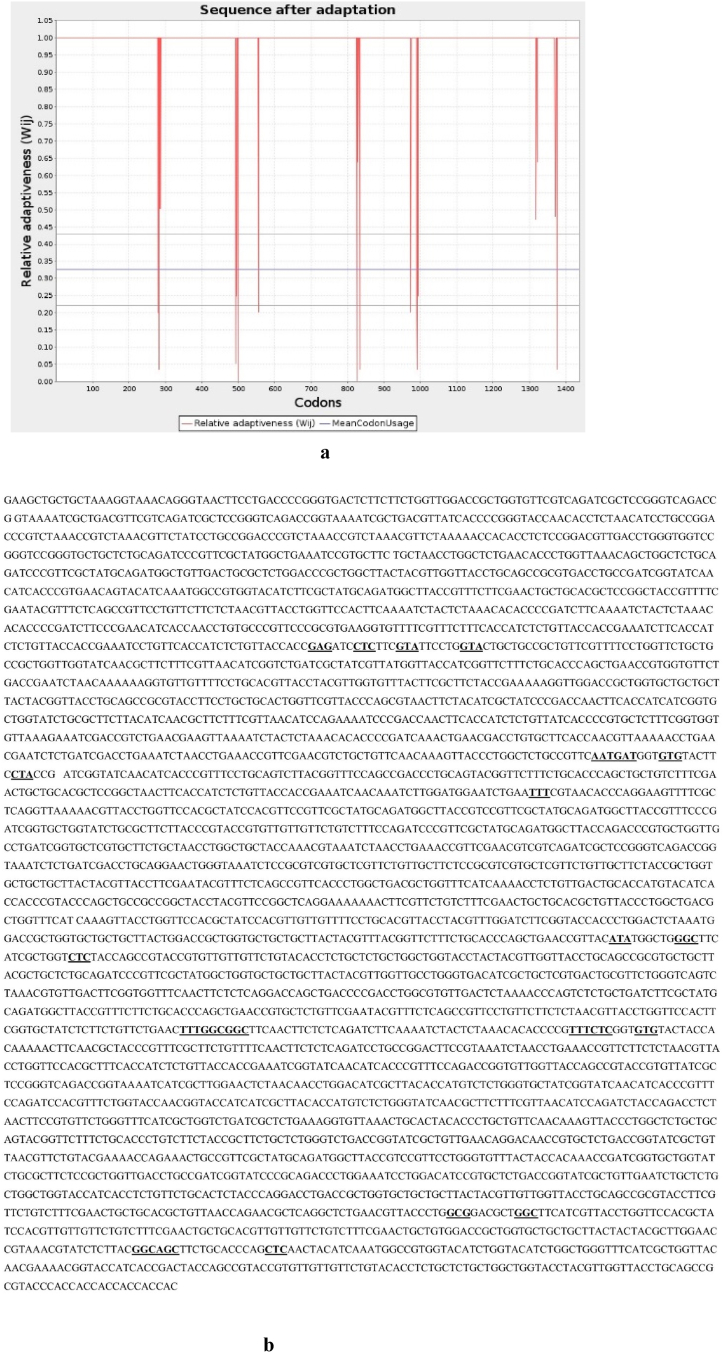
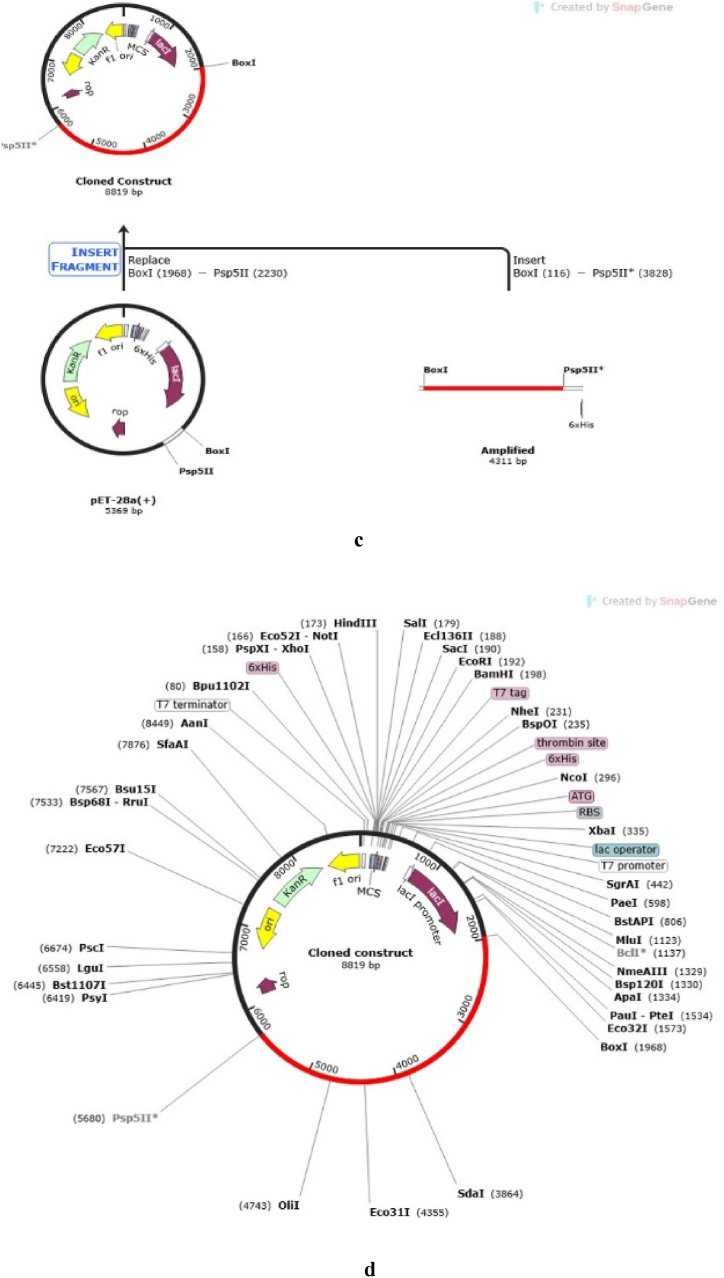
Results: The developed vaccine has shown positive results. After the chimeric vaccine construct was cloned into the PET28a (+) vector for expression screening in Escherichia coli, the potential expression of the construct was identified.

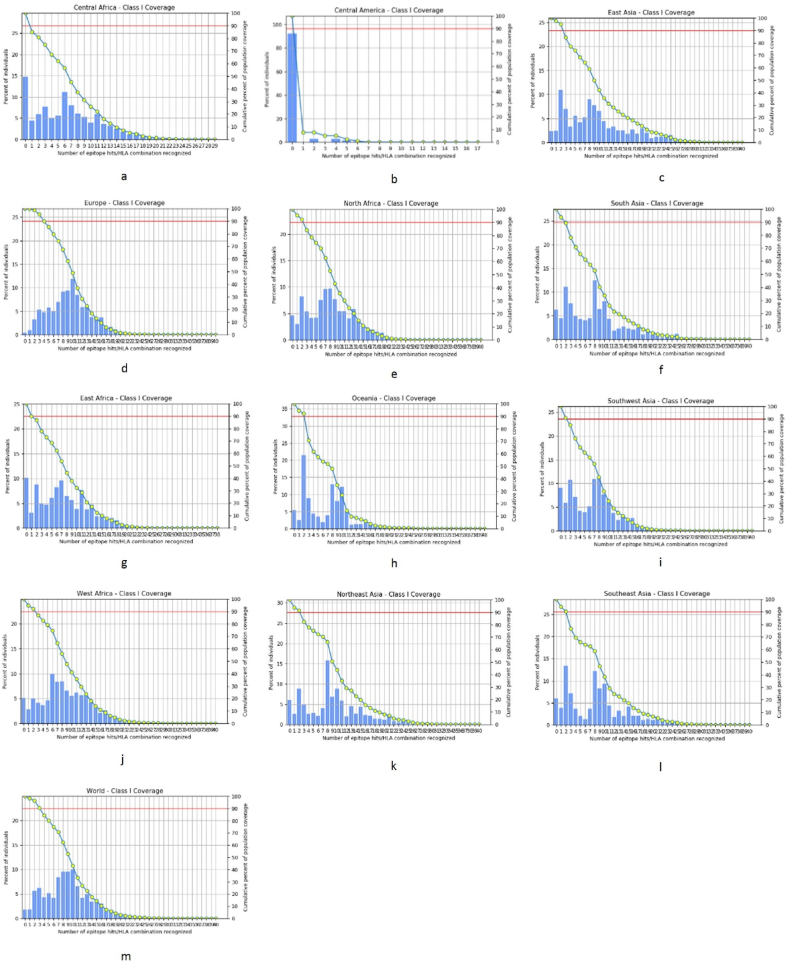
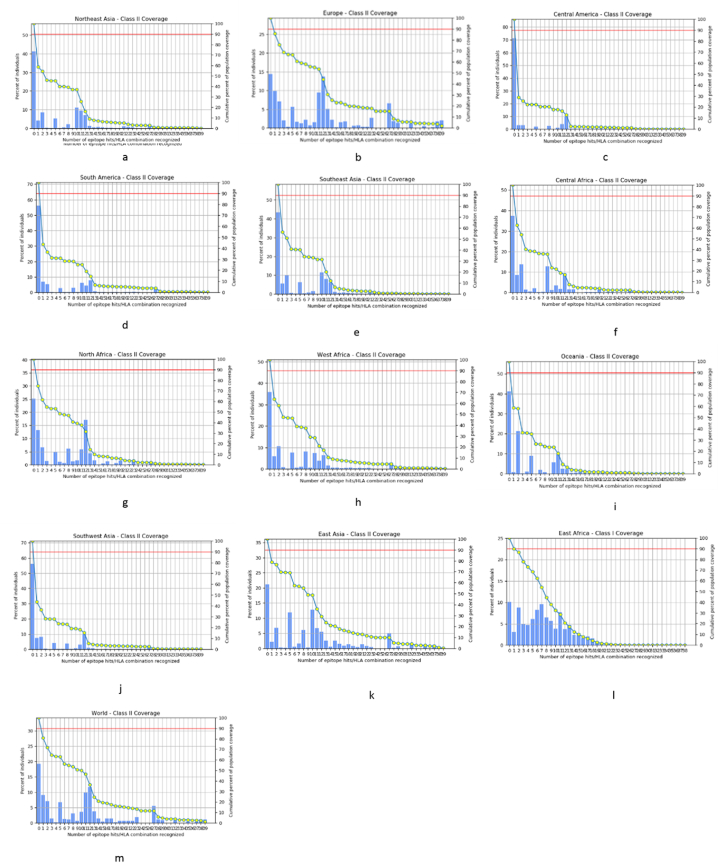
Conclusion: The construct vaccine performed well in computer-based immune response simulation and covered a variety of allelic populations. These computational results are more helpful for further analysis of our contract vaccine, which can finally help control and prevent SARS-CoV-2 infections worldwide.

Keywords: Antigenicity; B cell; Construct; Epitopes; Immune; Prediction; T cell; Vector.


Conflict of interest statement

The authors declare that they have no known competing financial interests or personal relationships that could have appeared to influence the work reported in this paper.

Figures

Fig. 1
Fig. 1
(a) Secondary structure prediction of SARS-CoV-2 S protein by PSIPERED analysis. (b) The 3D structure Prediction of the SARS-CoV-2 M protein by PDB online server.
Fig. 2
Fig. 2
Transmembrane helices prediction in proteins by TMHMM.
Fig. 3
Fig. 3
(a) Bepipred linear epitope prediction of the S protein. (b) Prediction of antigenicity of S protein by Kolaskar and Tongaonkar antigenicity scale. (c) Emini surface accessibility prediction of S protein. (d) Chou and Fasman's beta turn analysis technique is used to predict beta turns in the S protein. (e) Prediction of the flexibility of the S protein by Karplus and Schulz (f) Prediction of Hydrophilicity of S protein by Parker HydrophilicityPrediction.
Fig. 4
Fig. 4
Shows 3D structure of construct vaccine.
Fig. 5
Fig. 5
Based on MHC-I restriction data, population coverage was designed. The whole world, as well as all continents, have been chosen to evaluate the population coverage of specified epitopes. (a) Show 85.22 % population coverage of specified epitopes in Central Africa. (b) Show 28.74 % population coverage of specified epitopes in Central America. (c) Show 97.63 % population coverage of specified epitopes in East Asia. (d) Show 99.56 % population coverage of specified epitopes in Europe. (e) Show 95.31 % population coverage of specified epitopes in North Africa. (f) Show 93.77 % population coverage of specified epitopes in South Asia. (g) Show 89.94 % population coverage of specified epitopes in East Africa. (h) Show 94.60 % population coverage of specified epitopes in Oceania. (i) Show 90.93 % population coverage of specified epitopes in Southwest Asia. (j) Show 94.93 % population coverage of specified epitopes in West Africa. (k) Show 93.99 % population coverage of specified epitopes in Northeast Asia. (l) Show 90.1 % population coverage of specified epitopes in Southeast Asia. (m) Show 98.25 % population coverage of specified epitopes in World.
Fig. 6
Fig. 6
Based on MHC-II restriction data, population coverage was designed. The whole world, as well as all continents, have been chosen to evaluate the population coverage of specified epitopes. (a) Show 58.76 % population coverage of specified epitopes in Northeast Asia. (b) Show 85.67 % population coverage of specified epitopes in Europe. (c) Show 28.74 % population coverage of specified epitopes Central America. (d) Show 43.75 % population coverage of specified epitopes in South America. (e) Show 56.57 % population coverage of specified epitopes in Southeast Asia. (f) Show 62.54 % population coverage of specified epitopes in Central Africa. (g) Show 74.75 % population coverage of specified epitopes in North Africa. (h) Show 64.01 % population coverage of specified epitopes in West Africa. (i) Show 58.81 % population coverage of specified epitopes in Oceania. (j) Show 43.77 % population coverage of specified epitopes in Southwest Asia. (k) Show 78.82 % population coverage of specified epitopes in East Asia. (l) Show 68.30 % population coverage of specified epitopes in East Africa. (m) Show 80.79 % population coverage of specified epitopes in world.
Fig. 7
Fig. 7
Secondary structure of construct vaccine predicted by SOPMA tool.
Fig. 8
Fig. 8
secondary structure of constructed vaccine by PISPRED tool.
Fig. 9
Fig. 9
3D Structure of assemble vaccine protein.
Fig. 10
Fig. 10
Validation of refine structure shows 87.6 % residues in favored regions 11.3 % residues in allowed region and 0.6 % residues in outer region.
Fig. 11
Fig. 11
Docking complex of TLR-3 and the design vaccine.
Fig. 12
Fig. 12
The results of the IModS molecular dynamics simulation are shown in detail in the (a) represents the MNA mobility in the protein structure as it is, and figure (b) displays deformability, which exhibits limited deformation at all residues. The B-factor is indicated in (c). The eigon values in (d) are indicated as 6.218649e-05, and the difference given in (e) is shown in both red and green color. The elastic network and co-variance of the complex are also shown in the other (f) and (g) figures.
Fig. 13
Fig. 13
a. Codon optimization of designed vaccine construct. The result showed that optimized codon have a CAI score of 0.9698 and GC content is 51.82 %. b. Final DNA sequence of the vaccine after codon optimization. c. In silico PCR amplification of vaccine construct followed by addition of restriction sites and cloning in PET28 (+) vector. d. Recombinant plasmid obtained after cloning of peptide in vector. Vaccine construct is showed in red color and black line is representing the vector backbone.
Fig. 13
Fig. 13
a. Codon optimization of designed vaccine construct. The result showed that optimized codon have a CAI score of 0.9698 and GC content is 51.82 %. b. Final DNA sequence of the vaccine after codon optimization. c. In silico PCR amplification of vaccine construct followed by addition of restriction sites and cloning in PET28 (+) vector. d. Recombinant plasmid obtained after cloning of peptide in vector. Vaccine construct is showed in red color and black line is representing the vector backbone.

Similar articles

Cited by

References

    1. Ren L., Cui H., Wang Y., Ju F., Cai Y., Gang X., Wang G. The role of lipotoxicity in kidney disease: from molecular mechanisms to therapeutic prospects. Biomed. Pharmacother. 2023;161 doi: 10.1016/j.biopha.2023.114465. - DOI - PubMed
    1. Al-Qahtani W.S., Alneghery L.M., Alqahtani A.Q.S., Alkahtani M.D., Alkahtani S. A review of comparison study between corona viruses (Sars-cov, mers-cov) and novel corona virus (COVID-19) Rev. Mex. Ing. Quim. 2020;19:201–212. doi: 10.24275/rmiq/Bio1692. - DOI
    1. Rabaan A.A., Al-Ahmed S.H., Haque S., Sah R., Tiwari R., Malik Y.S., Dhama K., Yatoo M.I., Bonilla-Aldana D.K., Rodriguez-Morales A.J. SARS-CoV-2, SARS-CoV, and MERS-CoV: a comparative overview. Infez. Med. 2020;28:174–184. - PubMed
    1. Tiwari R., Dhama K., Sharun K., Iqbal Yatoo M., Malik Y.S., Singh R., Michalak I., Sah R., Bonilla-Aldana D.K., Rodriguez-Morales A.J. COVID-19: animals, veterinary and zoonotic links. Vet. Q. 2020;40:169–182. doi: 10.1080/01652176.2020.1766725. - DOI - PMC - PubMed
    1. Chu D.T., Vu Ngoc S.M., Vu Thi H., Nguyen Thi Y.V., Ho T.T., Hoang V.T., Singh V., Al-Tawfiq J.A. COVID-19 in Southeast Asia: current status and perspectives. Bioengineered. 2022;13:3797–3809. doi: 10.1080/21655979.2022.2031417. - DOI - PMC - PubMed

LinkOut - more resources