

Age-Related Alterations in Gray Matter Microstructure in Older People With Remitted Major Depression at Risk for Dementia
- PMID: 38298786
- PMCID: PMC10829634
- DOI: 10.1016/j.bpsgos.2023.08.018
Age-Related Alterations in Gray Matter Microstructure in Older People With Remitted Major Depression at Risk for Dementia
Abstract
Background: Major depressive disorder (MDD) in late life is a risk factor for mild cognitive impairment (MCI) and Alzheimer's disease. However, studies of gray matter changes have produced varied estimates of which structures are implicated in MDD and dementia. Changes in gray matter volume and cortical thickness are macrostructural measures for the microstructural processes of free water accumulation and dendritic spine loss.
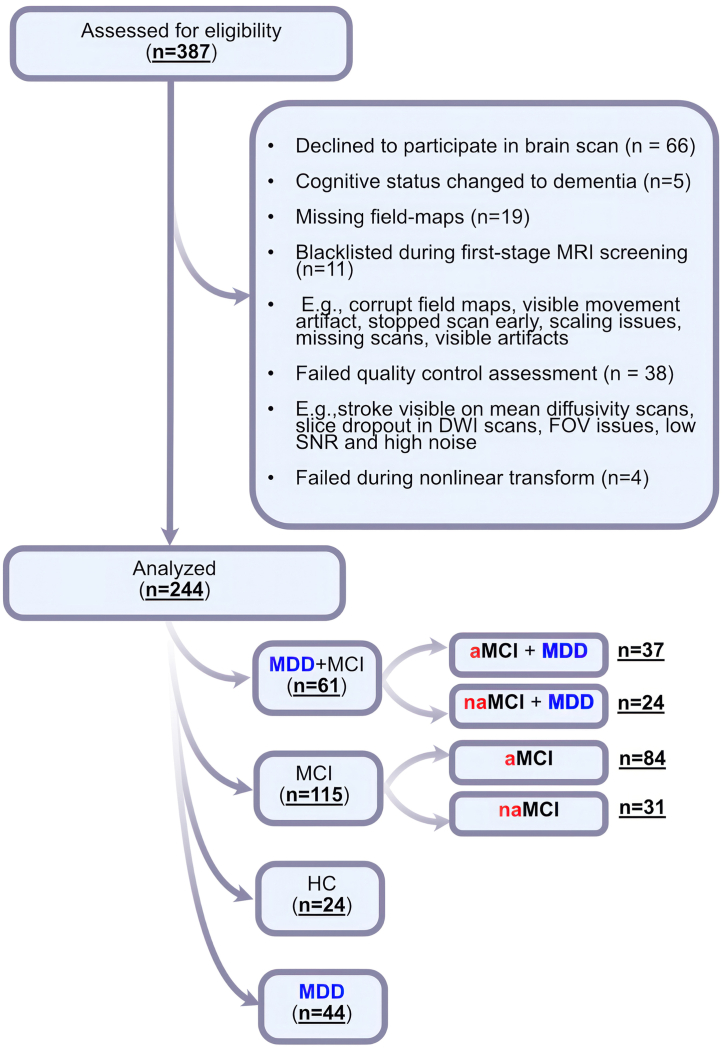
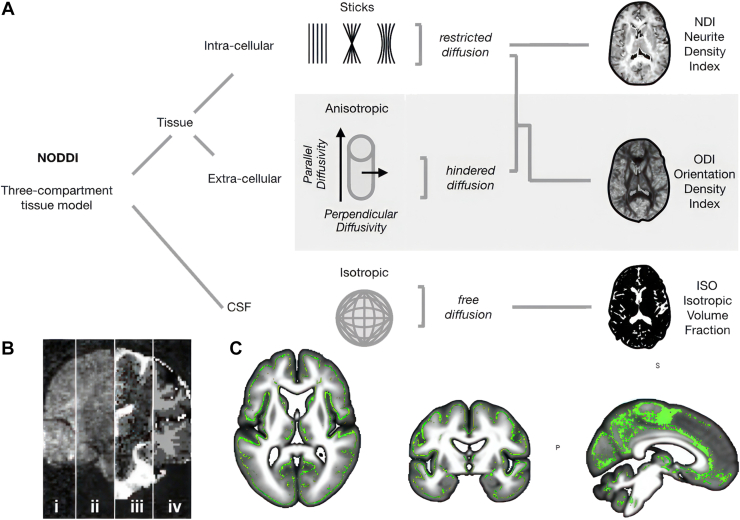
Methods: We conducted multishell diffusion imaging to assess gray matter microstructure in 244 older adults with remitted MDD (n = 44), MCI (n = 115), remitted MDD+MCI (n = 61), or without psychiatric disorders or cognitive impairment (healthy control participants; n = 24). We estimated measures related to neurite density, orientation dispersion, and free water (isotropic volume fraction) using a biophysically plausible model (neurite orientation dispersion and density imaging).
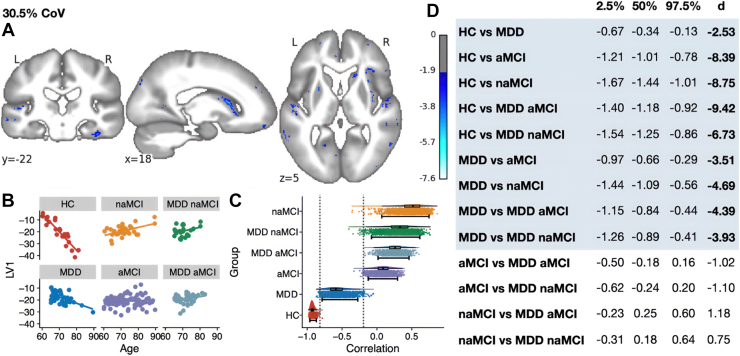
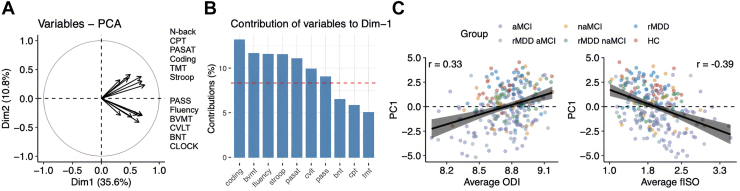
Results: Results showed that increasing age was correlated with an increase in isotropic volume fraction and a decrease in orientation dispersion index, which is consistent with neuropathology dendritic loss. In addition, this relationship between age and increased isotropic volume fraction was more disrupted in the MCI group than in the remitted MDD or healthy control groups. However, the association between age and orientation dispersion index was similar for all 3 groups.
Conclusions: The findings suggest that the neurite orientation dispersion and density imaging measures could be used to identify biological risk factors for Alzheimer's disease, signifying both conventional neurodegeneration observed with MCI and dendritic loss seen in MDD.
Keywords: Corticolimbic circuit; Dementia; Diffusion-weighted imaging; Fractional anisotropy; Frontal-executive circuit; Geriatric; Gray matter; MRI; Major depressive disorder; Mild cognitive impairment; Structural covariance; T1-weighted image.
© 2023 The Authors.
Figures


Similar articles
-
Frontal-executive and corticolimbic structural brain circuitry in older people with remitted depression, mild cognitive impairment, Alzheimer's dementia, and normal cognition.Neuropsychopharmacology. 2020 Aug;45(9):1567-1578. doi: 10.1038/s41386-020-0715-y. Epub 2020 May 18. Neuropsychopharmacology. 2020. PMID: 32422643 Free PMC article.
-
Brain-Cognition Associations in Older Patients With Remitted Major Depressive Disorder or Mild Cognitive Impairment: A Multivariate Analysis of Gray and White Matter Integrity.Biol Psychiatry. 2023 Dec 15;94(12):913-923. doi: 10.1016/j.biopsych.2023.05.018. Epub 2023 Jun 2. Biol Psychiatry. 2023. PMID: 37271418
-
Cortical Microstructural Alterations in Mild Cognitive Impairment and Alzheimer's Disease Dementia.Cereb Cortex. 2020 May 14;30(5):2948-2960. doi: 10.1093/cercor/bhz286. Cereb Cortex. 2020. PMID: 31833550 Free PMC article.
-
Structural magnetic resonance imaging for the early diagnosis of dementia due to Alzheimer's disease in people with mild cognitive impairment.Cochrane Database Syst Rev. 2020 Mar 2;3(3):CD009628. doi: 10.1002/14651858.CD009628.pub2. Cochrane Database Syst Rev. 2020. PMID: 32119112 Free PMC article.
-
Evidence for Structural and Functional Alterations of Frontal-Executive and Corticolimbic Circuits in Late-Life Depression and Relationship to Mild Cognitive Impairment and Dementia: A Systematic Review.Front Neurosci. 2020 Apr 17;14:253. doi: 10.3389/fnins.2020.00253. eCollection 2020. Front Neurosci. 2020. PMID: 32362808 Free PMC article.
References
-
- Jorm A.F. History of depression as a risk factor for dementia: An updated review. Aust N Z J Psychiatry. 2001;35:776–781. - PubMed
-
- Herrmann L.L., Goodwin G.M., Ebmeier K.P. The cognitive neuropsychology of depression in the elderly. Psychol Med. 2007;37:1693–1702. - PubMed
-
- Sheline Y.I., Barch D.M., Garcia K., Gersing K., Pieper C., Welsh-Bohmer K., et al. Cognitive function in late life depression: Relationships to depression severity, cerebrovascular risk factors and processing speed. Biol Psychiatry. 2006;60:58–65. - PubMed
LinkOut - more resources
Full Text Sources
