. 2024 Jan 5:48:102329.
doi: 10.1016/j.jcot.2023.102329. eCollection 2024 Jan.

Imaging modalities for non-acute pathologies of the foot and ankle

Affiliations

Imaging modalities for non-acute pathologies of the foot and ankle

Vijay Ram Kumar Papineni et al. J Clin Orthop Trauma. .

Abstract

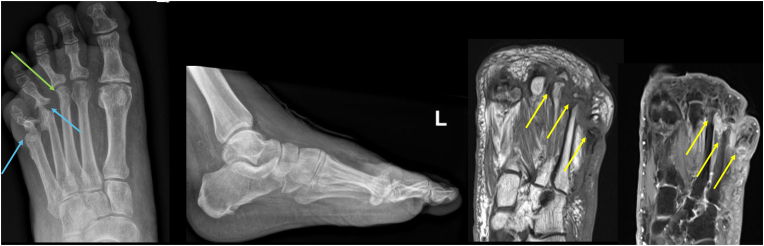
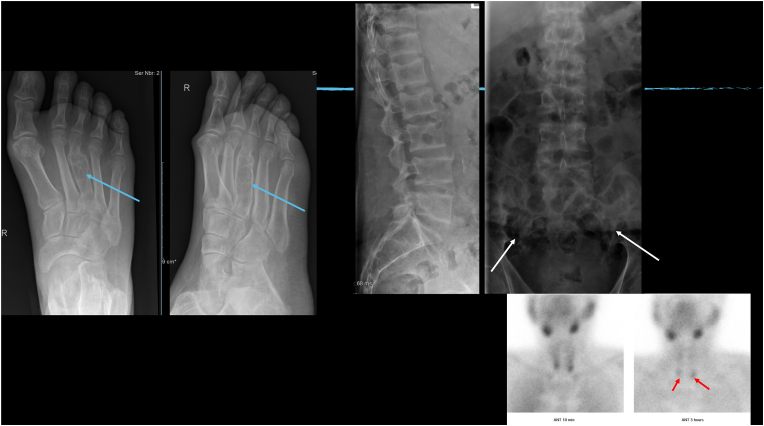
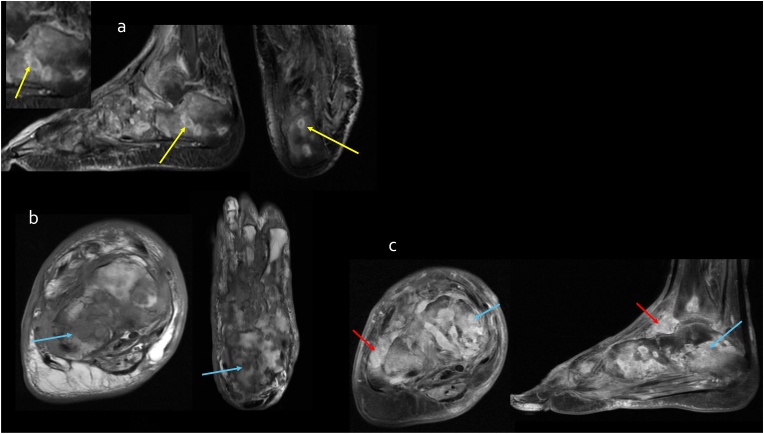
Chronic foot and ankle pain, in contrast to acute traumatic injuries, presents a diagnostic challenge due to its diverse underlying causes. Accurate diagnosis often necessitates the utilization of various imaging modalities, emphasizing the importance of selecting the most appropriate one. The intricate structure of the foot, composed of multiple bones and supported by soft tissues like ligaments and plantar fascia, gives rise to a spectrum of mechanical disorders, including stress fractures, plantar fasciitis, Morton's neuroma, and more. In addition to mechanical issues, non-acute abnormalities encompass inflammatory diseases affecting tendons and joints, benign tumors, tumor-like lesions, vascular abnormalities, and others. This article reviews the indispensable role of imaging in the assessment of these conditions, with a focus on plain radiography, computed tomography (CT), magnetic resonance imaging (MRI), and nuclear medicine studies, tailored to the specific clinical presentation. By providing insights into the selection and interpretation of imaging modalities, this article aims to assist clinicians in achieving accurate diagnoses and optimizing patient care for nonacute foot and ankle pathologies.

Keywords: Arthropathy; CT; Chronic; Foot and ankle; Imaging, Radiology; Joint; Ligament; MRI; Tendinopathy.


Conflict of interest statement

The authors declare that they have no known competing financial interests or personal relationships that could have appeared to influence the work reported in this paper.

Figures

Fig. 1
Fig. 1
Distal arch tendinopathy, retro calcaneal bursitis and haglund deformity a) Plain film of ankle showing bony enlargement (long arrow) at the posterosuperior aspect of calcaneum consistent with Haglund deformity. Soft-tissue thickening corresponding to insertional Achilles tendinosis (short arrow) and retrocalcaneal bursitis noted. b) Sagittal PDFS MRI shows insertional Achilles tendinosis (red arrow) and fluid distension of retro calcaneal bursa (blue arrow) consistent with Haglund’s syndrome. Note the subtle bone marrow oedema of the posterosuperior calcaneum (white arrow). (For interpretation of the references to color in this figure legend, the reader is referred to the Web version of this article.)
Fig. 2
Fig. 2
a) Plain radiograph of ankle showing marked sclerosis of the body of the talus. b) MRI of ankle T1 and PDFS sequences showing bone marrow infiltration with loss of normal fatty bone marrow signal on T1 and diffuse heterogeneous high T2 signal. Small ankle joint effusion. Open biopsy confirmed lymphoma of bone.
Fig. 3
Fig. 3
a) Axial and sagittal PDFS MRI of ankle joint showing fluid distension of retro malleolar peroneal tendon sheath (blue arrow), longitudinal splitting of the peroneus brevis tendon (red arrows) and thickened peroneus longus tendon (yellow arrow). Also note the peroneus quartus tendon (green arrow) which is from an accessary muscle. b) Dynamic ultrasound scan shows subluxation of peroneal tendons anteriorly from the retro malleolar grove. (For interpretation of the references to color in this figure legend, the reader is referred to the Web version of this article.)
Fig. 4
Fig. 4
a) Long axis panoramic ultrasound, short and long axis power doppler of Achilles tendon (blue arrow) showing abnormal thickening, loss of normal echotexture and neovascularization. b) Sagittal and axial PDFS MRI showing diffuse fusiform thickening of the Achilles tendon (blue arrow) with intrasubstance high T2 signal changes and oedema of the paratenon (yellow arrow). Appearances in keeping with severe Achilles tendinopathy. (For interpretation of the references to color in this figure legend, the reader is referred to the Web version of this article.)
Fig. 5
Fig. 5
a) Long axis and b) short axis ultrasound scan of the 2nd inter metatarsal space foot showing a hypoechoic nodule (arrow) in keeping with Mortons neuroma.
Fig. 6
Fig. 6
a) CT axial and sagittal reformats showing bilateral calcaneo navicular tarsal coalition (blue). b) Sagittal T1, PDFS and axial PDFS MRI showing calcaneo-navicular fibrous coalition (blue arrow) with associated bone marrow odema on ether side of the abnormal articulation. (For interpretation of the references to color in this figure legend, the reader is referred to the Web version of this article.)
Fig. 7
Fig. 7
A case of Gout. a) plain x-ray ankle showing extensive dense soft tissue swelling (yellow arrows) around the ankle joint. Plain x-ray of the big toe shows a punched out erosion (blue arrow) with over hanging edges involving the distal phalanx. b) Dual energy CT of the both feet and ankles show large deposits of monosodium urate tophi (red arrows) around both ankles and left big toe. (For interpretation of the references to color in this figure legend, the reader is referred to the Web version of this article.)
Fig. 8
Fig. 8
Coronal, sagittal and axial PDFS MRI of ankle joint showing fluid distension of the Flexor hallucis longus tendon sheath (blue arrow) in keeping with tenosynovitis. Note the absence of ankle joint effusion (white arrow). (For interpretation of the references to color in this figure legend, the reader is referred to the Web version of this article.)
Fig. 9
Fig. 9
A case of psoriasis. a) Plain x-ray foot showing pencil in cup appearance of the 4th and 5th MTP joints (blue arrows) which is a typical feature of psoriatic arthritis. Note the partial resorption of 3rd MT head (green arrow) b) Coronal T1 and PDFS MRI foot showing destructive changes of the 3rd, 4th and 5th MTP joints (yellow arrows) with pencil in cup appearance. (For interpretation of the references to color in this figure legend, the reader is referred to the Web version of this article.)
Fig. 10
Fig. 10
a & b. Plain radiograph of forefoot showing well defined punched out lucent lesions involving lateral aspect of the middle, proximal phalanges and proximal metatarsal giving scalloped appearance of the adjacent bony cortex with a sclerotic periosteal reaction. c, d & e. Coronal T1, PDFS and STIR MRI of 2nd toe and metatarsal showing lobulated high T2 and isointense T1 signal lesion abutting the adjacent cortex. No associated medullary bone or soft tissue oedema or matrix calcification. Appearances in keeping with periosteal chondromas.
Fig. 11
Fig. 11
a) CT foot with multiplanar reformats showing small focal lucent lesion involving the cuboid bone in the subarticular location with a tiny focal dense nidus (blue arrow) b) MRI of ankle sagittal and coronal PDFS and axial T1 sequences showing significant bone marrow oedema with in the cuboid bone which is high on T2 and low on T1 sequences (yellow arrow). Appearances in keeping with Osteoid osteoma. C) Planning CT of foot showing the osteoid osteoma (green arrow) which was treated with RF ablation. Note the RF ablation probe in situ (red arrow). (For interpretation of the references to color in this figure legend, the reader is referred to the Web version of this article.)
Fig. 12
Fig. 12
a. CT image, b. SPECT fused image of a patient with previous ankle joint fusion and on going pain. The study shows increased uptake at the talonavicular joint (yellow arrow) with subchondral sclerosis on CT component (blue arrow) in keeping with secondary osteoarthritis of the Talonavicular joint exaggerated by ankle joint fusion. (For interpretation of the references to color in this figure legend, the reader is referred to the Web version of this article.)
Fig. 13
Fig. 13
a) Coronal reformats of bilateral ankle CT showing markedly comminuted left talar fractures (red arrow). b) Check x-ray post internal fixation of talar fracture with metallic screws in situ. c) Proton density Fat Sat (PDFS) sagittal and coronal images of ankle showing established avascular necrosis of talus with collapsed talar articular surface with severe subchondral bone marrow oedema (white arrow). Secondary OA changes of ankle joint. Also note severe Achilles tendinopathy with fusiform thickening of the Achilles tendon (blue arrow) approximately 4 cm from its distal attachment with intrasubstance high T2 signal changes. (For interpretation of the references to color in this figure legend, the reader is referred to the Web version of this article.)
Fig. 14
Fig. 14
A case of glomus tumour a) Normal appearance of plain film of big toe, b) Ultrasound of the nail bed showing subungual hypoechoic nodular lesion (red arrow) at the region of maximum tenderness. Marked hypervascularity on doppler noted. c) MRI T2 STIR images showing hyperintense nailbed nodule (thin red arrow) causing scalloping of the underlying bone (blue arrow). T1 sequence showing low to intermediate signal subungual nodule. T1 post contrast images showing avid contrast enhancement due to high vascularity (thin red arrow). (For interpretation of the references to color in this figure legend, the reader is referred to the Web version of this article.)
Fig. 15
Fig. 15
a) US scan of a soft tissue lump (blue arrow) with well defined smooth margins over the plantar aspect of the flexor tendon of 2nd toe at the level of the PIP joint. It is predominantly hypo to isoechoic to the subcutaneous fat with no significant internal doppler signal. b) Sagittal PDFS and Axial T1 sequences show high T2 and isointense T1 soft tissue lump (blue arrow) attached to the flexor tendon sheath in keeping with giant cell tumour of tendon sheath. (For interpretation of the references to color in this figure legend, the reader is referred to the Web version of this article.)
Fig 16
Fig 16
a) Plain film of the lateral ankle showing a well defined thin walled lucent lesion with no matrix calcification. b) Sagittal T1 image shows fatty lesion with hypointense inclusions. Sagittal and coronal PDFS images show fat suppression with areas of hyper intensity suggesting granulation tissue (stage 2 intra osseous lipoma).
Fig. 17
Fig. 17
Sagittal PD and PDFS, axial T1 and PDFS MRI of the ankle showing diffuse fusiform thickening of the plantar fascia with high T2 signal changes in keeping with plantar fibromatosis. Areas of abnormal high signal intensity on T2 and STIR images reflect the relative proportions of cellular elements within the mass.
Fig. 18
Fig. 18
a) Plain film showing an expansile cystic lesion (blue arrow) involving the 3rd metatarsal shaft with no cortical destruction. No matrix calcification. b) Plain x-ray of the lumbar spine showing rugger jersey appearance and widening of the bilateral SI joints (white arrow) which are sequelae of renal osteodystrophy. c) Early and delayed MIBI scan showing retained hyperactivity of parathyroid glands (red arrow) on the delay images suggesting secondary hyperparathyroidism. (For interpretation of the references to color in this figure legend, the reader is referred to the Web version of this article.)
Fig. 19
Fig. 19
A case of Charcot arthropathy with midfoot osteomyelitis. a) Radiographs of the foot in AP, oblique and lateral projections. There is involvement of the tarso metatarsal articulations (blue arrows) with lateral subluxation of the metatarsal bones. The lateral radiograph shows the typical inferior subluxation of the talar head (yellow arrow); the cuboid (red arrow), typically becoming the most inferior weight bearing bone of the foot. Note the lager plantar ulcer (arrow head) b) Sagittal MRI of foot and ankle (T1, STIR and post contrast sequences) T1 image shows huge signal drop (arrows) in the fatty bone marrow (white asterisks). STIR image shows massive bone marrow oedema (yellow asterisks) in metatarsal bone, navicular bone, and cuneiform bones. There is soft tissue oedema with a large plantar ulcer (white arrow) reaching up to the bone surfaced of cuboid (blue asterisks). There is a degree of bone destruction and fragmentation in the mid foot joints. (For interpretation of the references to color in this figure legend, the reader is referred to the Web version of this article.)
Fig. 20
Fig. 20
PD and PDFS and post contrast images of the big toe at the level of 1st MTP joint showing deep plantar ulcer (white arrow) reaching up to the sesamoid bones. Bone marrow oedema noted involving the lateral sesamoid bone (red arrow) with surrounding fluid signal. (For interpretation of the references to color in this figure legend, the reader is referred to the Web version of this article.)
Fig. 21
Fig. 21
a) A case of secondary osteoarthritis due to haemophilia. AP and lateral views of the plain film of the ankle joint showing subchondral sclerosis, severe joint space narrowing, incongruence between joint surfaces and large anterior and posterior osteophytes. b) Sagittal and coronal CT reformats of ankle joint showing subchondral cyst, severe loss of joint space and marginal osteophytosis. Note the involvement of the subtalar joint with severe OA.
Fig. 22
Fig. 22
a) Plain x-ray of the ankle joint showing a thin walled, non expansile, cystic lesion (blue arrow) with in the distal tibia reaching the joint surface. b) CT also shows a thin walled benign looking, cystic lesion (yellow arrow) which appears to be communicating with the joint surface. c)S agittal, coronal and axial MRI of ankle showing thin walled, non expansile cystic lesion (red arrow) containing thing septations and no fluid levels. Appearances most in keeping with a Geode. (For interpretation of the references to color in this figure legend, the reader is referred to the Web version of this article.)
Fig. 23
Fig. 23
Plain films of the foot showing moth eaten appearance with multiple well defined punched out lytic defects (yellow arrows), complete destruction of 3rd metatarsal (red arrow), marked joint space reduction, cortical irregularity, periosteal reaction, and patchy areas of increased sclerosis. (For interpretation of the references to color in this figure legend, the reader is referred to the Web version of this article.)
Fig. 24
Fig. 24
a) Sagittal and axial PDFS MRI images showing multiple rounded abnormal T2 and STIR bright signal bone lesions showing “dot in a circle sign” (yellow arrow) with central hypointense dot representing the fungal granule and surrounding high T2 signal rim representing granulation tissue. b) T1 pre contrast MRI shows moth eaten appearance of the bones (blue arrows). c) Post contrast MRI images showing florid contrast enhancement of the bone (blue arrows) and soft tissues (red arrows). Appearances in keeping with Madura foot. (For interpretation of the references to color in this figure legend, the reader is referred to the Web version of this article.)
Fig. 25
Fig. 25
a) Lateral plain x-ray of a child with posterior heel pain shows increase in the density of the calcaneal apophysis (white arrow). b) Sagittal PDFS and T1 MRI of ankle shows oedematous changes within the calcaneal apophysis (blue arrow) which appears to extend into the adjacent calcaneal tuberosity (yellow arrow). Appearances in keeping with Sever’s disease. (For interpretation of the references to color in this figure legend, the reader is referred to the Web version of this article.)
Fig. 26
Fig. 26
Coronal PDFS and T1 MRI of ankle showing high T2 signal (oedema) in the sinus tarsi fat which appears almost completely obliterated on the T1 sequence (blue arrow). Axial PDFS sequence of the same patient shows a ganglion cyst (yellow arrow) over the lateral aspect of the foot over lying cuboid arising from the sinus tarsi. (For interpretation of the references to color in this figure legend, the reader is referred to the Web version of this article.)
Fig. 27
Fig. 27
Sagittal PDFS and T1 MRI of ankle showing bone marrow oedema with in the Os trigonum (blue arrow) with posterior capsular thickening (yellow arrow) and oedema in keeping with posterior impingment. Note the prominent anterior osteophytosis of tibia (red arrow) with bone morrow oedema of tibial plafond suggesting anterior impingment. There is also obliteration of sinus tarsi fat (green arrow) on T1 sequence in keeping with sinus tarsi syndrome. (For interpretation of the references to color in this figure legend, the reader is referred to the Web version of this article.)
Fig. 28
Fig. 28
a) lateral view of the ankle showing a continuous C-shaped arc (blue arrows) which is formed by the medial outline of the talar dome and posteroinferior aspect of the sustentaculum tali due to their bridging. b) PDFS sagittal and coronal MRI of ankle showing an extra-articular, non-osseous coalition located posterior to the middle facets of the talus and calcaneus with an os sustentaculum (white arrow). (For interpretation of the references to color in this figure legend, the reader is referred to the Web version of this article.)

References

    1. Lau B.C., Allahabadi S., Palanca A., Oji D.E. Understanding radiographic measurements used in foot and ankle surgery. J Am Acad Orthop Surg. 2022;30(2):e139–e154. - PubMed
    1. Götz J., Grifka J., Baier C. Hindfoot deformities in adults. Conservative and surgical treatment. Orthopä. 2016;45(1):97–110. - PubMed
    1. Hughes J.S., Watson S.J., Jones A.L., Oatway W.B. Review of the radiation exposure of the UK population. J Radiol Prot. 2005;25(4):493–496. - PubMed
    1. Kilcoyne R.F., Richardson M.L., Porter B.A., Olson D.O., Greenlee T.K., Lanzer W. Magnetic resonance imaging of soft tissue masses. Clin Orthop Relat Res. 1988;(228):13–19. - PubMed
    1. Elsaman A.M., Mostafa E.S., Radwan A.R. Ankle evaluation in active rheumatoid arthritis by ultrasound: a cross-sectional study. Ultrasound Med Biol. 2017;43(12):2806–2813. - PubMed

LinkOut - more resources