. 2024 Jan 17:14:1193079.
doi: 10.3389/fimmu.2023.1193079. eCollection 2023.

Analyses of human vaccine-specific circulating and bone marrow-resident B cell populations reveal benefit of delayed vaccine booster dosing with blood-stage malaria antigens

Affiliations

Analyses of human vaccine-specific circulating and bone marrow-resident B cell populations reveal benefit of delayed vaccine booster dosing with blood-stage malaria antigens

Jordan R Barrett et al. Front Immunol. .

Abstract

We have previously reported primary endpoints of a clinical trial testing two vaccine platforms for the delivery of Plasmodium vivax malaria DBPRII: viral vectors (ChAd63, MVA), and protein/adjuvant (PvDBPII with 50µg Matrix-M™ adjuvant). Delayed boosting was necessitated due to trial halts during the pandemic and provides an opportunity to investigate the impact of dosing regimens. Here, using flow cytometry - including agnostic definition of B cell populations with the clustering tool CITRUS - we report enhanced induction of DBPRII-specific plasma cell and memory B cell responses in protein/adjuvant versus viral vector vaccinees. Within protein/adjuvant groups, delayed boosting further improved B cell immunogenicity compared to a monthly boosting regimen. Consistent with this, delayed boosting also drove more durable anti-DBPRII serum IgG. In an independent vaccine clinical trial with the P. falciparum malaria RH5.1 protein/adjuvant (50µg Matrix-M™) vaccine candidate, we similarly observed enhanced circulating B cell responses in vaccinees receiving a delayed final booster. Notably, a higher frequency of vaccine-specific (putatively long-lived) plasma cells was detected in the bone marrow of these delayed boosting vaccinees by ELISPOT and correlated strongly with serum IgG. Finally, following controlled human malaria infection with P. vivax parasites in the DBPRII trial, in vivo growth inhibition was observed to correlate with DBPRII-specific B cell and serum IgG responses. In contrast, the CD4+ and CD8+ T cell responses were impacted by vaccine platform but not dosing regimen and did not correlate with in vivo growth inhibition in a challenge model. Taken together, our DBPRII and RH5 data suggest an opportunity for protein/adjuvant dosing regimen optimisation in the context of rational vaccine development against pathogens where protection is antibody-mediated.

Keywords: B cells; T cells; antibody; bone marrow; malaria; memory B cells; plasma cells; vaccine dosing regimen.


Conflict of interest statement

SD is a named inventor on patent applications relating to RH5 malaria vaccines and adenovirus-based vaccines and is an inventor on intellectual property licensed by Oxford University Innovation to AstraZeneca. AM has an immediate family member who is an inventor on patent applications relating to RH5 malaria vaccines and adenovirus-based vaccines and is an inventor on intellectual property licensed by Oxford University Innovation to AstraZeneca. CC is an inventor on patents that relate to binding domains of erythrocyte-binding proteins of Plasmodium parasites including P. vivax DBP. The remaining authors declare that the research was conducted in the absence of any commercial or financial relationships that could be construed as a potential conflict of interest.

Figures

Figure 1
Figure 1
Vaccine-specific plasma cell and memory IgG+ B cell responses. PBMC from pre-vaccination (Day 0) and post-final vaccination (FV) time points were analysed for B cell responses by flow cytometry; gating strategies are as described in Methods and Supplementary Figures 1 and 3. Frequencies of DBPRII-specific B cells – identified by probe staining – were compared between vaccine platforms (A, B) or protein/adjuvant dosing regimens (C, D) within both plasma cell (A, C) or memory IgG+ B cell (B, D) populations. Similarly, frequencies of RH5-specific B cells were compared between protein/adjuvant dosing regimens within plasma cells (E) and memory IgG+ B cells (F). IgM+, IgA+, activated and resting memory B cell responses are shown in Supplementary Figures 2 and 4. VV = ChAd63-MVA viral vectors [monthly and delayed dosing]; PA = PvDBPII protein/adjuvant [PA-M and PA-D]; PA-M = PvDBPII protein/adjuvant monthly dosing; PA-D = PvDBPII protein/adjuvant delayed booster dosing; PA-DB = PvDBPII protein/adjuvant delayed booster dosing with extra booster; M = RH5.1/adjuvant monthly dosing; D = RH5.1/adjuvant delayed booster dosing. Post-vaccination comparisons were performed between DBPRII platforms (A, B) or RH5 dosing regimens (E, F) with Mann-Whitney U tests or between PvDBPII protein/adjuvant dosing regimens by Kruskal Wallis test with Dunn’s correction for multiple comparisons (C, D). Sample sizes for all assays were based on sample availability; each circle represents a single sample. (A, B) VV/PA: Day 0 = 8/5-6, FV+7 = 8/12, FV+14 = 8/12, FV+28 = 8/10. (C, D) PA-M/PA-D/PA-DB: Day 0 = 3-4/2/na, FV+7 = 4/8/5, FV+14 = 4/8/4, FV+28 = 4/6/5. (E, F) M/D: Day 0 = 5/1-4, FV+7 = 4-5/3-4, FV+14 = 4/6, FV+28 = 4/4. PA-D vaccinees returning in the PA-DB group are connected by lines. Bars represent medians. * p < 0.05, ** p < 0.01.
Figure 2
Figure 2
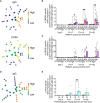
Vaccine-specific responses within agnostically-defined B cell populations using CITRUS. CITRUS was run on single live (B cell-enriched) lymphocyte flow cytometry fcs files to agnostically define the main B cell populations within either DBPRII (A–C) or RH5 (D, E) trial samples. Clusters identified by CITRUS are visualised in dendrograms (A, D), colour-coded for example markers of interest [(A)- IgG, CD38; (D)- IgG]. Each node represents a cluster. Median marker expression within each cluster was used to define gating strategies for B cell populations in FlowJo, which were re-analysed for DBPRII- (B, C) or RH5-specific (E) responses through probe staining (gating shown in Supplementary Figure 5). See Table 2 and Supplementary Figures 6, 7 for a full list of populations identified via CITRUS clusters for further analysis. VV-M = ChAd63-MVA viral vector monthly dosing; VV-D ChAd63-MVA delayed booster dosing; PA-M = PvDBPII protein/adjuvant monthly dosing; PA-D = PvDBPII protein/adjuvant delayed booster dosing; PA-DB = PvDBPII protein/adjuvant delayed booster dosing with extra booster; M = RH5.1/adjuvant monthly dosing; D = RH5.1/adjuvant delayed booster dosing. FV = final vaccination. Post-vaccination comparisons were performed between PvDBPII protein/adjuvant dosing regimens by Kruskal Wallis test with Dunn’s correction for multiple comparisons (B, C) or RH5 dosing regimens (E) with Mann-Whitney U tests. Sample sizes for all assays were based on sample availability; each circle represents a single sample. (B, C) VV-M/VV-D/PA-M/PA-D/PA-DB: Day 0 = 6/2/4/2/na, FV+7 = 6/2/4/8/5, FV+14 = 6/2/4/8/4, FV+28 = 6/2/4/6/5. (E) M/D: Day 0 = 5/2, FV+7 = 5/4, FV+14 = 4/6, FV+28 = 4/4. PA-D vaccinees returning in the PA-DB group are connected by lines. Bars represent medians. * p < 0.05, ** p < 0.01.
Figure 3
Figure 3
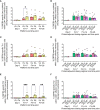
DBPRII-specific peak antibody responses and serum maintenance. Standardised ELISAs were developed to report anti-DBPRII specific antibody responses against the Sal I strain in pre-vaccination (Day 0) and post-final vaccination (FV) serum samples. Responses were compared between protein/adjuvant dosing regimens for IgG1 (A), IgG3 (B), IgG4 (C), IgA (D), IgA1 (E), and IgM (F). Fold change between C+96 and FV+14 was calculated for total IgG (G) and specific isotypes/subclasses (H) to compare monthly (M: VV-M, PA-M) and delayed (D: VV-D, PA-D) booster regimens. IgG4 and IgA1 were excluded from this analysis as ≥1 vaccinee had undetectable antibodies at both time points. Comparisons between vaccine platforms are shown in Supplementary Figure 8. VV-M = ChAd63-MVA viral vector monthly dosing; VV-D ChAd63-MVA delayed booster dosing; PA-M = protein/adjuvant monthly dosing; PA-D = protein/adjuvant delayed booster dosing; PA-DB = protein/adjuvant delayed booster dosing with extra booster. C+96 = 96 days after controlled human malaria infection (approximately 16 weeks after FV). Post-vaccination comparisons were performed between protein/adjuvant dosing regimens by Kruskal Wallis test with Dunn’s correction for multiple comparisons (A–F) or fold changes with Mann-Whitney U tests (G, H). Sample sizes for all assays were based on sample availability; each circle represents a single sample [triangles indicate viral vector samples in (G, H)]. (A–F) VV-M/VV-D/PA-M/PA-D/PA-DB: Day 0 = 6/2/4/8/na, FV+14 = 6/2/4/8/4, FV+28 = 6/2/4/6/5. (G, H) M = 9-10, D = 9. Bars represent medians. * p < 0.05, ** p < 0.01.
Figure 4
Figure 4
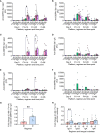
DBPRII-specific CD4+ effector memory T cell responses. PBMC from pre-vaccination (Day 0) and post-final vaccination (FV) time points were analysed for T cell responses by intracellular cytokine staining; gating strategies are as described in Methods and Supplementary Figure 9. In brief, DBPRII-specific effector memory CD4+ T cells are reported as frequencies producing cytokines in response to peptide stimulation after background subtraction of cytokine-positive cells in matched samples cultured with media alone. DBPRII-specific responses were compared between vaccine platforms or protein/adjuvant dosing regimens as defined by the production of any cytokine [IL-2, IL-5, IL-13, IFN-γ, TNF-α] (A, B), any Th1 cytokine [IL-2, IFN-γ, TNF-α] (C, D), or any Th2 cytokine [IL-5, IL-13] (E, F). CD8+ effector memory T-cell responses are shown in Supplementary Figure 10. VV = ChAd63-MVA viral vectors [monthly and delayed dosing]; PA = PvDBPII protein/adjuvant [PA-M and PA-D]; PA-M = PvDBPII protein/adjuvant monthly dosing; PA-D = PvDBPII protein/adjuvant delayed booster dosing; PA-DB = PvDBPII protein/adjuvant delayed booster dosing with an extra booster. Post-vaccination comparisons were performed between PvDBPII platforms by Mann Whitney U test (A, C, E), or protein/adjuvant dosing regimens by Kruskal Wallis test with Dunn’s correction for multiple comparisons (B, D, F). Sample sizes for all assays were based on sample availability; each circle represents a single sample. (A, C, E) VV/PA: Day 0 = 7/12, FV+7 = 8/11, FV+14 = 8/11, FV+28 = 8/10. (B, D, E) PA-M/PA-D/PA-DB: Day 0 = 4/8/na, FV+7 = 4/7/6, FV+14 = 4/7/5, FV+28 = 4/6/5. PA-D vaccinees returning in the PA-DB group are connected by lines. Bars represent medians. * p < 0.05, ** p < 0.01, *** p < 0.001.
Figure 5
Figure 5
Correlations between circulating DBPRII-specific B cells and in vivo growth inhibition of P. vivax parasites or maintenance of serum antibody. In vivo growth inhibition (IVGI) of P. vivax parasites following post-vaccination controlled human malaria infection (CHMI) was calculated from qPCR data as described in the Methods. Spearman correlations were performed between IVGI and the peak frequency of DBPRII-specific memory IgG+ B cells at FV+14 (A) or plasma cells at FV+7 (B) as defined in Supplementary Figure 1 and reported in Figure 1. Spearman correlations were also performed between C+96/FV+14 fold change in total anti-DBPRII IgG (Sal I strain; see Figure 3) and memory IgG+ B cells at FV+14 (C) or plasma cell at FV+7 (D). VV-M = ChAd63-MVA viral vector monthly dosing; VV-D ChAd63-MVA delayed booster dosing; PA-M = protein/adjuvant monthly dosing; PA-D = protein/adjuvant delayed booster dosing. C+96 = 96 days after controlled human malaria infection (approximately 16 weeks after FV). Spearman rho, p-values, and sample sizes are annotated on individual graphs. Each circle represents a single sample.
Figure 6
Figure 6
RH5-specific bone marrow plasma cell responses and correlations with serum antibody or circulating RH5-specific cells. RH5-specific bone marrow plasma cells were detected in B cells enriched from pre- and post-final vaccination (FV) bone marrow mononuclear cells and assayed by IgG antibody-secreting cell ELISPOT as described in the Methods. The frequency of RH5-specific IgG plasma cells (antibody-secreting cells) per million bone marrow B cells was compared between dosing regimens (A). Spearman correlation analyses were performed between RH5-specific bone marrow B cells and matched time point serum IgG (B), matched time point frequency of RH5-specific cells within CITRUS-guided “Population 12” [CD19+CD20+CD21+CD27+CD138-CD38+IgM-IgA-IgG+; see Table 2, Figure 2, Supplementary Figure 5] (C), and between RH5-specific bone marrow B cells at FV+28 and “Population 12” at FV+14 (D). M = RH5.1/adjuvant monthly dosing; D = RH5.1/adjuvant delayed booster dosing. Post-vaccination comparisons were performed between dosing regimens by Mann Whitney U test [(A); not significant]. Spearman rho, p-values, and sample sizes are annotated on individual graphs. Each circle represents a single sample.

References

    1. Flaxman A, Marchevsky NG, Jenkin D, Aboagye J, Aley PK, Angus B, et al. . Reactogenicity and immunogenicity after a late second dose or a third dose of ChAdOx1 nCoV-19 in the UK: a substudy of two randomised controlled trials (COV001 and COV002). Lancet (2021) 398:981–90. doi: 10.1016/S0140-6736(21)01699-8 - DOI - PMC - PubMed
    1. Voysey M, Costa Clemens SA, Madhi SA, Weckx LY, Folegatti PM, Aley PK, et al. . Single-dose administration and the influence of the timing of the booster dose on immunogenicity and efficacy of ChAdOx1 nCoV-19 (AZD1222) vaccine: a pooled analysis of four randomised trials. Lancet (2021) 397:881–91. doi: 10.1016/S0140-6736(21)00432-3 - DOI - PMC - PubMed
    1. Payne RP, Longet S, Austin JA, Skelly DT, Dejnirattisai W, Adele S, et al. . Immunogenicity of standard and extended dosing intervals of BNT162b2 mRNA vaccine. Cell (2021) 184(23):5699–714. doi: 10.1016/j.cell.2021.10.011 - DOI - PMC - PubMed
    1. Minassian AM, Silk SE, Barrett JR, Nielsen CM, Miura K, Diouf A, et al. . Reduced blood-stage malaria growth and immune correlates in humans following RH5 vaccination. Med (N Y) (2021) 2:701–719 e19. doi: 10.1016/j.medj.2021.03.014 - DOI - PMC - PubMed
    1. Nielsen CM, Barrett JR, Davis C, Fallon JK, Goh C, Michell AR, et al. . Delayed boosting improves human antigen-specific Ig and B cell responses to the RH5.1/AS01B Malaria Vaccine. JCI Insight (2023) 8(2):e163859. doi: 10.1172/jci.insight.163859 - DOI - PMC - PubMed

Publication types