. 2024 Mar;44(3):635-652.
doi: 10.1161/ATVBAHA.123.320224. Epub 2024 Feb 1.

Neutrophils and Neutrophil Extracellular Traps Cause Vascular Occlusion and Delayed Cerebral Ischemia After Subarachnoid Hemorrhage in Mice

Affiliations

Neutrophils and Neutrophil Extracellular Traps Cause Vascular Occlusion and Delayed Cerebral Ischemia After Subarachnoid Hemorrhage in Mice

Hussein A Zeineddine et al. Arterioscler Thromb Vasc Biol. 2024 Mar.

Abstract

Background: After subarachnoid hemorrhage (SAH), neutrophils are deleterious and contribute to poor outcomes. Neutrophils can produce neutrophil extracellular traps (NETs) after ischemic stroke. Our hypothesis was that, after SAH, neutrophils contribute to delayed cerebral ischemia (DCI) and worse outcomes via cerebrovascular occlusion by NETs.

Methods: SAH was induced via endovascular perforation, and SAH mice were given either a neutrophil-depleting antibody, a PAD4 (peptidylarginine deiminase 4) inhibitor (to prevent NETosis), DNAse-I (to degrade NETs), or a vehicle control. Mice underwent daily neurological assessment until day 7 and then euthanized for quantification of intravascular brain NETs (iNETs). Subsets of mice were used to quantify neutrophil infiltration, NETosis potential, iNETs, cerebral perfusion, and infarction. In addition, NET markers were assessed in the blood of aneurysmal SAH patients.

Results: In mice, SAH led to brain neutrophil infiltration within 24 hours, induced a pro-NETosis phenotype selectively in skull neutrophils, and caused a significant increase in iNETs by day 1, which persisted until at least day 7. Neutrophil depletion significantly reduced iNETs, improving cerebral perfusion, leading to less neurological deficits and less incidence of DCI (16% versus 51.9%). Similarly, PAD4 inhibition reduced iNETs, improved neurological outcome, and reduced incidence of DCI (5% versus 30%), whereas degrading NETs marginally improved outcomes. Patients with aneurysmal SAH who developed DCI had elevated markers of NETs compared with non-DCI patients.

Conclusions: After SAH, skull-derived neutrophils are primed for NETosis, and there are persistent brain iNETs, which correlated with delayed deficits. The findings from this study suggest that, after SAH, neutrophils and NETosis are therapeutic targets, which can prevent vascular occlusion by NETs in the brain, thereby lessening the risk of DCI. Finally, NET markers may be biomarkers, which can predict which patients with aneurysmal SAH are at risk for developing DCI.

Keywords: biomarkers; brain; delayed cerebral ischemia; neutrophil extracellular traps; subarachnoid hemorrhage.


Conflict of interest statement

Disclosures None.

Figures

Figure 1.
Figure 1.. Flow Cytometry Analysis of Neutrophil Counts after SAH in Mice.
A. Gating strategy to define neutrophil population (following identification of singlets and live cells by FSC vs SSC and LIVE/DEAD aqua, respectively). Percentages of neutrophils was defined as the number of neutrophils (CD45highCD11b+Ly6G+ cells) divided by the total number of live CD45highCD11b+ cells. Actual cell counts are reported in Table S2. B. SAH induces neutrophil infiltration into the brain by day 1. This response normalizes by day 5. n=5/group/time-point. One-way ANOVA with Tukey post hoc. C. Longitudinal neutrophil counts (CD45highCD11b+Ly6G+) in the blood, spleen, peripheral bone marrow, and skull. n=5/group/time-point. One-way ANOVA with Tukey post hoc: blood, peripheral bone marrow, and skull. Kruskal-Wallis with Dunn’s post hoc: spleen. D. tSNE plots for visual representation of live CD45+ cell counts over time.
Figure 2.
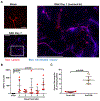
Figure 2.. SAH Increases Brain Intravascular NETs and Skull Neutrophil NETosis in Mice.
A. Representative images from mice brains on day 7 post-SAH stained for citrullinated histone (NET marker, blue) and blood vessels (laminin, red). The right image is a zoomed portion of the SAH Day 7 image (white box) showing that vessels less than 20 μm are occluded by NETs. Scale bar = 50 μm. Images are taken from the thalamus region. B. Quantification of intravascular brain immunostaining for NETs (co-localization of blue in red). n=5/group. Kruskal-Wallis with Dunn’s post hoc. C. Following SAH, skull neutrophils have higher NETosis than femur neutrophils. NETosis was assessed using flow cytometry analysis of sorted neutrophils from either skull bone marrow or femur bone marrow. Sorted neutrophils were subjected to 2 hours of culturing before assessing for NETosis. n=8-9/group. Unpaired two-tailed t-test. BM: bone marrow.
Figure 3.
Figure 3.. Neutrophil Depletion Prevents iNETs and Improves Neurological Behavior after SAH in Mice.
A. Representative images from mice brains on day 7 post-SAH stained for citrullinated histone (NET marker, blue) and blood vessels (laminin, red). Scale bar = 50 μm. Quantification of immunostaining for iNETs (co-localized blue and red staining) 1 and 7 days post-SAH. Day 1: n=6/group. Day 7: n=6 sham, n=12 for each SAH group. One-way ANOVA with Tukey post hoc. Images are taken from the cerebral cortex region. B. Neutrophil depletion improves behavioral performance after SAH assessed using a composite neuroscore, Y-maze, and open field. D1 neuroscore: Kruskal-Wallis with Bonferroni post hoc. D1-7 neuroscore: Friedman test followed by Kruskal-Wallis with Dunn’s post hoc for each time-point. Y-maze: One-way ANOVA with LSD post hoc. Open field Day 1: One-way ANOVA with Tukey post hoc; open field Day 7: Kruskal-Wallis with Dunn’s post hoc. * Sham vs SAH+IgG Antibody Day 1 p<0.001, Day 2 p<0.001, Day 3 p<0.001, Day 4 p=0.007, Day 5 p=0.018, Day 6 p=0.017, Day 7 p=0.008. † Sham vs SAH+Ly6G Antibody Day 3 p=0.020. # SAH+IgG Antibody vs SAH+Ly6G Antibody Day 1 p<0.001, Day 2 p=0.045, Day 7 p=0.005. Individual mice performance on the 7-day neuroscore are plotted in Figure S13A.
Figure 4.
Figure 4.. Neutrophil Depletion Leads to Improved CBF and Prevents Delayed Cerebral Infarction.
A. Representative images of CBF before SAH (Baseline), 1 day, and 5 days post-SAH. B. Quantification of CBF of the striatum from FAIR MRI. Mean and SEM are plotted. n=6 sham, n=12-13 SAH+IgG Antibody, n=11-12 SAH+Ly6G Antibody. Repeated measures two-way ANOVA analysis with LSD post hoc. At indicated time-point: * Sham vs SAH+IgG Antibody p=0.0, # Sham vs SAH+Ly6G Antibody p=0.0, † SAH+IgG Antibody vs SAH+Ly6G Antibody p=0.0. Plots of the changes for individual mice are plotted in Figure S17. C. Quantification of infarction 1 and 5 days post-SAH from DWI MRI. Mean and SEM are plotted. n=6 sham, n=13-14 SAH+IgG Antibody, n=11-12 SAH+Ly6G Antibody. Kruskal-Wallis with Dunn’s post hoc for each time-point. At indicated time-point: * p=0.012 Sham vs SAH+IgG Antibody and p=0.045 Sham vs SAH+Ly6G Antibody, # p=0.019 Sham vs SAH+IgG Antibody, † p=0.048 SAH+IgG Antibody vs SAH+Ly6G Antibody. Data for individual mice are plotted in Figure S16. D. Representative images of Nissl-stained brains 7 days post-SAH. E. Neutrophil depletion reduces infarction on day 7 (assessed in Nissl-stained slices). n=6 sham, n=11 for SAH groups. One-way ANOVA with Tukey post hoc. Mean and SD are plotted. All sham mice received IgG antibody injections.
Figure 5.
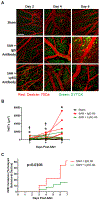
Figure 5.. Neutrophil Depletion Reduces in-vivo iNETs Formation and Incidence of Delayed Neurological Decline (DND).
A. Representative images of iNETs taken during in-vivo intravital microscopy of the cortical MCA territory (center of the window 1.7 mm right lateral from midline and 2.2 mm posterior from Bregma). NETs (green/yellow from SYTOX staining) are visible in the vessels (red from intravascular red dextran) of SAH mice but not sham mice. SYTOX green was used to label DNA as a marker of NETs. Scale bar = 100 μm. Images shown EDF focused from the entire denoised z-stack for a representative area within the cranial window. B. Quantification of iNETs area from intravital imaging. Individual values are plotted. n=8 sham, n=11-15 SAH+IgG Antibody, n=12-14 SAH+Ly6G Antibody. Repeated measures two-way ANOVA on ranks (Friedman test) following by Kruskal-Wallis with Dunn’s post hoc for each time-point. At indicated time-point: * Sham vs SAH+IgG Antibody Day 2 p=0.022, Day 4 p=0.048, Day 6 p=0.005. † Sham vs SAH+Ly6G Antibody Day 2 p=0.038 and Day 4 p=0.037. C. Kaplan-Meier plot for development of DND (% of animals that experienced delayed behavioral decline in the neuroscore test). n=25-27/group. Mantel-Cox test. p=0.0103. All sham mice received IgG antibody injections.
Figure 6.
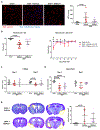
Figure 6.. PAD4 Inhibition Prevents iNETs and Improves Outcome after SAH in Mice.
A. Representative images from mice brains 7 days post-SAH stained for citrullinated histone (NET marker, blue) and blood vessels (laminin, red). Scale bar = 50 μm. Quantification of immunostaining for iNETs (co-localized blue and red staining) 7 days post-SAH. n=6-8/group. Kruskal-Wallis with Dunn’s post hoc. Images are taken from the cortex region. B-D. Both pre-treatment and post-treatment with a PAD4 inhibitor significantly improves behavioral performance after SAH assessed using a composite neuroscore (B), Y-maze (C), and open field (D). The PAD4 inhibitor post-treatment group was not assessed using the Y-maze or open field tasks. n=8-10/group. D1 Neuroscore: Kruskal-Wallis with Bonferroni post hoc. D1-7 Neuroscore: Friedman test followed by Kruskal-Wallis with Dunn’s post hoc for each time-point. Y-maze: One-way ANOVA with LSD post hoc. Open field Day 1: One-way ANOVA with LSD post hoc. Open field Day 7: Kruskal-Wallis with Dunn’s post hoc. * Sham vs SAH+Vehicle Day 1 p<0.001, Day 2 p<0.001, Day 3 p=0.043, Day 5 p=0.002, Day 6 p<0.001. † Sham vs SAH+PAD4 Inhibitor (Pre-Treat) p=0.043, # SAH+Vehicle vs SAH+PAD4 Inhibitor (Pre-Treat) Day 1 p<0.001, Day 2 p<0.001, Day 6 p=0.045. ‡ SAH+Vehicle vs SAH+PAD4 Inhibitor (Post-Treat) Day 1 p=0.014, Day 2 p=0.007, Day 5 p=0.008, Day 6 p<0.001. E. Representative images of Nissl-stained brains 7 days post-SAH to assess for infarcts (outlined in yellow). F. PAD4 inhibition prevents the development of infarcts 7 days after SAH (assessed in the Nissl-stained brain slices). n=6-8/group. One-way ANOVA with Tukey post hoc Individual mice performance on the 7-day neuroscore are plotted in Figure S13B. G. Kaplan-Meier plot of DND incidence (% of animals that experienced delayed behavioral decline in the neuroscore test). The SAH+Vehicle group (n=20/group) combines data from the SAH+Vehicle (saline, 15 minutes before SAH) (n=10) and SAH+Vehicle (saline, 1 and 8 hours post-SAH) (n=10) groups. The PAD4 Inhibitor group (n=20/group) combines data from the SAH+PAD4 Inhibitor (Pre-Treat, 15 minutes before SAH) (n=10) and SAH+PAD4 Inhibitor (Post-Treat, 3 hours post-SAH) (n=10) groups. n=10 for SAH+DNAse-I. Mantel-Cox test. SAH+Vehicle vs SAH+PAD4 Inhibitor: p=0.0389. SAH+Vehicle vs DNAse-I: p=0.9009. All plots are SD and mean except Kaplan-Meier curve.
Figure 7.
Figure 7.. DNAse-I Treatment Reduces iNETs and Marginally Improves Neurological Outcome after SAH in Mice.
A. Representative images from mice brains 7 days post-SAH stained for citrullinated histone (NET marker, blue) and blood vessels (laminin, red). Scale bar = 50 μm. DNAse-I partially prevents iNETs (quantified as co-localization of blue and red staining) 7 days post-SAH. n=6-8/group. Kruskal-Wallis with Dunn’s post hoc. Images are from the thalamus region. B-D. DNAse-I treatment marginally improves neurological performance after SAH assessed using a composite neuroscore (B), Y-maze (C), and open field (D). n=8 sham, n=7-10 SAH+Vehicle, n=5-10 SAH+DNAse-I. D1 neuroscore: Kruskal-Wallis with Bonferroni post hoc. D1-7 neuroscore: Friedman test followed by Kruskal-Wallis with Dunn’s post hoc for each time-point. Y-maze: One-way ANOVA with LSD post hoc. Open field Day 1: Kruskal-Wallis with Dunn’s post hoc. * Sham vs SAH+Vehicle Day 1 p<0.001, Day 2 p=0.033, Day 3 p=0.019, Day 4 p=0.015. † Sham vs SAH+DNAse-I p=0.044. Individual mice performance on the 7-day neuroscore are plotted in Figure S13C. E. Representative Nissl-stained brains and quantified infarct volume on day 7 post-SAH. n=6-8/group. Kruskal-Wallis with Dunn’s post hoc.
Figure 8.
Figure 8.. Markers of NETs are Elevated in the Plasma of Aneurysmal SAH Patients Developing DCI.
A. Patients with DCI (n=40) had higher plasma levels of neutrophil elastase on days 2, 7, and 10 compared to patients not developing DCI (n=87). At indicated time, * p=0.033, # p=0.003, † p<0.01. B. Patients with DCI had higher plasma levels of citrullinated histone H3 on day 10 compared to patients not developing DCI. Univariate analysis with repeated measures for neutrophil elastase and citrullinated histone H3 longitudinal data. C. Neutrophil elastase plasma concentration at the time-point preceding DCI onset (normalized to the day 1 value) indicates that DCI patients (n=21) have a significantly higher ratio than non-DCI patients (n=42). Unpaired two-tailed t-test. Individual data points are plotted for all three figures in Figure S24.
Figure 9.
Figure 9.. Aneurysmal SAH Causes Brain Intravascular NETs in a Patient Developing DCI.
Representative images from the brains of a DCI patient (A, post-rupture day 12) and non-DCI patient (B, post-rupture day 1). Tissue displays NETs (white arrowheads) (blue, citrullinated histone) inside blood vessels (red, laminin) for the patient with DCI. However, no iNETs were observed in the patient who did not develop DCI. Vessels not containing NETs are indicated by a yellow arrowhead. Scale bar = 100 μm.

References

    1. Connolly ES, Rabinstein AA, Carhuapoma JR, et al. Guidelines for the management of aneurysmal subarachnoid hemorrhage: a guideline for healthcare professionals from the American Heart Association/american Stroke Association. Stroke. 2012;43:1711–37. - PubMed
    1. Rowland MJ, Hadjipavlou G, Kelly M, Westbrook J and Pattinson KT. Delayed cerebral ischaemia after subarachnoid haemorrhage: looking beyond vasospasm. Br J Anaesth. 2012;109:315–29. - PubMed
    1. Macdonald RL. Delayed neurological deterioration after subarachnoid haemorrhage. Nat Rev Neurol. 2014;10:44–58. - PubMed
    1. Zeineddine HA, Honarpisheh P, McBride D, Pandit PKT, Dienel A, Hong SH, Grotta J and Blackburn S. Targeting Hemoglobin to Reduce Delayed Cerebral Ischemia After Subarachnoid Hemorrhage. Transl Stroke Res. 2022;13:725–735. - PMC - PubMed
    1. Cai L, Zeng H, Tan X, Wu X, Qian C and Chen G. The Role of the Blood Neutrophil-to-Lymphocyte Ratio in Aneurysmal Subarachnoid Hemorrhage. Front Neurol. 2021;12:671098. - PMC - PubMed

Publication types