. 2024 Mar 5;12(3):e0347823.
doi: 10.1128/spectrum.03478-23. Epub 2024 Feb 1.

Single-cell ATAC sequencing identifies sleepy macrophages during reciprocity of cytokines in L. major infection

Affiliations

Single-cell ATAC sequencing identifies sleepy macrophages during reciprocity of cytokines in L. major infection

Shweta Khandibharad et al. Microbiol Spectr. .

Abstract

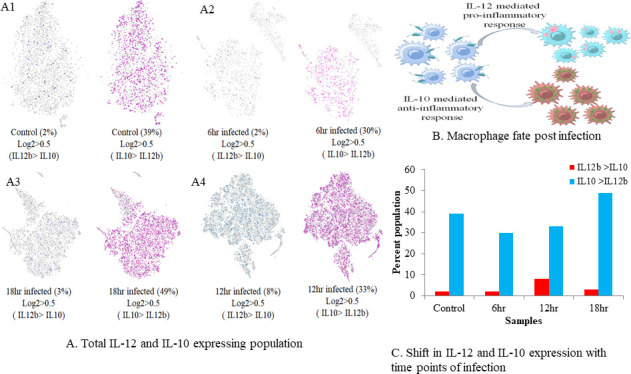
The hallmark characteristic of macrophages lies in their inherent plasticity, allowing them to adapt to dynamic microenvironments. Leishmania strategically modulates the phenotypic plasticity of macrophages, creating a favorable environment for intracellular survival and persistent infection through regulatory cytokine such as interleukin (IL)-10. Nevertheless, these effector cells can counteract infection by modulating crucial cytokines like IL-12 and key components involved in its production. Using sophisticated tool of single-cell assay for transposase accessible chromatin (ATAC) sequencing, we systematically examined the regulatory axis of IL-10 and IL-12 in a time-dependent manner during Leishmania major infection in macrophages Our analysis revealed the cellular heterogeneity post-infection with the regulators of IL-10 and IL-12, unveiling a reciprocal relationship between these cytokines. Notably, our significant findings highlighted the presence of sleepy macrophages and their pivotal role in mediating reciprocity between IL-10 and IL-12. To summarize, the roles of cytokine expression, transcription factors, cell cycle, and epigenetics of host cell machinery were vital in identification of sleepy macrophages, which is a transient state where transcription factors controlled the epigenetic remodeling and expression of genes involved in pro-inflammatory cytokine expression and recruitment of immune cells.IMPORTANCELeishmaniasis is an endemic affecting 99 countries and territories globally, as outlined in the 2022 World Health Organization report. The disease's severity is compounded by compromised host immune systems, emphasizing the pivotal role of the interplay between parasite and host immune factors in disease regulation. In instances of cutaneous leishmaniasis induced by L. major, macrophages function as sentinel cells. Our findings indicate that the plasticity and phenotype of macrophages can be modulated to express a cytokine profile involving IL-10 and IL-12, mediated by the regulation of transcription factors and their target genes post-L. major infection in macrophages. Employing sophisticated methodologies such as single-cell ATAC sequencing and computational genomics, we have identified a distinctive subset of macrophages termed "sleepy macrophages." These macrophages exhibit downregulated housekeeping genes while expressing a unique set of variable features. This data set constitutes a valuable resource for comprehending the intricate host-parasite interplay during L. major infection.

Keywords: parasite; single-cell ATAC sequencing; sleepy macrophages; systems biology; transcription factor.


Conflict of interest statement

The authors declare no conflict of interest.

Figures

Fig 1
Fig 1
(A) Expression of parasite eliminating phenotype and parasite survival promoting phenotype markers IFN-γ, CD80, and IL-10 in samples (CD80 IFN-γ -expressing cells are represented in green color and IL-10 -expressing cells in red). (A1) Control, (A2) 6 hr, (A3) 12 hr, and (A4) 18 h. (B) Graphical representation of macrophage types at different time points of infection.
Fig 2
Fig 2
Identification of the reciprocal relationship between IL-10 and IL-12. (A) Macrophage-expressing IL-12 more than IL-10 and vice versa in all the samples. (A1) Control, (A2) 6 h, (A3) 12 h, and (A4) 18 h. (B) Abstract highlighting the fate of macrophages post-infection with L. major if IL-12 and IL-10 are secreted. (C) Change in expression patterns of IL-10 and IL-12 with time.
Fig 3
Fig 3
Identification of reciprocity in IL-10 and IL-12 expression patterns through NFAT5 and SHP-1. (A) Populations expressing IL-12, NFAT5, and iNOS versus populations expressing IL-10, SHP-1, and arginase1. (A1) Control, (A2) 6 h, (A3) 12 h, and (A4) 18 h. (B) Graphical representation highlighting the reciprocal relationship between IL-10 and IL-12 mediated by NFAT5 and SHP-1. (C) Graphical abstract of the aim behind the analysis.
Fig 4
Fig 4
Differential expression of genes in 6-h sample in all clusters. (A) Violin plot of feature expression and peaks of ActB. (B) Violin plot of feature expression and peaks of GAPDH. (C) Violin plot of feature expression and peaks of IL-10 (D) Violin plot of feature expression and peaks of IL-12b. (E) Violin plot of feature expression and peaks of SHP-1. (F) Violin plot of NFAT5 motif accessibility and peak of NFAT5.
Fig 5
Fig 5
Principal component analysis of 6-h sample by differential expression of all the clusters. (A) Scree plot, (B) variables in clusters, (C) PCA of clusters, and (D) PCA based on P value.
Fig 6
Fig 6
Gene enrichment analysis from Clusters 3 and 6 of 6-h sample. (A) Heat map of genes enriched from Clusters 3 and 6. The heat map visually displays the genes within the leading edge subsets after clustering. In this representation, gene expression values are depicted using a color spectrum where the variation in colors (ranging from red to pink, light blue to dark blue) corresponds to the diversity in expression levels (high, moderate, low, and lowest). (B) Enrichment plot of Cluster 3. (C) Butterfly plot of Cluster 3. (D) Differential correlation of Clusters 3 and 6 with Clusters 1, 2, 4, and 5.
Fig 7
Fig 7
Top-ranking genes based on 12 scoring techniques were identified from the leading inter-regulatory TFTG network. Red signifies the highest score; orange signifies moderate score; and yellow signifies lower score.
Fig 8
Fig 8
Transcription factor-target gene (TFTG) network analysis. (A) Pathway enrichment of sleepy macrophage genes and transcription factors (P value < 0.01). (B) The simulated network’s circular layout demonstrating the strength of chosen transcription factors over the whole network. (C) The inter-regulatory TFTG network after running the simulated annealing algorithm, showing placement of heavily weighted nodes (TFs) positioned at the bottom of the network. (D) The top five ranked transcription factors are represented graphically, based on their frequency of occurrence according to the 12 scoring techniques of CytoHubba plugin.
Fig 9
Fig 9
(A) Cell cycle analysis of RAW264.7 cells infected with L. major for 6 h and identification of percentage of population (results obtained are from three individual experiments). (B) t-distributed stochastic neighbor embedding (t-SNE) map of H2-D1 expression. (C) Promoter accessibility and motif z-score of H2-D1 population. (D) Gene ontology associated with HOXA9 (P value < 0.001). (E) Cell cycle analysis of sleepy macrophages shows reactions favoring G0/G1 phase. (F) TP53 motif accessibility and expression at 6 h post-infection with L. major (P value < 0.01).
Fig 10
Fig 10
(A) Expression analysis of IL-10 and IL-12p40 on peritoneal macrophages infected with L. major at different time points. (B) Densitometry analysis of blots. (C) Localized expression of SHP-1 and NFAT5 in RAW264.7 cells. (D) Intensity measure of expression of SHP-1 and NFAT5 (P value < 0.01).

References

    1. Andersen L, Corazon SSS, Stigsdotter UKK. 2021. Nature exposure and its effects on immune system functioning: a systematic review. Int J Environ Res Public Health 18:1416. doi:10.3390/ijerph18041416 - DOI - PMC - PubMed
    1. Baker RE, Mahmud AS, Miller IF, Rajeev M, Rasambainarivo F, Rice BL, Takahashi S, Tatem AJ, Wagner CE, Wang L-F, Wesolowski A, Metcalf CJE. 2022. Infectious disease in an era of global change. Nat Rev Microbiol 20:193–205. doi:10.1038/s41579-021-00639-z - DOI - PMC - PubMed
    1. J B, M BM, Chanda K. 2021. An overview on the therapeutics of neglected infectious diseases-leishmaniasis and chagas diseases. Front Chem 9:622286. doi:10.3389/fchem.2021.622286 - DOI - PMC - PubMed
    1. Curtin JM, Aronson NE. 2021. Leishmaniasis in the United States: emerging issues in a region of low endemicity. Microorganisms 9:578. doi:10.3390/microorganisms9030578 - DOI - PMC - PubMed
    1. Sundar S, Singh B. 2018. Emerging therapeutic targets for treatment of leishmaniasis. Expert Opin Ther Targets 22:467–486. doi:10.1080/14728222.2018.1472241 - DOI - PMC - PubMed

LinkOut - more resources