. 2024 Mar 5;12(3):e0338623.
doi: 10.1128/spectrum.03386-23. Epub 2024 Feb 1.

Swine influenza A virus isolates containing the pandemic H1N1 origin matrix gene elicit greater disease in the murine model

Affiliations

Swine influenza A virus isolates containing the pandemic H1N1 origin matrix gene elicit greater disease in the murine model

Shelly J Curran et al. Microbiol Spectr. .

Abstract

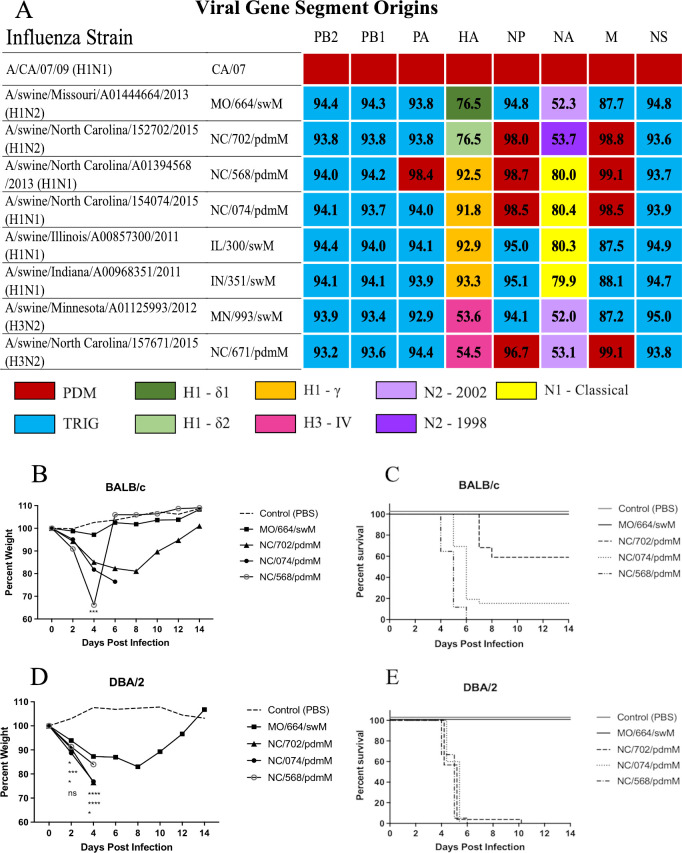
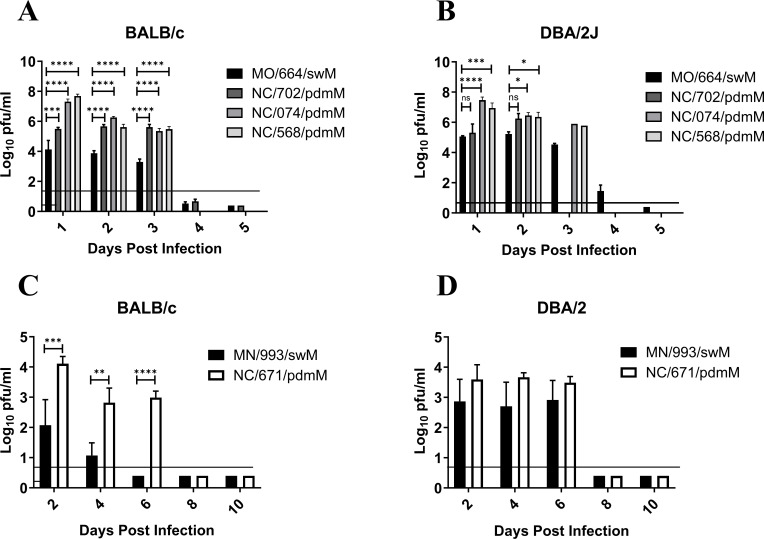
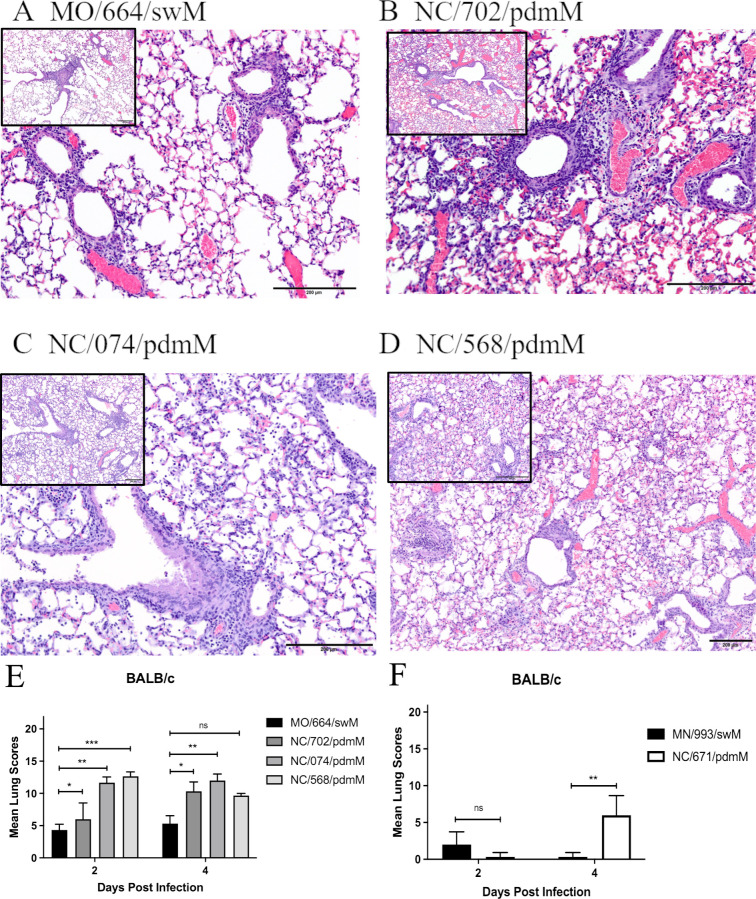
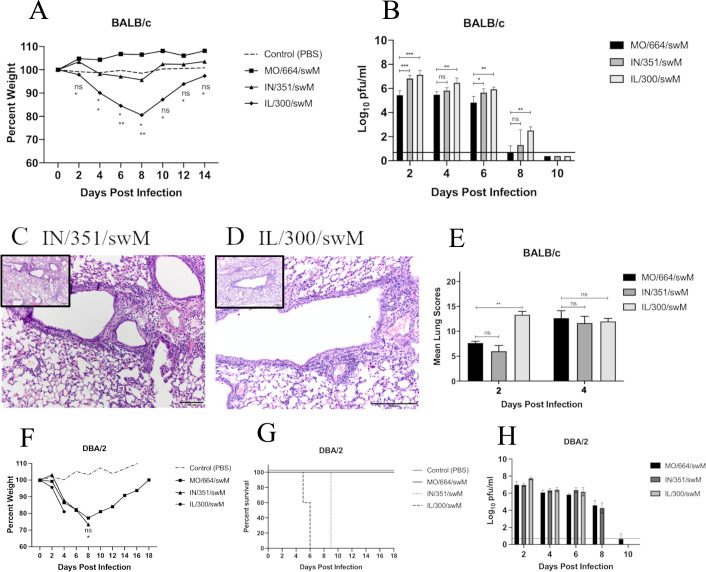
Since the 1990s, endemic North American swine influenza A viruses (swFLUAVs) contained an internal gene segment constellation, the triple reassortment internal gene (TRIG) cassette. In 2009, the H1N1 pandemic (pdmH1N1) virus spilled back into swine but did not become endemic. However, the pdmH1N1 contributed the matrix gene (pdmM) to the swFLUAVs circulating in the pig population, which replaced the classical swine matrix gene (swM) found in the TRIG cassette, suggesting the pdmM has a fitness benefit. Others have shown that swFLUAVs containing the pdmM have greater transmission efficiency compared to viruses containing the swM gene segment. We hypothesized that the matrix (M) gene could also affect disease and utilized two infection models, resistant BALB/c and susceptible DBA/2 mice, to assess pathogenicity. We infected BALB/c and DBA/2 mice with H1 and H3 swFLUAVs containing the swM or pdmM and measured lung virus titers, morbidity, mortality, and lung histopathology. H1 influenza strains containing the pdmM gene caused greater morbidity and mortality in resistant and susceptible murine strains, while H3 swFLUAVs caused no clinical disease. However, both H1 and H3 swFLUAVs containing the pdmM replicated to higher viral titers in the lungs and pdmM containing H1 viruses induced greater histological changes compared to swM H1 viruses. While the surface glycoproteins and other gene segments may contribute to swFLUAV pathogenicity in mice, these data suggest that the origin of the matrix gene also contributes to pathogenicity of swFLUAV in mice, although we must be cautious in translating these conclusions to their natural host, swine.

Importance: The 2009 pandemic H1N1 virus rapidly spilled back into North American swine, reassorting with the already genetically diverse swFLUAVs. Notably, the M gene segment quickly replaced the classical M gene segment, suggesting a fitness benefit. Here, using two murine models of infection, we demonstrate that swFLUAV isolates containing the pandemic H1N1 origin M gene caused increased disease compared to isolates containing the classical swine M gene. These results suggest that, in addition to other influenza virus gene segments, the swFLUAV M gene segment contributes to pathogenesis in mammals.

Keywords: influenza virus; matrix gene; mouse model; pandemic influenza; pathogenesis; swine influenza.


Conflict of interest statement

The authors declare no conflict of interest.

Figures

Fig 1
Fig 1
Influenza viruses used for mouse infections and morbidity and mortality in mice. (A) The origin of each gene segment is color coded according to the key. Numbers indicate percent nucleotide sequence homology compared to A/CA/04/2009 (pdmH1N1). (B and D) Percent weight loss and (C and E) mortality of (B and C) BALB/c or (D and E) DBA/2 mice following infection with indicated swine H1 influenza viruses. Mice were inoculated with 1e5 PFU of virus (n = 5 per group) and weights were recorded every other day. This study was repeated to confirm results. Statistical comparison between MO/664/swM and the other viruses by two-way analysis of variance with Dunnett post hoc test (B and D). *<0.05, ***<0.001, ****<0.0001. Kaplan-Meier survival curves (C and E). Abbreviations: HA, hemagglutinin; M, matrix; NA, neuraminidase; NP, nuclear protein; ns, not signficant; NS, non-structural; PA, polymerase acidic; PB1, polymerase basic 1; PB2, polymerase basic 2; PDM, pandemic 2009 lineage; pdmH1N1, H1N1 pandemic; TRIG, triple reassortment internal gene constellation.
Fig 2
Fig 2
Morbidity of mice infected with swine H3 influenza viruses. (A) BALB/c or (B) DBA/2 mice were inoculated with 1e5 PFU of the indicated viruses (n = 5 mice/group, repeated), and weights were recorded every other day. Statistical comparison between MN/993/swM and NC/671/pdmM by two-way analysis of variance with Bonferroni post hoc test. **<0.005. PBS, phosphate-buffered saline.
Fig 3
Fig 3
Lung virus titers over time from mice infected with swine H1 and H3 influenza viruses. (A and C) BALB/c and (B and D) DBA/2 mice were inoculated with 1e5 PFU of the indicated viruses. Lungs collected at indicated time points, homogenized, and assayed for virus titer by plaque assay (n = 5 mice/group/collection time point, repeated). Statistical comparison between (A and B) MO/664/swM and the other viruses was completed using two-way analysis of variance (ANOVA) with Dunnett post hoc test or (C and D) MN/993/swM and NC/671/pdmM by two-way ANOVA with Bonferroni post hoc test. *<0.05, **<0.005, ***0.001, ****<0.0001.
Fig 4
Fig 4
Histological images and lesion scores from mice infected with swine influenza viruses. BALB/c mice were inoculated with 1e5 PFU of the indicated viruses and euthanized, and the lungs were fixed for histological analysis at 2 and 4 DPI (n = 2 mice/virus/collection, repeated). Lungs were assigned histological lesion scores out of 22. (A–D) Images of lung sections from 4 DPI at 20× and 10× (inset) for A/swine/Missouri/A01444664/2013 (H1N2) (A), A/swine/North Carolina/152702/2015 (H1N2) (B), A/swine/North Carolina/154074/2015 (H1N1) (C), and A/swine/North Carolina/A01394568/2013 (H1N1) (D). (A) MO/664/swM: mild perivascular and peribronchiolar infiltrations of mostly lymphocytes and mild segmental necrosis of the bronchiolar epithelium are present, but there are no significant interstitial changes. Lesion score: 6 out of 22. (B) NC/702/pdmM: bronchioles are dilated and there are moderate peribronchiolar and mild perivascular infiltrations of mostly lymphocytes and diffuse necrosis of the bronchiolar epithelium. Focally extending from the central bronchiole, alveolar septa are thickened and there are small numbers of inflammatory cells in the alveoli. Lesion score: 10 out of 22. (C) NC/074/pdmM: bronchioles are slightly dilated with mild epithelial necrosis and sloughed epithelial cells and a few inflammatory cells in the lumen. There are mild to moderate peribronchiolar and perivascular infiltrations of mostly lymphocytes. Diffusely, the alveolar septa are mildly thickened, and the alveoli contain small numbers of inflammatory cells. Lesion score: 13 out of 22. (D) NC/568/pdmM: bronchioles are slightly dilated and lined by the attenuated epithelium. There are mild peribronchiolar and perivascular infiltrations of mostly lymphocytes. Diffusely, the alveolar septa are mildly thickened, and alveoli contain small numbers of inflammatory cells admixed with erythrocytes. Lesion score: 10 out of 22. (E and F) Histological lesion scores out of 22 for BALB/c mice inoculated with either the H1 or H3 swine influenza isolates. Statistical differences were calculated using two-way ANOVA between (E) MO/664/swM and the other viruses with Dunnett post hoc test or (F) MN/993/swM and NC/671/pdmM with Bonferroni post hoc test. *<0.05, **<0.005, ***<0.001.
Fig 5
Fig 5
Morbidity, mortality, histology, and lung virus titers of mice infected with alternate swine H1 influenza viruses. (A–E) BALB/c mice were inoculated with 1e5 PFU of the indicated viruses and (A) weights were recorded every other day and lungs collected and (B) assayed for virus titer or (C–E) histopathology (n = 5 mice/virus/collection for titers, n = 2 mice/virus/collection for histopathology, repeated). Images of lung sections from (C) A/sw/Indiana/A00968351/2011 (H1N1, IN/351/swM) or (D) A/sw/Illinois/A00857300/2011 (H1N1, IL/300/swM) infected mice, 4 DPI at 20× and 10× (inset) and (E) histological lesion scores out of 22. DBA/2 mice were inoculated with 1e5 PFU of the indicated viruses and (F) weights and (G) survival were recorded, or (H) lungs were collected and assayed for virus titer. Statistical differences were calculated between MO/664/swM and the other viruses by two-way ANOVA with Dunnett post hoc test. *<0.05, **<0.005, ***<0.001, ****<0.0001.

Similar articles

Cited by

References

    1. Shaw ML, Palese P. 2013. Orthomyxoviridae, p 2 volumes. In Knipe DM, Howley PM (ed), Fields virology, 6th ed. Wolters Kluwer/Lippincott Williams & Wilkins Health, Philadelphia, PA.
    1. Fiore AE, Bridges CB, Cox NJ. 2009. Seasonal influenza vaccines. Curr Top Microbiol Immunol 333:43–82. doi:10.1007/978-3-540-92165-3_3 - DOI - PubMed
    1. Organization WH. 2014. Influenza (seasonal) fact sheet N211
    1. Nicholson KG, Wood JM, Zambon M. 2003. Influenza. Lancet 362:1733–1745. doi:10.1016/S0140-6736(03)14854-4 - DOI - PMC - PubMed
    1. Pinto LH, Holsinger LJ, Lamb RA. 1992. Influenza virus M2 protein has ion channel activity. Cell 69:517–528. doi:10.1016/0092-8674(92)90452-i - DOI - PubMed