. 2024 Feb 1;95(1):110-117.
doi: 10.1227/neu.0000000000002848. Online ahead of print.

Algorithm Versus Expert: Machine Learning Versus Surgeon-Predicted Symptom Improvement After Carpal Tunnel Release

Affiliations

Algorithm Versus Expert: Machine Learning Versus Surgeon-Predicted Symptom Improvement After Carpal Tunnel Release

Nina Louisa Loos et al. Neurosurgery. .

Abstract

Background and objectives: Surgeons rely on clinical experience when making predictions about treatment effects. Incorporating algorithm-based predictions of symptom improvement after carpal tunnel release (CTR) could support medical decision-making. However, these algorithm-based predictions need to outperform predictions made by surgeons to add value. We compared predictions of a validated prediction model for symptom improvement after CTR with predictions made by surgeons.

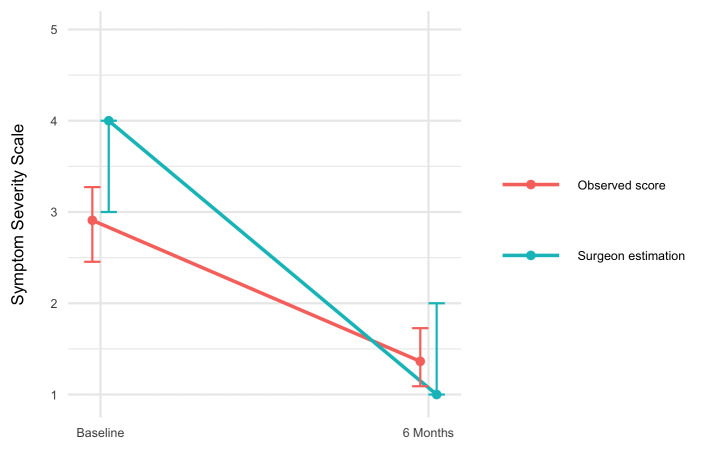
Methods: This cohort study included 97 patients scheduled for CTR. Preoperatively, surgeons estimated each patient's probability of improvement 6 months after surgery, defined as reaching the minimally clinically important difference on the Boston Carpal Tunnel Syndrome Symptom Severity Score. We assessed model and surgeon performance using calibration (calibration belts), discrimination (area under the curve [AUC]), sensitivity, and specificity. In addition, we assessed the net benefit of decision-making based on the prediction model's estimates vs the surgeon's judgement.

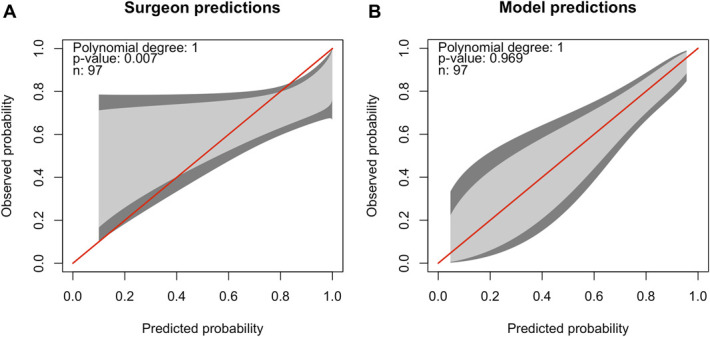
Results: The surgeon predictions had poor calibration and suboptimal discrimination (AUC 0.62, 95%-CI 0.49-0.74), while the prediction model showed good calibration and appropriate discrimination (AUC 0.77, 95%-CI 0.66-0.89, P = .05). The accuracy of surgeon predictions was 0.65 (95%-CI 0.37-0.78) vs 0.78 (95%-CI 0.67-0.89) for the prediction model ( P = .03). The sensitivity of surgeon predictions and the prediction model was 0.72 (95%-CI 0.15-0.96) and 0.85 (95%-CI 0.62-0.97), respectively ( P = .04). The specificity of the surgeon predictions was similar to the model's specificity ( P = .25). The net benefit analysis showed better decision-making based on the prediction model compared with the surgeons' decision-making (ie, more correctly predicted improvements and/or fewer incorrectly predicted improvements).

Conclusion: The prediction model outperformed surgeon predictions of improvement after CTR in terms of calibration, accuracy, and sensitivity. Furthermore, the net benefit analysis indicated that using the prediction model instead of relying solely on surgeon decision-making increases the number of patients who will improve after CTR, without increasing the number of unnecessary surgeries.


Figures

FIGURE 1.
FIGURE 1.
Calibration belts of A, the surgeon predictions and B, the prediction model. The predicted probability of symptom improvement compared with the observed probability of symptom improvement is shown. The red line indicates perfect calibration, and the 80% CI (light gray) and 95% CI (dark gray) of the calibration is shown in gray. The model or surgeons perform well on calibration if the belt is close to the bisector. If the belt falls above the bisector, the model or surgeons underestimate the probability of improvement. If the belt falls under the bisector, the model or surgeons overestimate the probability. A, Surgeon predictions: the red line does not fall within the 80% CI (light gray) and 95% CI (dark gray) over the whole range of predicted probability, indicating significant deviation in calibration between the predicted probability and observed probability of improvement. This is also confirmed by the P-value <.05. Patients for whom surgeons predict the probability of symptom improvement to be higher than 80%, the observed probability of symptom improvement is lower, indicating an overly optimistic surgeon prediction. B, Prediction model: the red line falls within the 80% CI (light gray) and 95% CI (dark gray), indicating no significant deviation in calibration between the predicted probability and observed probability of improvement. This is also confirmed by the P-value >.05.
FIGURE 2.
FIGURE 2.
Comparison of performance measures (AUC, accuracy, sensitivity, and specificity) of surgeon predictions and model predictions. Higher scores indicate better performance. For all measures, estimates are displayed with 95% CI. In addition, the P-value for the comparisons between surgeon and model predictions is shown. A significantly higher sensitivity for the prediction model compared with surgeon predictions is seen. AUC, area under the curve.
FIGURE 3.
FIGURE 3.
Net benefit curve for 3 decision-making strategies: “Treat all,” “Treat none,” and “Deciding based on the CTR prediction model.” “Treat all” is, in our sample equal, to the current decision-making of surgeons. The net benefit weighs the benefits (ie, true positives) and harms (ie, false positives) of a decision strategy over a range of threshold probabilities. The threshold probability (on the x-axis) reflects the point at which the benefits of a particular decision or strategy outweigh the potential harm. We observe a benefit of “Deciding based on the CTR prediction model” compared with “Treat all” from a threshold probability of 10% onward. A threshold of 10% would indicate that the surgeon feels the benefits of the CTR outweigh the risks if the patient has more than 10% chance of improvement after CTR. Given the elective nature of CTR, it is likely that surgeons would only schedule their patients for this procedure when the patient has a high probability of improving. Therefore, it is likely that the threshold probability for choosing CTR lies above 10%. The higher net benefit of “Deciding based on the CTR prediction model” indicates that this strategy results in more true positives and/or less false positives compared with current decision-making (“Treat all”). CTR, carpal tunnel release.
None

References

    1. Jarvik JG, Comstock BA, Kliot M, et al. Surgery versus non-surgical therapy for carpal tunnel syndrome: a randomised parallel-group trial. Lancet. 2009;374(9695):1074-1081. - PubMed
    1. Katz JN, Keller RB, Simmons BP, et al. Maine Carpal Tunnel Study: outcomes of operative and nonoperative therapy for carpal tunnel syndrome in a community-based cohort. J Hand Surg Am. 1998;23(4):697-710. - PubMed
    1. Louie DL, Earp BE, Collins JE, et al. Outcomes of open carpal tunnel release at a minimum of ten years. J Bone Joint Surg Am. 2013;95(12):1067-1073. - PMC - PubMed
    1. Newington L, Stevens M, Warwick D, Adams J, Walker-Bone K. Sickness absence after carpal tunnel release: a systematic review of the literature. Scand J Work Environ Health. 2018;44(6):557-567. - PMC - PubMed
    1. Marks M, Audigé L, Reissner L, Herren DB, Schindele S, Vliet Vlieland TP. Determinants of patient satisfaction after surgery or corticosteroid injection for trapeziometacarpal osteoarthritis: results of a prospective cohort study. Arch Orthop Trauma Surg. 2015;135(1):141-147. - PubMed