. 2024 Feb 6;121(6):e2305153121.
doi: 10.1073/pnas.2305153121. Epub 2024 Feb 1.

Self-organization as a mechanism of resilience in dryland ecosystems

Affiliations

Self-organization as a mechanism of resilience in dryland ecosystems

Sonia Kéfi et al. Proc Natl Acad Sci U S A. .

Abstract

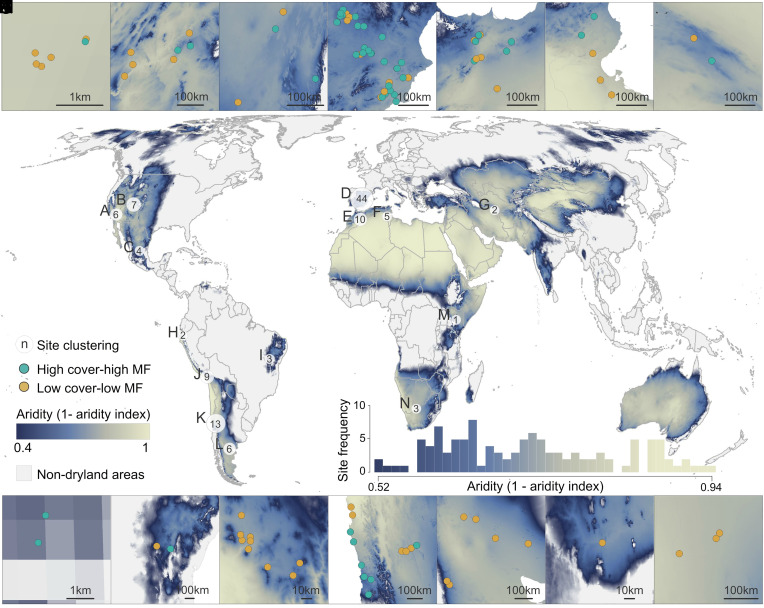
Self-organized spatial patterns are a common feature of complex systems, ranging from microbial communities to mussel beds and drylands. While the theoretical implications of these patterns for ecosystem-level processes, such as functioning and resilience, have been extensively studied, empirical evidence remains scarce. To address this gap, we analyzed global drylands along an aridity gradient using remote sensing, field data, and modeling. We found that the spatial structure of the vegetation strengthens as aridity increases, which is associated with the maintenance of a high level of soil multifunctionality, even as aridity levels rise up to a certain threshold. The combination of these results with those of two individual-based models indicate that self-organized vegetation patterns not only form in response to stressful environmental conditions but also provide drylands with the ability to adapt to changing conditions while maintaining their functioning, an adaptive capacity which is lost in degraded ecosystems. Self-organization thereby plays a vital role in enhancing the resilience of drylands. Overall, our findings contribute to a deeper understanding of the relationship between spatial vegetation patterns and dryland resilience. They also represent a significant step forward in the development of indicators for ecosystem resilience, which are critical tools for managing and preserving these valuable ecosystems in a warmer and more arid world.

Keywords: desertification; drylands; self-organization; spatial patterns.


Conflict of interest statement

Competing interests statement:The authors declare no competing interest.

Figures

Fig. 1.
Fig. 1.
Location of the 115 plots in the global drylands dataset used. Surveyed sites are colored in green for the healthier sites (high vegetation cover—high soil multifunctionality, MF) and yellow for the degraded sites (low vegetation cover—low multifunctionality, MF). Numbers reflect the number of sites in a given geographical area (characterized by the letters A-N), for which a corresponding zoom can be found in the panels above and below the map.
Fig. 2.
Fig. 2.
Dryland ecosystems were categorized into two groups using vegetation cover and soil multifunctionality data. (A) Cover and (B) soil multifunctionality (MF) along aridity for all 115 sites colored by the two groups: healthier (high cover–high soil multifunctionality values; in green) and degraded (low cover–low soil multifunctionality values; in yellow). Aridity was calculated as: 1 – Aridity Index (AI = precipitation/potential evapotranspiration), so that higher values indicate drier conditions. Colored points are the maxima of reconstructed stability landscapes based on potential analysis (i.e., possible attractors), while the white ones are the minima (Materials and Methods). Small panels below A display examples of stability landscapes for aridity values 0.55, 0.7, and 0.85, where valleys in the landscape are the colored points of panel A and the hills the white points (Materials and Methods). (C and D) Densities of sites for each of the two groups for cover (C) and soil multifunctionality data (D).
Fig. 3.
Fig. 3.
Differences in the spatial structure of the vegetation cover between healthier (high cover, high soil multifunctionality) and degraded (low cover–low soil multifunctionality) drylands. The spatial metrics are the proportion of the image covered by the largest vegetation patch [fmaxpatch, (largest patch/image size), with the y axis on a log scale], the slope of the patch size distribution, the cutoff of the patch size distribution, spatial variance, the Spatial Density Ratio (sdr), and the bare soil connectivity (flowlength). For all metrics but sdr, the differences between the two groups are significant (SI Appendix, Table S3).
Fig. 4.
Fig. 4.
Examples of patch size distributions of a healthier site (A) and a degraded one (B). Sites are two grasslands (images 148-b and 192-c of the dataset). Graphs display the fraction of patches larger than a certain size. Black points are observations from the image and gray curves are random expectations (based on 10 randomizations of the image). The red curve is the best fit. Snapshots on the Top Right are the images (black reflects vegetation).
Fig. 5.
Fig. 5.
Estimated slope of the trends in spatial metrics along the aridity gradient evaluated in the model (A), in all the field sites of the dataset (B) and in the two groups of sites separately (C; healthier sites on the left and degraded sites on the right; MF stands for soil multifunctionality). Points reflect the value of the slope of the spatial metrics with aridity. Significant positive and negative slopes are in red and blue, respectively. Observed slopes are in color, while expected trends of randomized landscapes (keeping cover constant but with reshuffled image pixels) are in gray. See legend of Fig. 3 and Materials and Methods for definitions of the spatial metrics. See SI Appendix D for a discussion of the difference in the slopes of SDR in the model and in the data.

References

    1. Solé R., Levin S., Ecological complexity and the biosphere: The next 30 years. Philos. Trans. R. Soc. B Biol. Sci. 377, 20210376 (2022). - PMC - PubMed
    1. Kéfi S., et al. , Spatial vegetation patterns and imminent desertification in Mediterranean arid ecosystems. Nature 449, 213–217 (2007). - PubMed
    1. Rietkerk M., Dekker S. C., de Ruiter P. C., van de Koppel J., Self-organized patchiness and catastrophic shifts in ecosystems. Science 305, 1926–1929 (2004). - PubMed
    1. Rietkerk M., et al. , Evasion of tipping in complex systems through spatial pattern formation. Science 374, eabj0359 (2021). - PubMed
    1. Kéfi S., et al. , Early warning signals of ecological transitions: Methods for spatial patterns. PLoS One 9, e92097 (2014). - PMC - PubMed

LinkOut - more resources