. 2024 Feb 6;121(6):e2317756121.
doi: 10.1073/pnas.2317756121. Epub 2024 Feb 1.

Discovery of lirafugratinib (RLY-4008), a highly selective irreversible small-molecule inhibitor of FGFR2

Affiliations

Discovery of lirafugratinib (RLY-4008), a highly selective irreversible small-molecule inhibitor of FGFR2

Heike Schönherr et al. Proc Natl Acad Sci U S A. .

Abstract

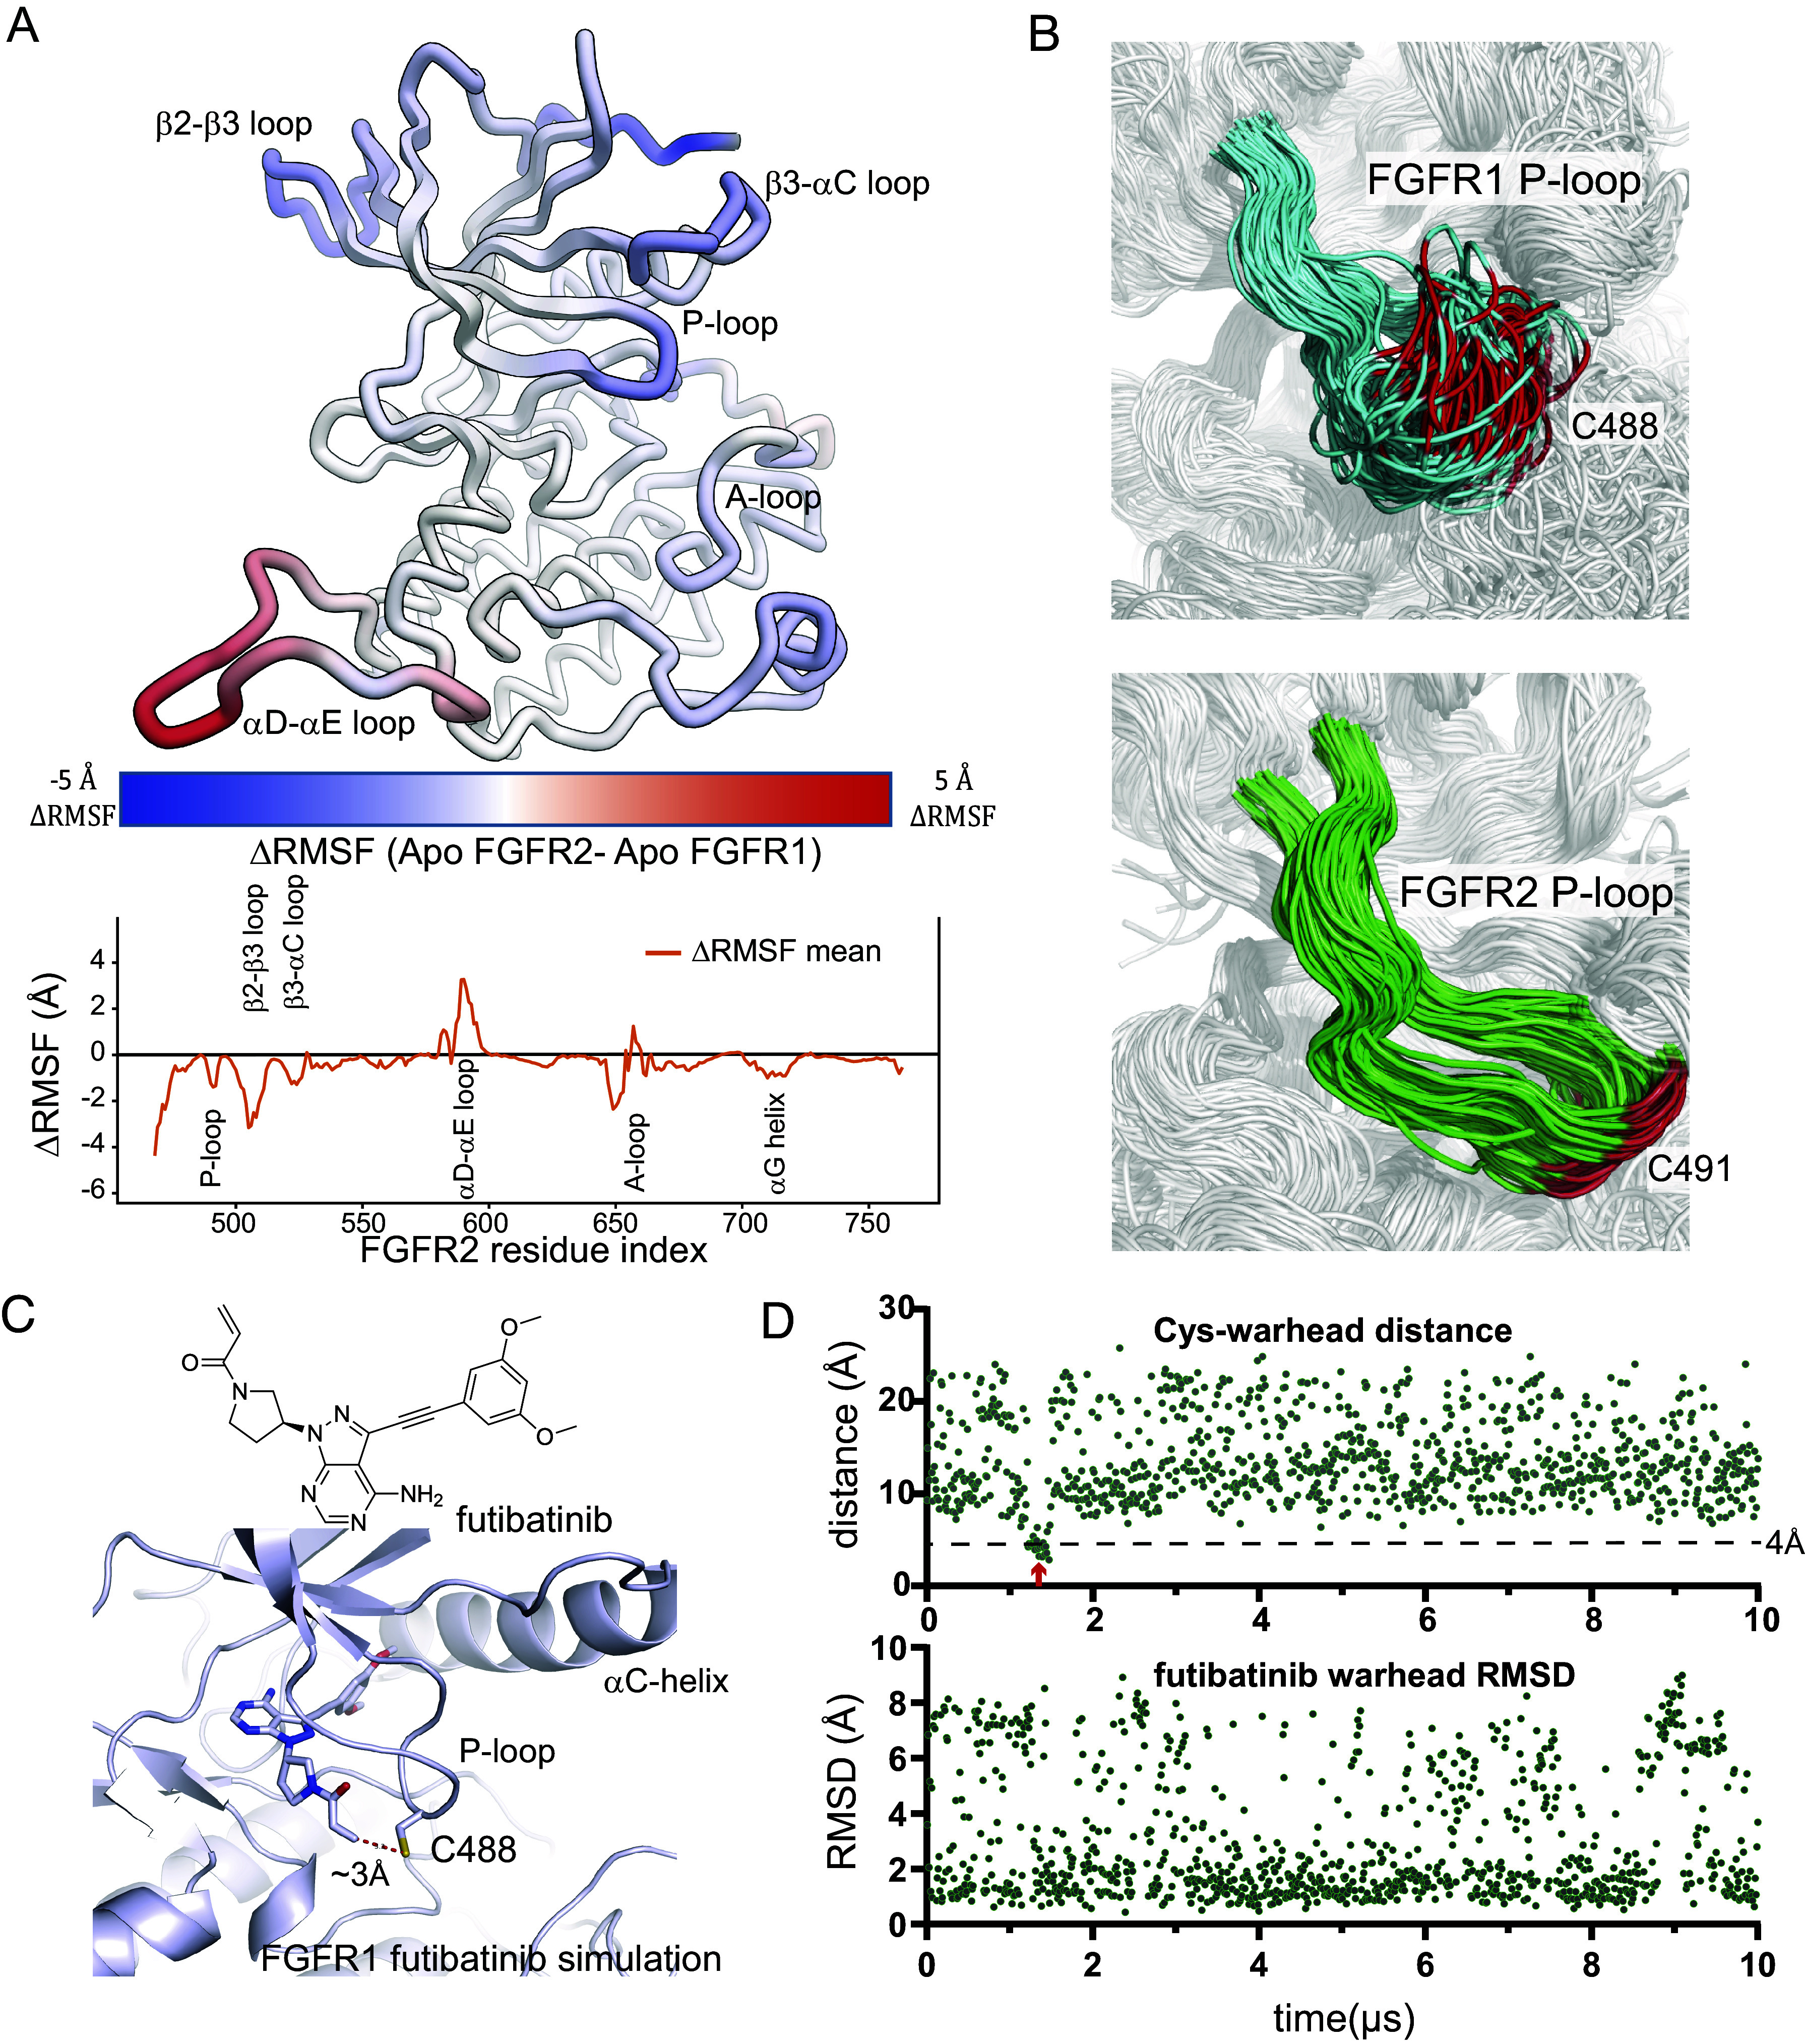
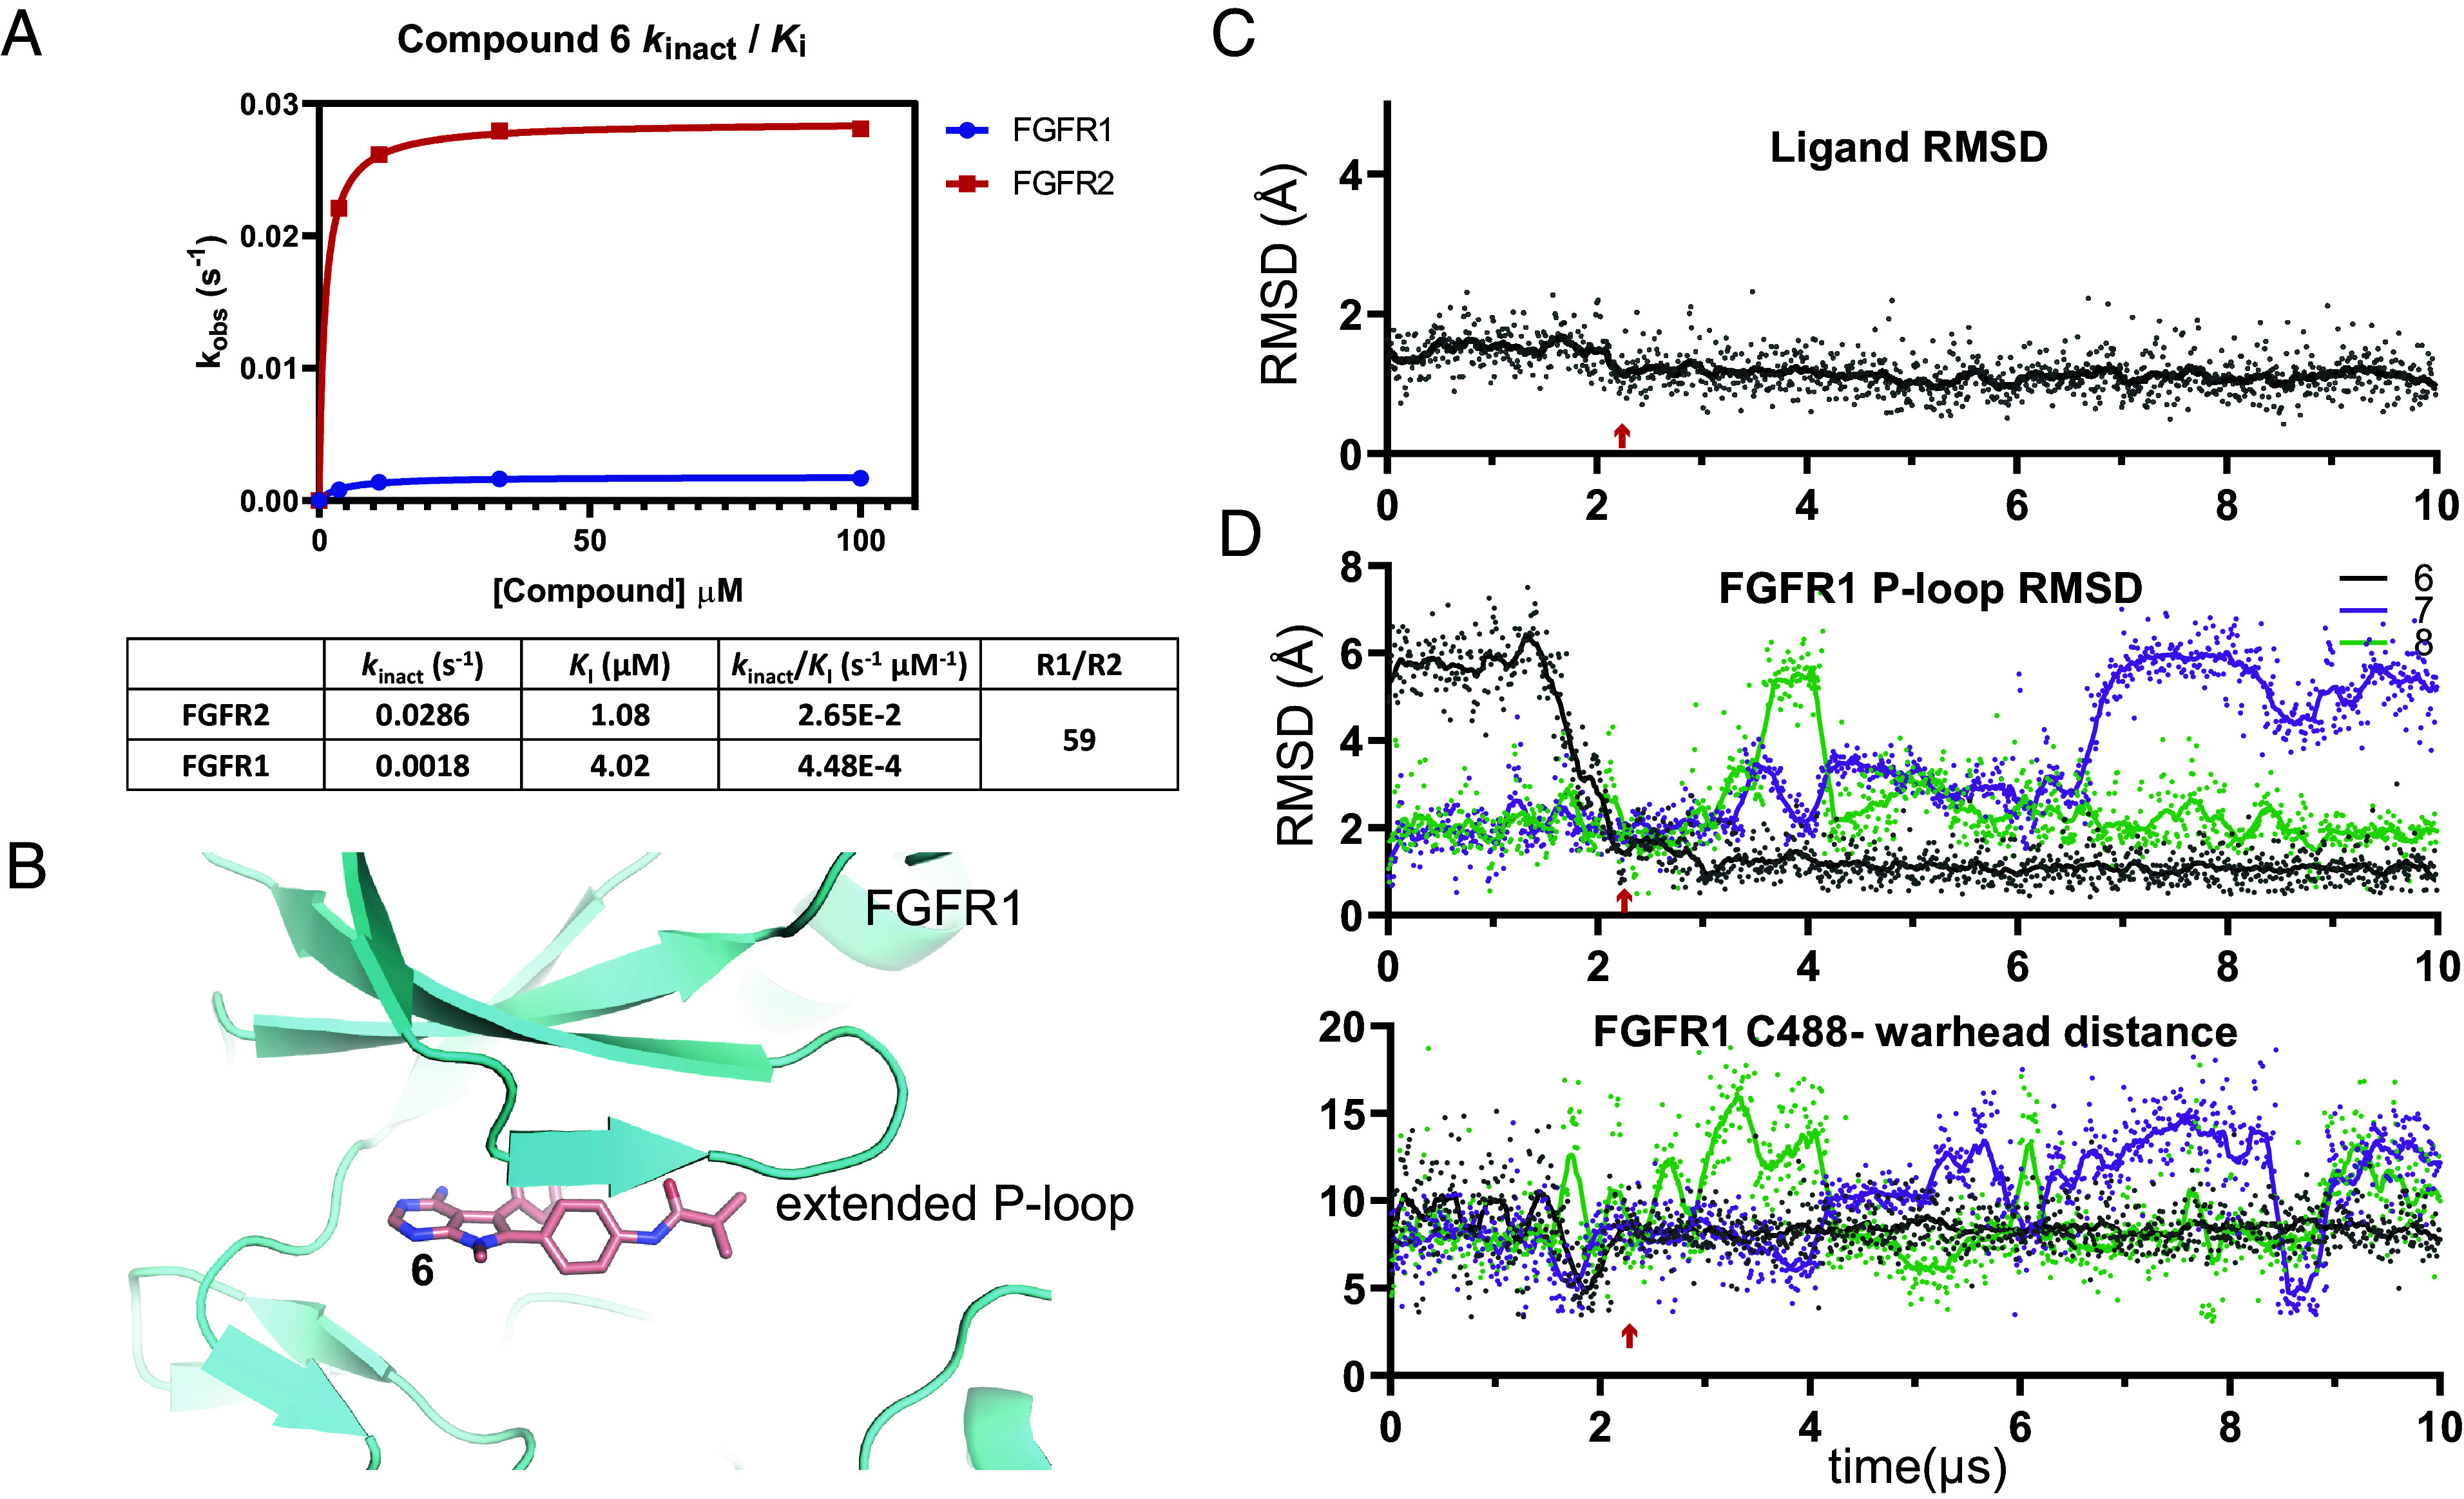
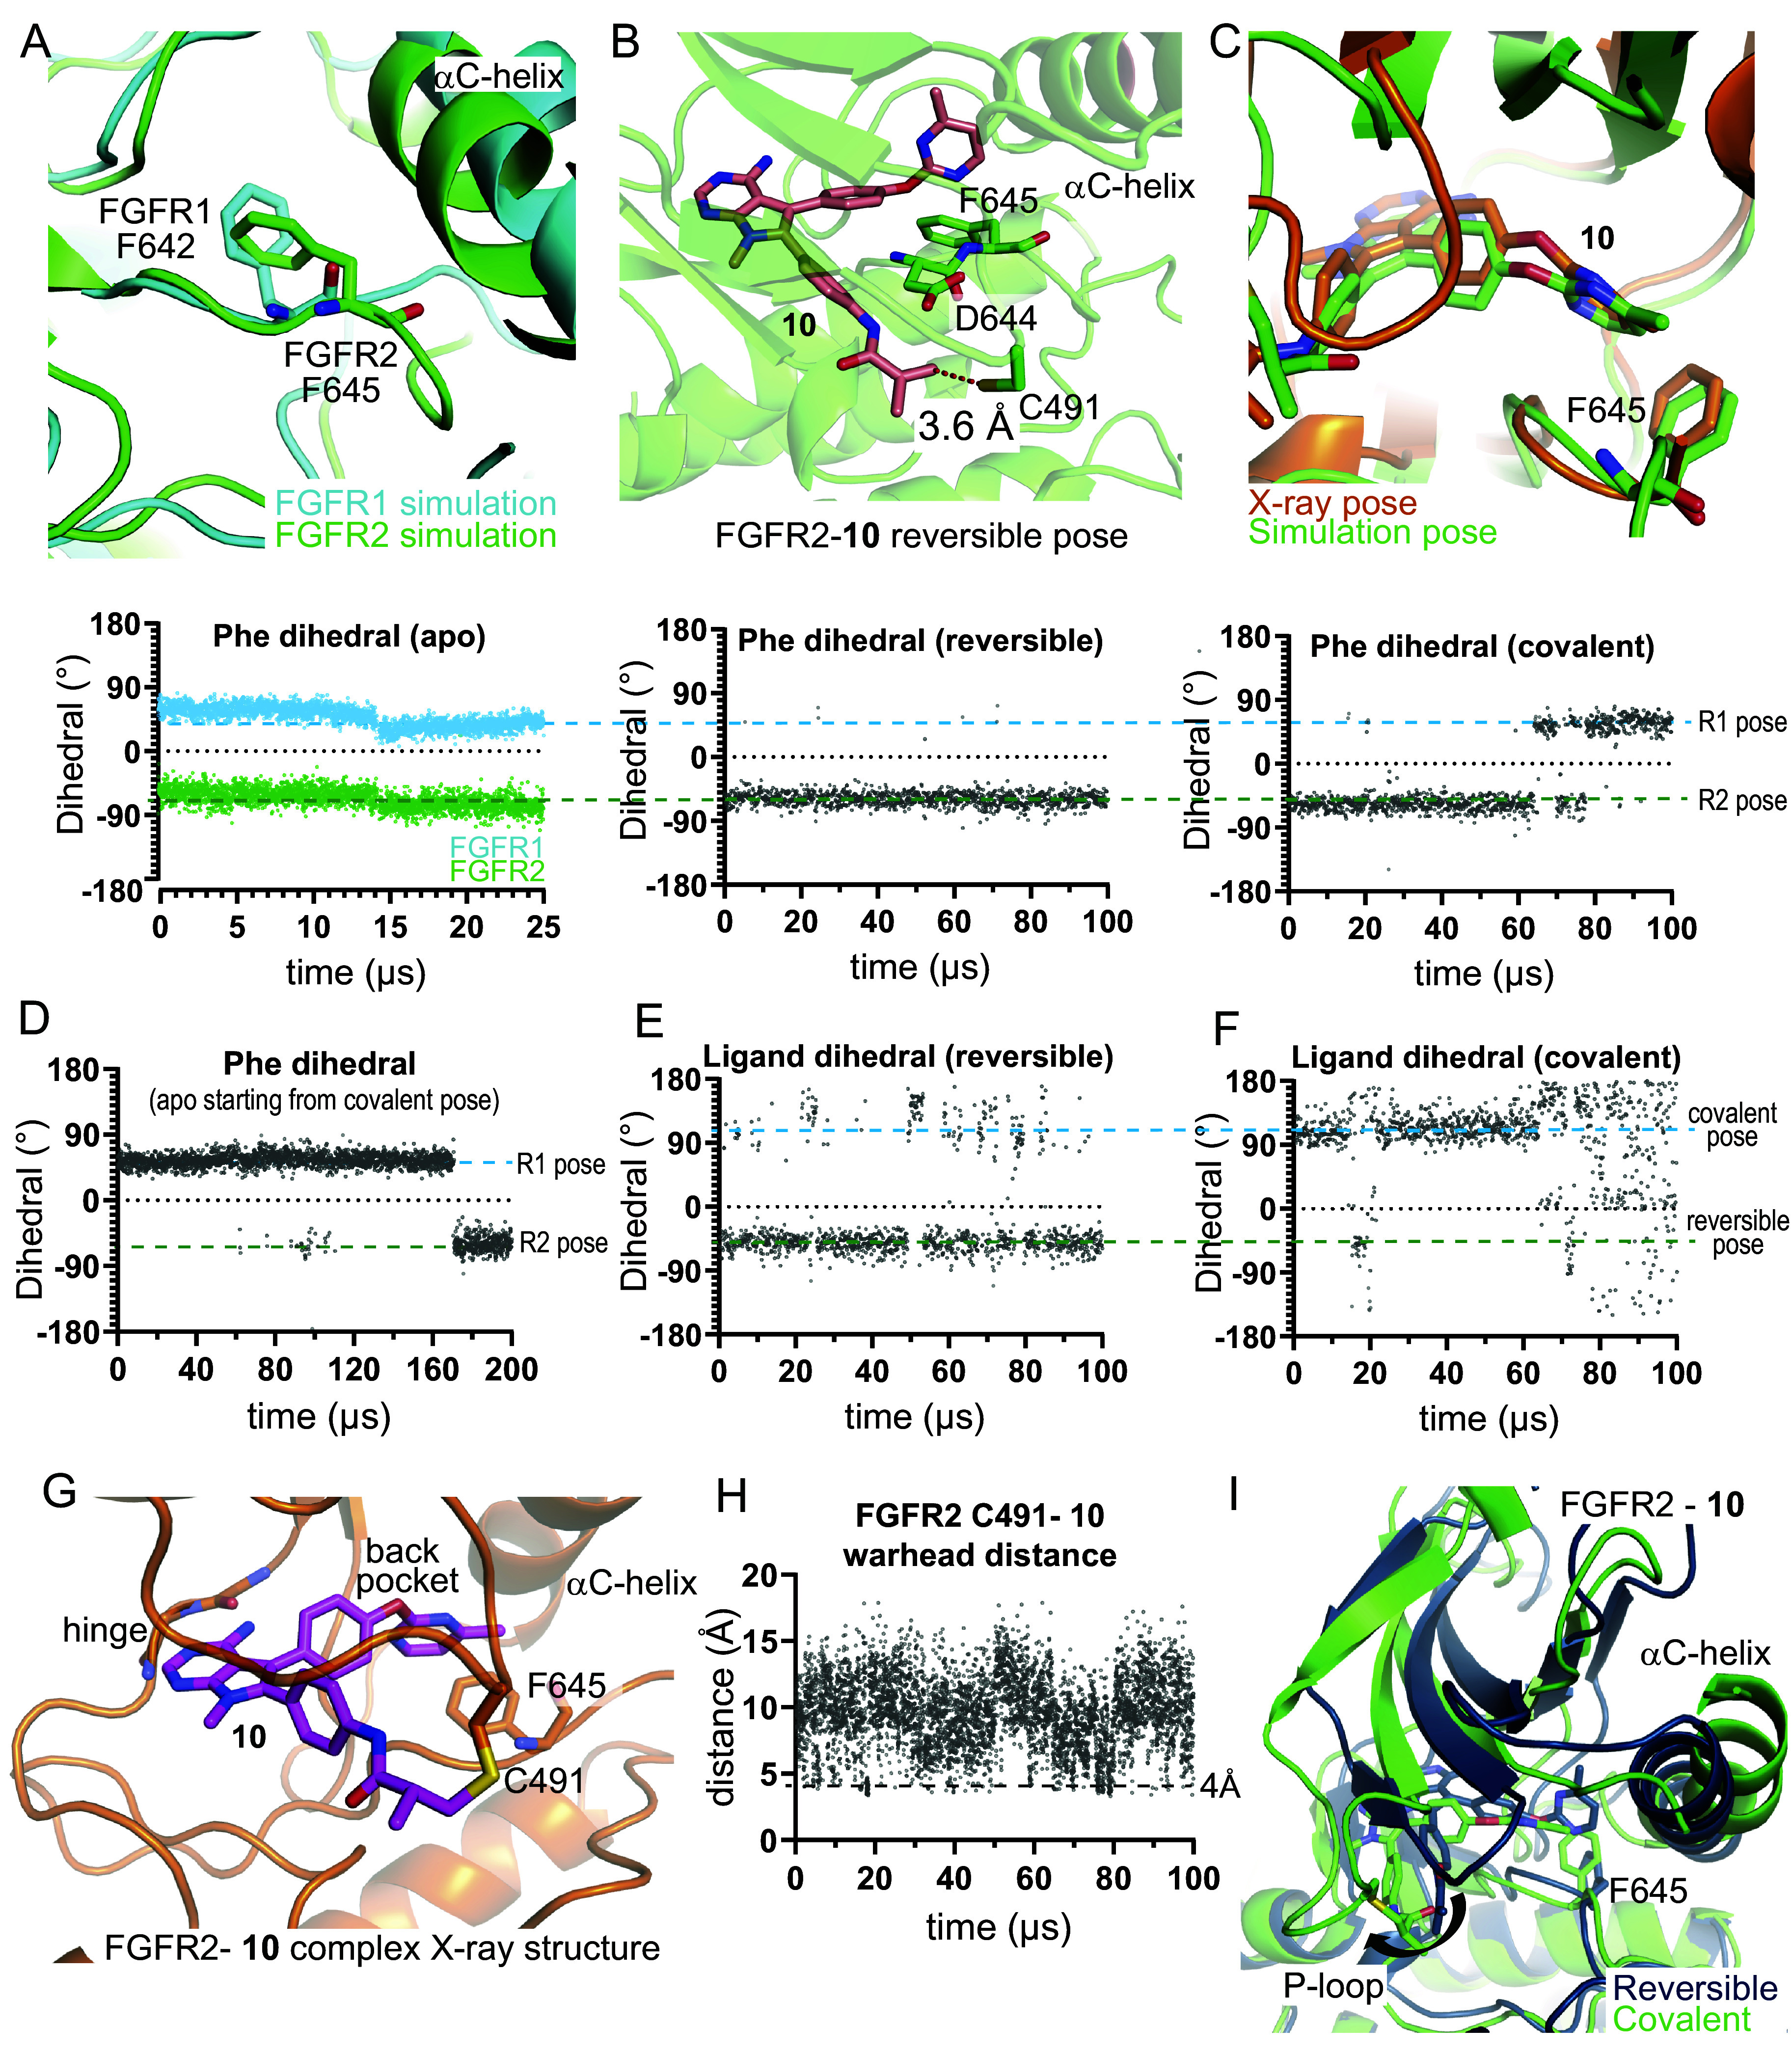
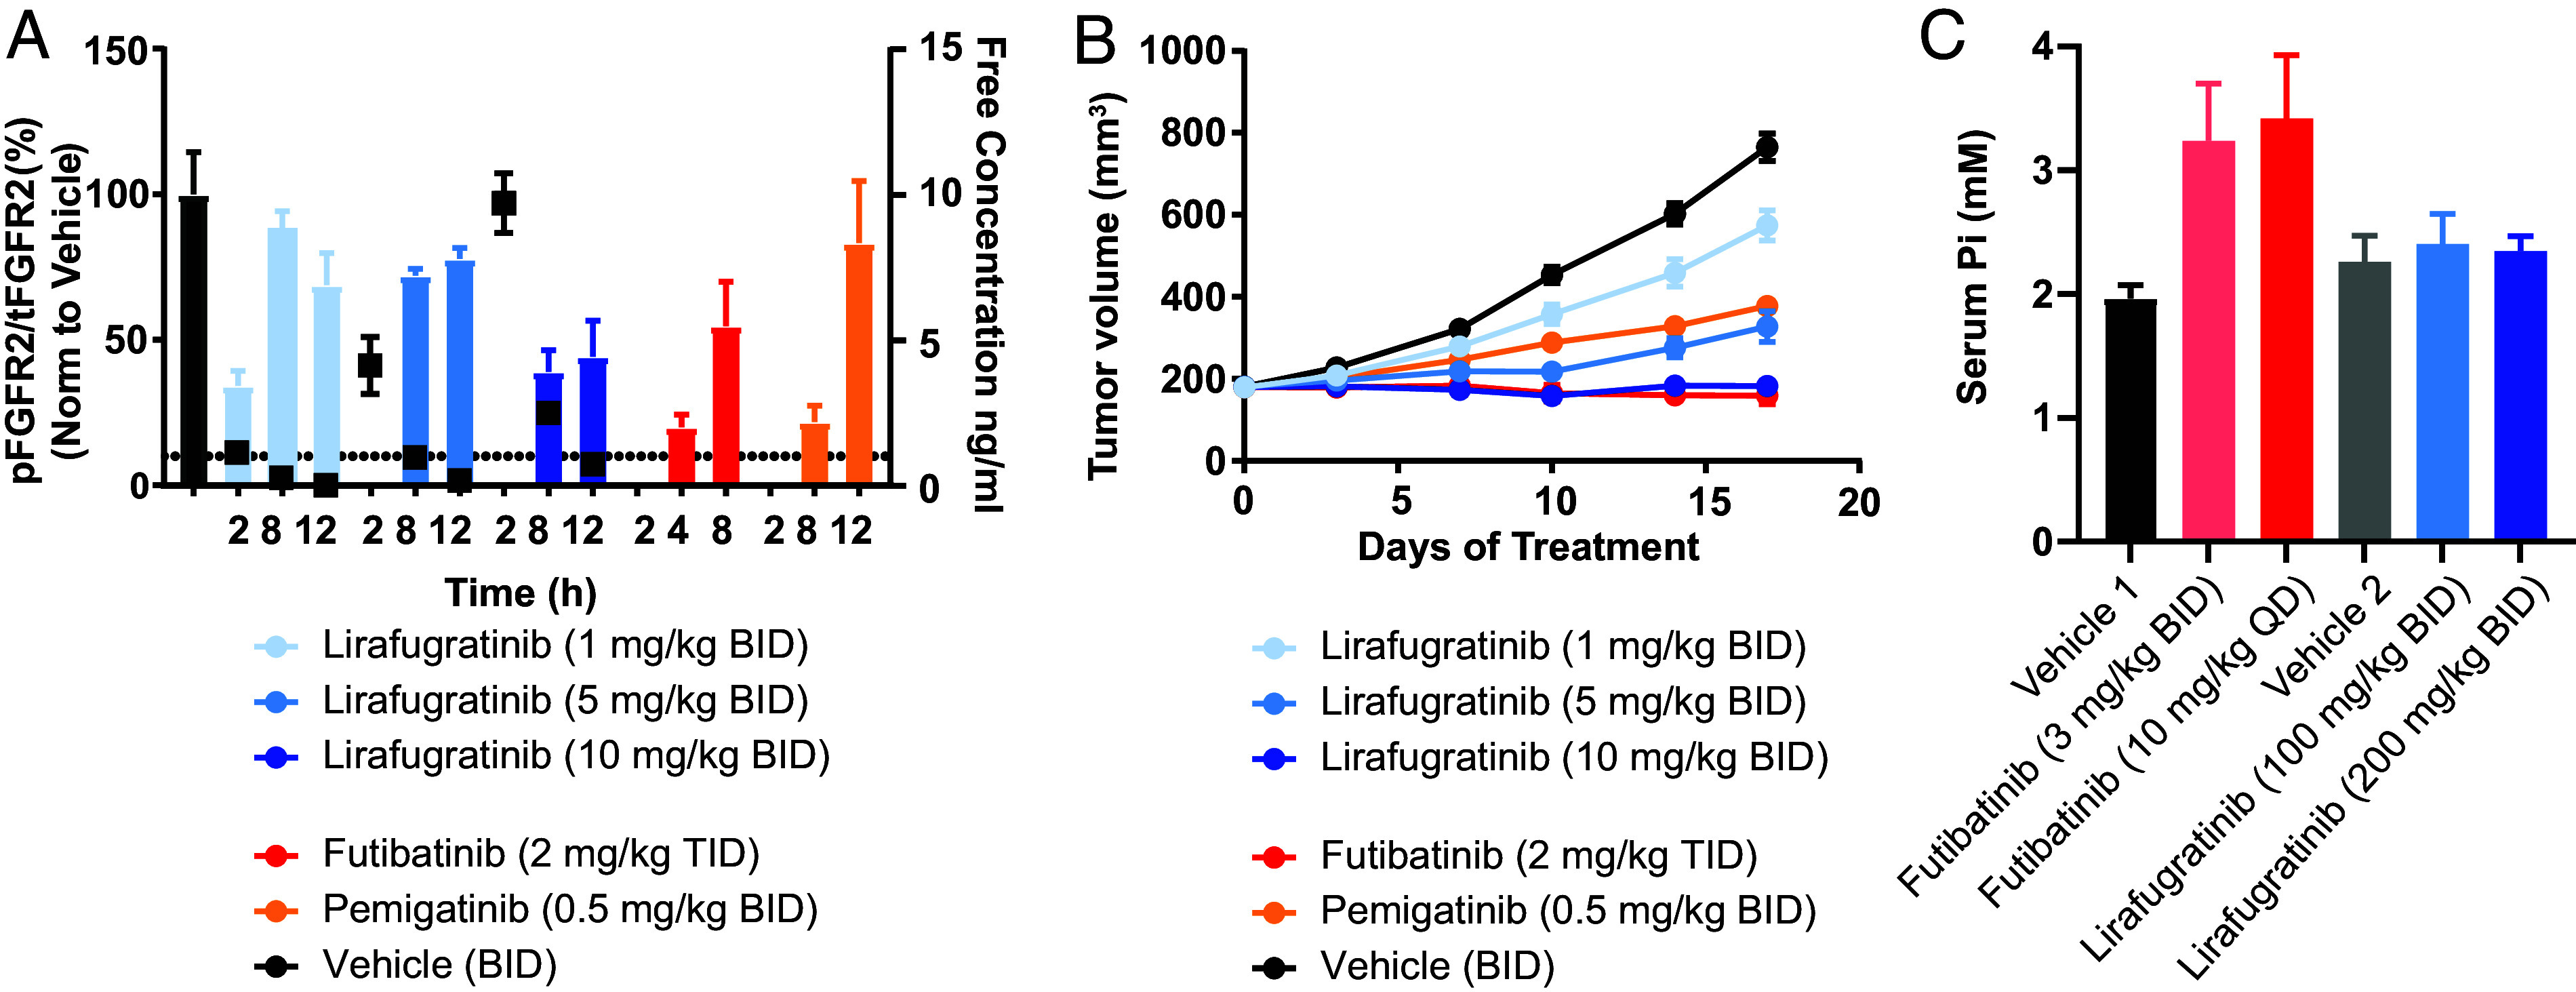
Fibroblast growth factor receptor (FGFR) kinase inhibitors have been shown to be effective in the treatment of intrahepatic cholangiocarcinoma and other advanced solid tumors harboring FGFR2 alterations, but the toxicity of these drugs frequently leads to dose reduction or interruption of treatment such that maximum efficacy cannot be achieved. The most common adverse effects are hyperphosphatemia caused by FGFR1 inhibition and diarrhea due to FGFR4 inhibition, as current therapies are not selective among the FGFRs. Designing selective inhibitors has proved difficult with conventional approaches because the orthosteric sites of FGFR family members are observed to be highly similar in X-ray structures. In this study, aided by analysis of protein dynamics, we designed a selective, covalent FGFR2 inhibitor. In a key initial step, analysis of long-timescale molecular dynamics simulations of the FGFR1 and FGFR2 kinase domains allowed us to identify differential motion in their P-loops, which are located adjacent to the orthosteric site. Using this insight, we were able to design orthosteric binders that selectively and covalently engage the P-loop of FGFR2. Our drug discovery efforts culminated in the development of lirafugratinib (RLY-4008), a covalent inhibitor of FGFR2 that shows substantial selectivity over FGFR1 (~250-fold) and FGFR4 (~5,000-fold) in vitro, causes tumor regression in multiple FGFR2-altered human xenograft models, and was recently demonstrated to be efficacious in the clinic at doses that do not induce clinically significant hyperphosphatemia or diarrhea.

Keywords: FGFR2 inhibitor; cholangiocarcinoma; molecular dynamics simulation; motion-based drug design.


Conflict of interest statement

Competing interests statement:Some authors are currently or have in the past been Relay employees. Some authors may own Relay stock. Relay (and some of the authors) have pending patents containing claims for lirafugratinib: World Intellectual Property Organization, WO2022109577 A1 2022-05-27; World Intellectual Property Organization, WO2020231990 A1 2020-11-19; US 11780845 B2 2023-10-10.

Figures

Fig. 1.
Fig. 1.
The P-loop region has different dynamics in FGFR1 and FGFR2. (A) The structure of FGFR2 is colored according to the difference in the rms fluctuations (ΔRMSF) of the Cα atoms between apo simulations of FGFR1 and FGFR2 (Top). ΔRMSF values are plotted for each residue (Bottom). Individual RMSF plots are reported in SI Appendix, Fig. S1A. (B) Equally spaced frames from a 25 µs simulation of apo FGFR1 (Top, cyan) and apo FGFR2 (Bottom, green) are superposed to highlight the differences in P-loop dynamics. Cys488 of FGFR1 and Cys491 of FGFR2 are shown in red. (C) A frame from a simulation of FGFR1 with futibatinib bound, in which the covalent warhead sampled a distance less than 4 Å from the C488 sulfur atom (marked with a red arrow in panel D); the simulation started from a structure in which futibatinib is in a reversible binding mode with FGFR1 (PDB ID: 6MZQ). (D) For the same simulation, the distance between the futibatinib warhead amide beta-carbon atom and the C488 sulfur atom is plotted (Top). The RMSD of the futibatinib warhead with respect to the first frame of the simulation is also plotted (Bottom).
Fig. 2.
Fig. 2.
Compound 6 induces a stable extended conformation of the FGFR1 P-loop, which allows for selective covalent labeling of FGFR2. (A) Observed rate of inactivation against FGFR2 (red) and FGFR1 (blue) at different concentrations of 6 measured via liquid chromatography intact mass spectrometry, the resulting estimates of kinact and KI for the individual kinases, and the resulting selectivity ratio. (B) From the simulation of 6 bound to FGFR1, which started from the disordered conformation of the P-loop, a representative frame from after the extended P-loop conformation has been induced. (C) Plot of the RMSDs of 6 from the same simulation as in B with respect to the last frame of the simulation. (D) Plots of the RMSDs of the FGFR1 P-loop in a simulation with compound 6 (the same simulation as in B), and in simulations with compounds 7 and 8; the latter two simulations were initiated from the extended conformation of the P-loop (Top). For the same simulations as in the Top panel, plots of the distances between the acrylamide warhead carbon atom of compounds 6, 7, or 8 and the C488 sulfur atoms (Bottom). The red arrow marks the simulation frame in which the P-loop switched from the disordered to the extended conformation in the compound 6 simulation.
Fig. 3.
Fig. 3.
MD Simulations capture protein conformational changes in the FGFR2 back pocket upon covalent engagement with compound 10. (A) Representative frames from FGFR1 (cyan) and FGFR2 (green) apo simulations are superimposed. DFG-motif Phe residues are shown (Top), and the corresponding N-Cα-Cβ-Cγ dihedrals are plotted (Bottom). (B) A representative pose from a simulation of 10 reversibly bound with FGFR2 (Top). The FGFR2 C491-10 warhead distance is marked. F645, adopting a position similar to the apo FGFR2 pose, is shown, and the corresponding dihedral is plotted (Bottom). (C) A representative pose from near the end of a simulation of 10 covalently bound with FGFR2 is superimposed on the X-ray structure of 10 bound to FGFR2 (Top). F645, adopting a position similar to that in the apo FGFR1 pose, is shown, and the corresponding dihedral is plotted (Bottom). (D) The F645 dihedral is plotted from a simulation that started from a covalently bound FGFR2 structure in which the ligand had been removed. The ligand back-pocket biaryl ether dihedral (SI Appendix, Fig. S4J) is plotted for the (E) reversibly and (F) covalently bound FGFR2-10 simulations. (G) The FGFR2-10 covalent complex X-ray structure is shown (PDB ID: 8U1F). (H) The FGFR2 C491-10 warhead distance is plotted from a simulation of 10 reversibly bound with FGFR2. (I) Representative frames from the reversible (dark) and covalent (light) simulations of 10 bound to FGFR2, superposed using C-lobe residues 600 to 764.
Fig. 4.
Fig. 4.
In vivo characterization of lirafugratinib. (A) Dose-dependent inhibition of FGFR2 in the FGFR2-amplified SNU-16 gastric cancer xenograft model. Female BALB/c mice were given twice daily oral doses of 1, 5, or 10 mg/kg lirafugratinib. Doses for futibatinib and pemigatinib were selected to match clinically relevant exposures (20). Animals were euthanized according to procedures approved by the Institutional Animal Care and Use Committee of Pharmaron Beijing Co., Ltd and following the guidance of the Association for Assessment and accreditation of Laboratory Animal Care, and tumors harvested at the indicated time points after the final dose on the fourth day of dosing. Tumor lysates were analyzed via pFGFR2 (Y653/654) and total FGFR2 (tFGFR2) HTRF; pFGFR2 normalized to tFGFR2 is reported (n = 3/group). Unbound plasma concentration of lirafugratinib is shown as black squares. Data are mean ± SEM. (B) Dose-dependent antitumor activity of lirafugratinib in the FGFR2-amplified SNU-16 gastric cancer xenograft model dosed as in A (n = 9/group). Data are mean ± SEM. (C) Lirafugratinib spares FGFR1-driven hyperphosphatemia in vivo. Following 14 d of dosing futibatinib and lirafugratinib to Sprague Dawley rats at the indicated doses and schedules, blood was collected from all animals for serum phosphate analysis (n = 5/group). Doses for futibatinib were chosen to match clinically efficacious doses. Data are mean ± SD.

References

    1. Babina I. S., Turner N. C., Advances and challenges in targeting FGFR signalling in cancer. Nat. Rev. Cancer 17, 318–332 (2017). - PubMed
    1. Katoh M., Fibroblast growth factor receptors as treatment targets in clinical oncology. Nat. Rev. Clin. Oncol. 16, 105–122 (2019). - PubMed
    1. Tomczak A., et al. , Precision oncology for intrahepatic cholangiocarcinoma in clinical practice. Br. J. Cancer 127, 1701–1708 (2022). - PMC - PubMed
    1. Arai Y., et al. , Fibroblast growth factor receptor 2 tyrosine kinase fusions define a unique molecular subtype of cholangiocarcinoma. Hepatology 59, 1427–1434 (2014). - PubMed
    1. Goyal L., Kongpetch S., Crolley V. E., Bridgewater J., Targeting FGFR inhibition in cholangiocarcinoma. Cancer Treat. Rev. 95, 102170 (2021). - PubMed

MeSH terms

Substances