. 2024 Feb 1;22(2):e3002205.
doi: 10.1371/journal.pbio.3002205. eCollection 2024 Feb.

Cellular arrangement impacts metabolic activity and antibiotic tolerance in Pseudomonas aeruginosa biofilms

Affiliations

Cellular arrangement impacts metabolic activity and antibiotic tolerance in Pseudomonas aeruginosa biofilms

Hannah Dayton et al. PLoS Biol. .

Abstract

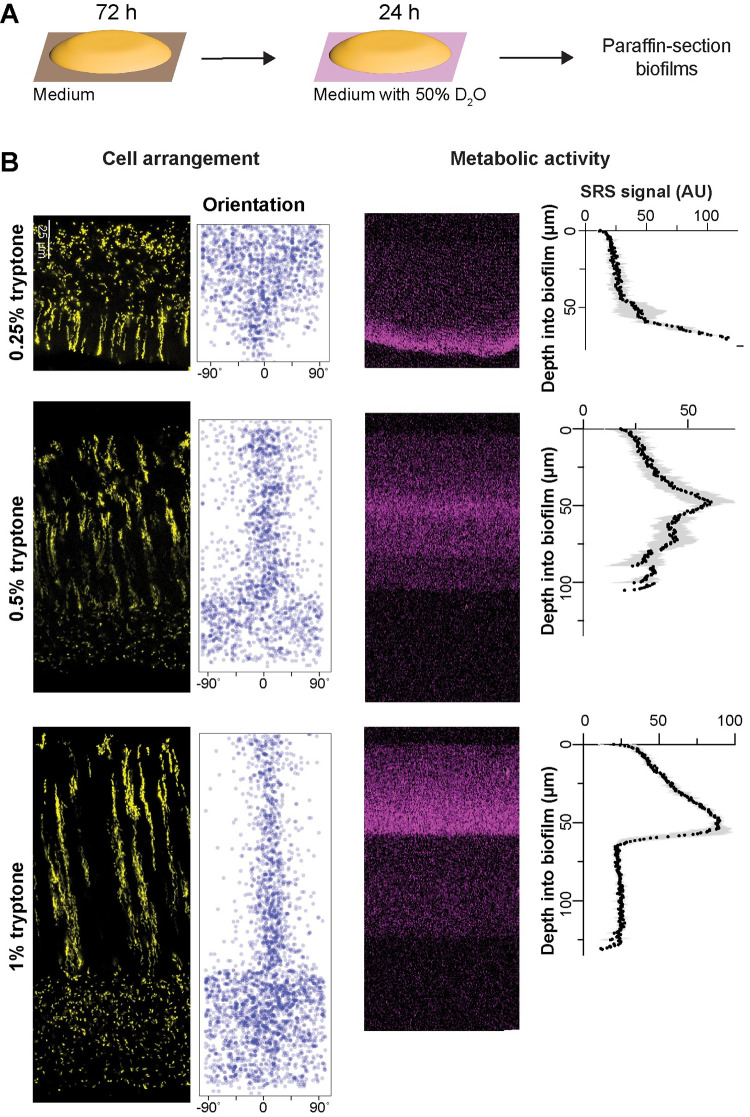
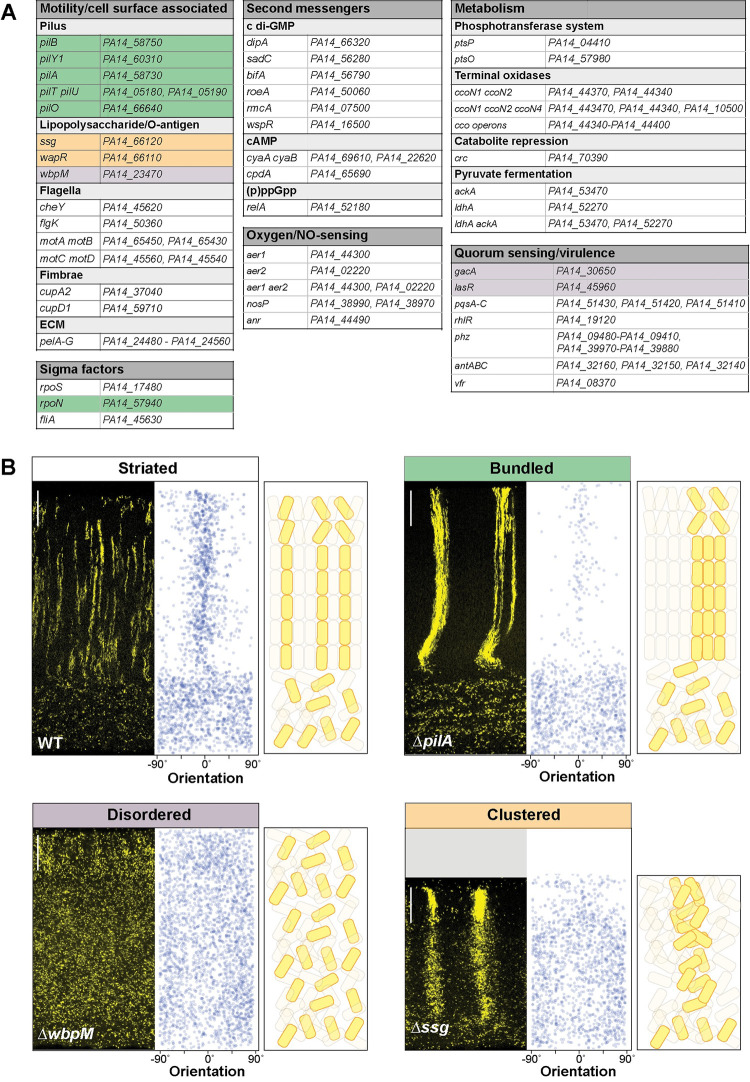
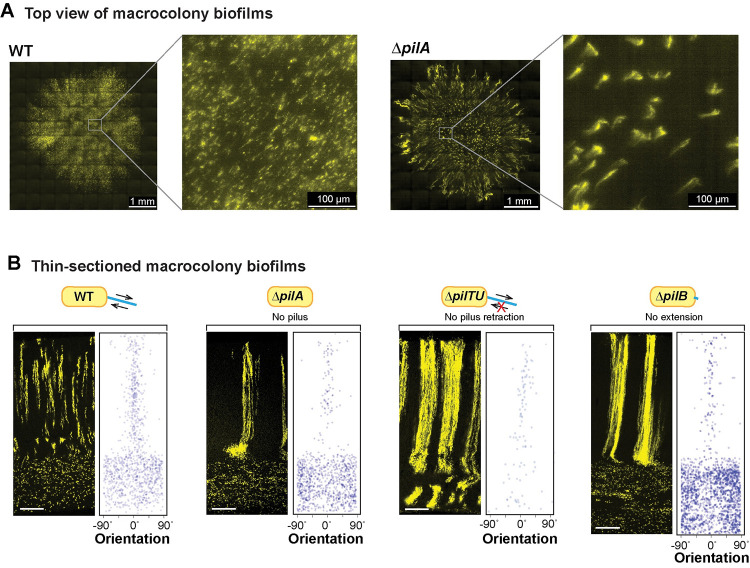
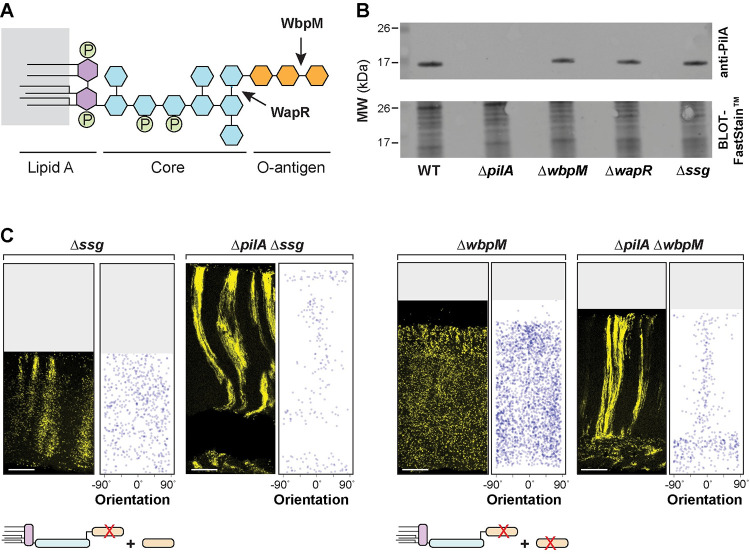
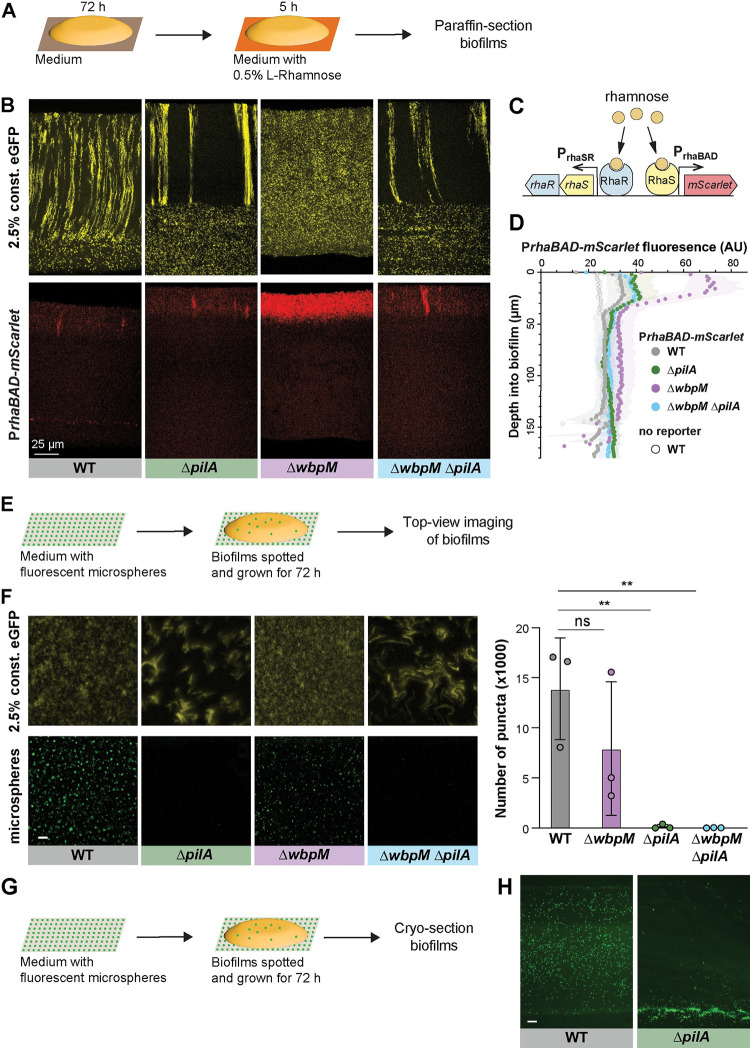
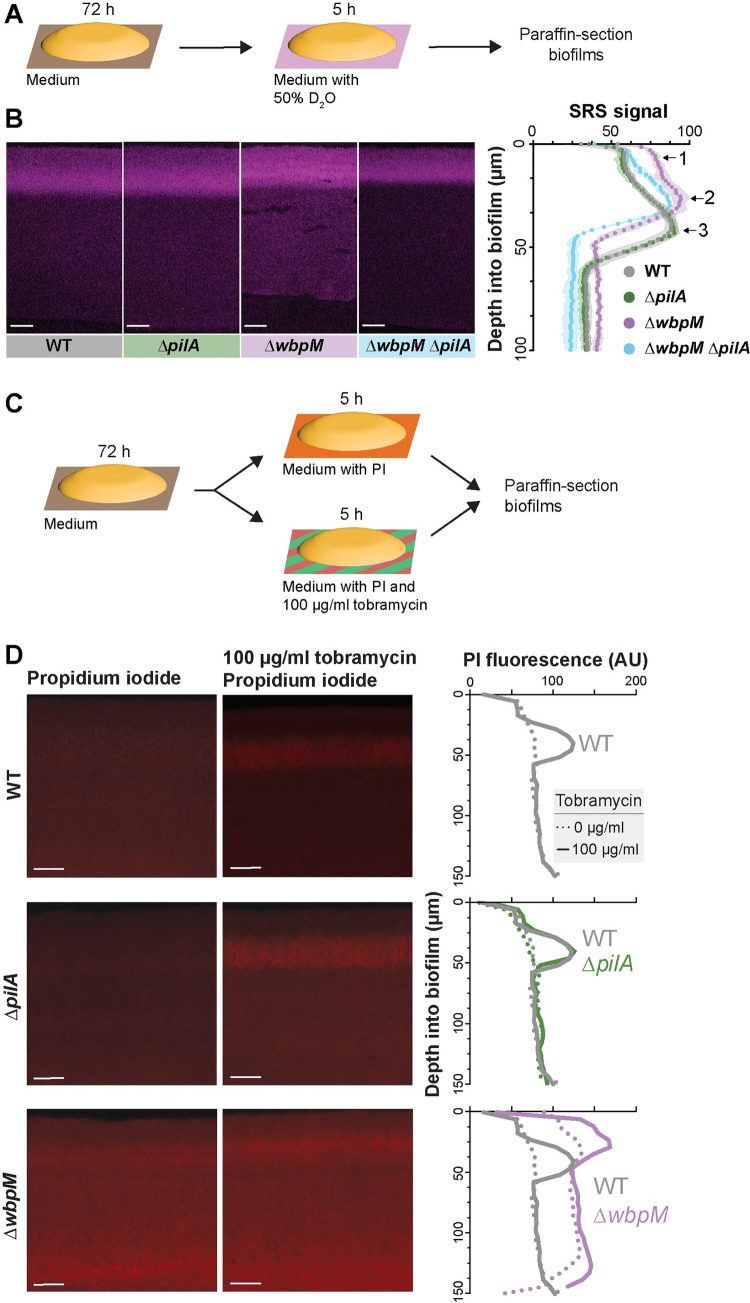
Cells must access resources to survive, and the anatomy of multicellular structures influences this access. In diverse multicellular eukaryotes, resources are provided by internal conduits that allow substances to travel more readily through tissue than they would via diffusion. Microbes growing in multicellular structures, called biofilms, are also affected by differential access to resources and we hypothesized that this is influenced by the physical arrangement of the cells. In this study, we examined the microanatomy of biofilms formed by the pathogenic bacterium Pseudomonas aeruginosa and discovered that clonal cells form striations that are packed lengthwise across most of a mature biofilm's depth. We identified mutants, including those defective in pilus function and in O-antigen attachment, that show alterations to this lengthwise packing phenotype. Consistent with the notion that cellular arrangement affects access to resources within the biofilm, we found that while the wild type shows even distribution of tested substrates across depth, the mutants show accumulation of substrates at the biofilm boundaries. Furthermore, we found that altered cellular arrangement within biofilms affects the localization of metabolic activity, the survival of resident cells, and the susceptibility of subpopulations to antibiotic treatment. Our observations provide insight into cellular features that determine biofilm microanatomy, with consequences for physiological differentiation and drug sensitivity.


Conflict of interest statement

The authors have declared that no competing interests exist.

Figures

Fig 1
Fig 1. P. aeruginosa cells form vertical striations across depth in colony and pellicle biofilms.
(A) Left: Top view of a P. aeruginosa colony biofilm grown for 3 days on 1% tryptone + 1% agar, and schematic showing orientation of the sample used for SEM imaging. Right: SEM images of a full colony biofilm cross-section. Insets of higher magnification show cellular arrangement and morphology for the indicated locations in the biofilm. (B) Top: Schematic of mixing assay method. Left: Fluorescence micrograph of a thin section prepared from a colony biofilm grown in the mixing assay. Center: Orientation across depth for fluorescent cells detected in biofilm thin section micrographs. The “spread of orientation” is the standard deviation of orientation values for each pixel across biofilm depth; the values shown in the plot are the average “spread of orientation” at each depth for thin section images taken from 6 biological-replicate biofilms. Shading represents the standard deviation for this average. Right: Schematic of cellular arrangement across depth in mature biofilms. (C) Micrographs of biofilms prepared as described in (B), but sacrificed at the indicated time points. Scale bar applies to all images. The data underlying Fig 1B and 1C can be found in S1 Data. (D) Top: Setup used to grow pellicle biofilms for microscopy. Bottom: Fluorescence micrograph of a thin section prepared from a pellicle biofilm. The inoculum contained 2.5% cells that constitutively express mScarlet. Images shown in this figure are representative of at least 2 independent experiments. mScarlet fluorescence is colored yellow. Quantification of colony-forming units confirmed that expression of mScarlet did not affect fitness during growth in mixing assay biofilms (S1 Fig).
Fig 2
Fig 2. Resource availability affects the organization of cellular arrangement zones and metabolic activity in biofilms.
(A) Experimental setup for growing P. aeruginosa biofilms on agar plates and their subsequent transfer to medium containing D2O for analysis of metabolic activity by SRS microscopy. (B) Left: Fluorescence micrographs and quantification of cellular orientation across depth for thin sections from mixing-assay biofilms grown on different concentrations of tryptone. Scale bar applies to all images. Right: SRS microscopy images and SRS signal across depth for thin sections from mixing-assay biofilms grown on different concentrations of tryptone. SRS signal represents the average of 3 biological replicates with shading indicating the standard deviation. The data underlying this figure can be found in S1 Data.
Fig 3
Fig 3. Specific global regulators and cell surface components are required for WT cell patterning in colony biofilms.
(A) List of genes mutated and then screened for altered cellular arrangement across depth in biofilms. Those showing altered cellular arrangement are shaded and colors correspond to the phenotype categories shown in (B). (B) Fluorescence micrographs of thin sections from WT and indicated mutant biofilms grown on 1% tryptone + 1% agar for 3 days. Biofilm inocula contained 2.5% cells that constitutively express mScarlet. mScarlet fluorescence is colored yellow. Quantification of orientation across depth is shown for each image, and cartoons of cellular arrangement are shown for each phenotype category. Images shown are representative of at least 2 independent experiments. Scale bars are 25 μm. The data underlying this figure can be found in S1 Data.
Fig 4
Fig 4. A functional pilus is required for WT cellular arrangement.
(A) High-resolution light sheet microscopy images of 19-hour-old biofilms, with 1% of cells expressing fluorescent protein (colored yellow). (B) Fluorescence micrograph and quantification of orientation for WT and each of the indicated mutants grown in the mixing assay and thin-sectioned. Scale bars are 25 μm. The extent of pilus function present in each strain is indicated by a cartoon. The data underlying this figure can be found in S1 Data.
Fig 5
Fig 5. PilA is required for the disordered cellular arrangement phenotypes of O-antigen mutants.
(A) Schematic of LPS and O-antigen indicating the bonds affected by WapR and WbpM activity. Hexagons represent monosaccharides and circles represent phosphate groups. The major components of LPS are color-coded. (B) Western blot showing PilA protein levels in macrocolony biofilms of WT and the indicated mutants. Equal amounts of total protein from sheared whole-cell lysates for each strain were resolved by SDS-PAGE using a 15% polyacrylamide gel. The PilA protein was detected using an anti-PilA antibody. (C) Fluorescence micrograph and quantification of orientation for each of the indicated mutants grown in the mixing assay and thin-sectioned. A cartoon representation of LPS and O-antigen (colors corresponding to panel (A)) indicates whether unattached and/or attached O-antigen are present in each strain. Images shown are representative of at least 2 independent experiments and mScarlet fluorescence is colored yellow. Scale bars are 25 μm. The data underlying this figure can be found in S1 Data.
Fig 6
Fig 6. Cellular arrangement affects the uptake of substrates into colony biofilms.
(A) Schematic illustration of the experimental setup for growing P. aeruginosa biofilms on agar plates and their subsequent transfer to medium containing L-rhamnose. (B) Fluorescence micrographs of thin sections from WT and indicated mutant biofilms. Biofilm inocula contained 2.5% cells that constitutively express eGFP and 97.5% RhaSR-PrhaBAD-controlled mScarlet-producing strain. Top panels show eGFP fluorescence (colored yellow) and bottom panels show the mScarlet fluorescence for each thin section. Scale bar applies to all images. (C) Schematic of RhaSR-PrhaBAD expression system driving mScarlet production. (D) Quantification of mScarlet fluorescence shown in (B). Shading represents standard deviation of biological triplicates. (E) Schematic of the experimental setup for growing P. aeruginosa macrocolony biofilms on agar plates with fluorescent microspheres (200 nm). (F) Left: Top-view images taken from center of macrocolony biofilms that were grown on medium with microspheres (colored green). Biofilms contained 2.5% cells constitutively expressing eGFP (colored yellow). Scale bar is 25 μm and applies to all images. Right: Quantification of microspheres visible in top-view images. Each data point is a biological replicate, bar height indicates the mean of these replicates; p values are based on two-sided unpaired t tests (n.s., not significant; ** p ≤ 0.01). (G) Schematic illustration of the experimental setup for growing biofilms on agar plates with fluorescent microspheres for cryosectioning. (H) Fluorescence micrographs of cryosections of biofilms grown on microspheres (colored green). Scale bar is 25 μm and applies to both images. The data underlying Fig 6D and 6F can be found in S1 Data.
Fig 7
Fig 7. Mutations affecting cellular arrangement alter metabolic activity and antibiotic tolerance profiles within biofilms.
(A) Schematic illustration of the experimental setup for growing biofilms on agar plates and their subsequent transfer to a medium containing D2O for analysis of metabolic activity using SRS microscopy. (B) Left: SRS micrographs of WT and mutant biofilm thin sections. Right: Graph showing the quantitative shift in metabolic activity distribution in different mutants. (C) Schematic illustration of the experimental setup for growing biofilms on agar plates and their subsequent transfer to a medium containing propidium iodide or propidium iodide + tobramycin (D) Left: Fluorescence micrographs of three-day-old biofilms exposed to PI. Center: Fluorescence micrographs of biofilms treated with tobramycin and PI. Right: Graphs showing quantification of PI staining. Images are representative of at least 2 independent experiments. (B, D) Scale bars are 25 μm. The data underlying Fig 7B and 7D can be found in S1 Data.

Update of

References

    1. Jo J, Price-Whelan A, Dietrich LEP. Gradients and consequences of heterogeneity in biofilms. Nat Rev Microbiol. 2022;20:593–607. doi: 10.1038/s41579-022-00692-2 - DOI - PMC - PubMed
    1. Azimi S, Lewin GR, Whiteley M. The biogeography of infection revisited. Nat Rev Microbiol. 2022;20:579–592. doi: 10.1038/s41579-022-00683-3 - DOI - PMC - PubMed
    1. Hall-Stoodley L, Costerton JW, Stoodley P. Bacterial biofilms: from the natural environment to infectious diseases. Nat Rev Microbiol. 2004;2:95–108. doi: 10.1038/nrmicro821 - DOI - PubMed
    1. O’Toole G, Kaplan HB, Kolter R. Biofilm formation as microbial development. Annu Rev Microbiol. 2000;54:49–79. doi: 10.1146/annurev.micro.54.1.49 - DOI - PubMed
    1. Mah TF O ’Toole GA. Mechanisms of biofilm resistance to antimicrobial agents. Trends Microbiol. 2001;9:34–39. - PubMed

Substances