. 2024 Feb:143:103167.
doi: 10.1016/j.jaut.2024.103167. Epub 2024 Feb 1.

IL-23 induces CLEC5A+ IL-17A+ neutrophils and elicit skin inflammation associated with psoriatic arthritis

Affiliations

IL-23 induces CLEC5A+ IL-17A+ neutrophils and elicit skin inflammation associated with psoriatic arthritis

Hiroki Furuya et al. J Autoimmun. 2024 Feb.

Abstract

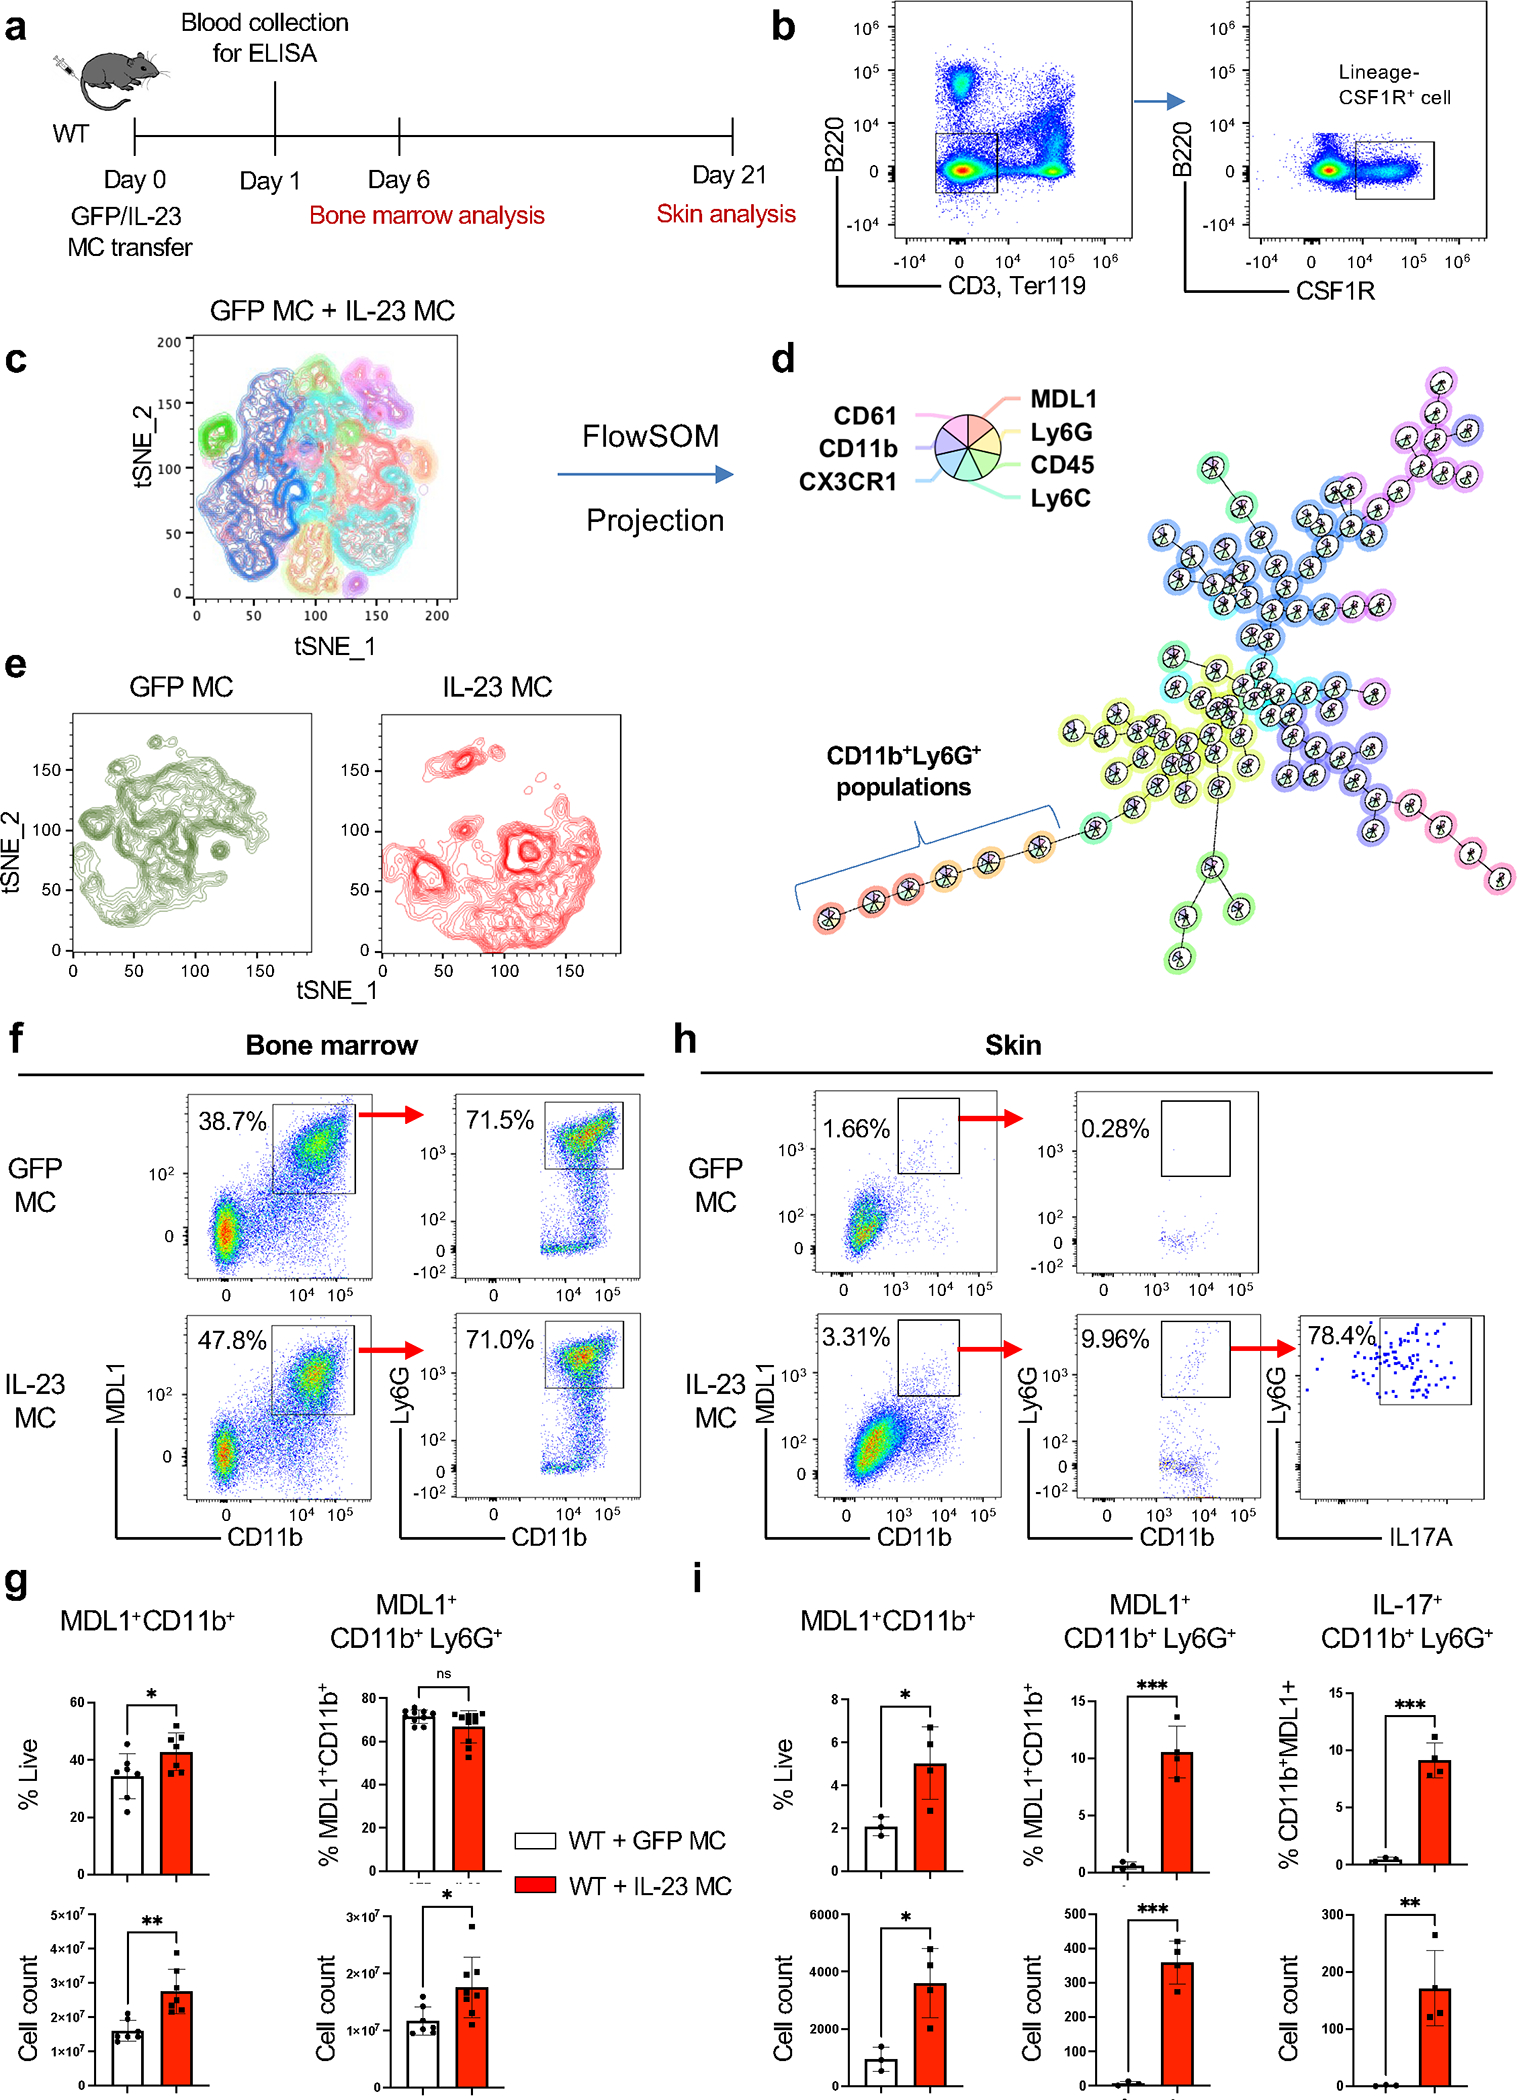
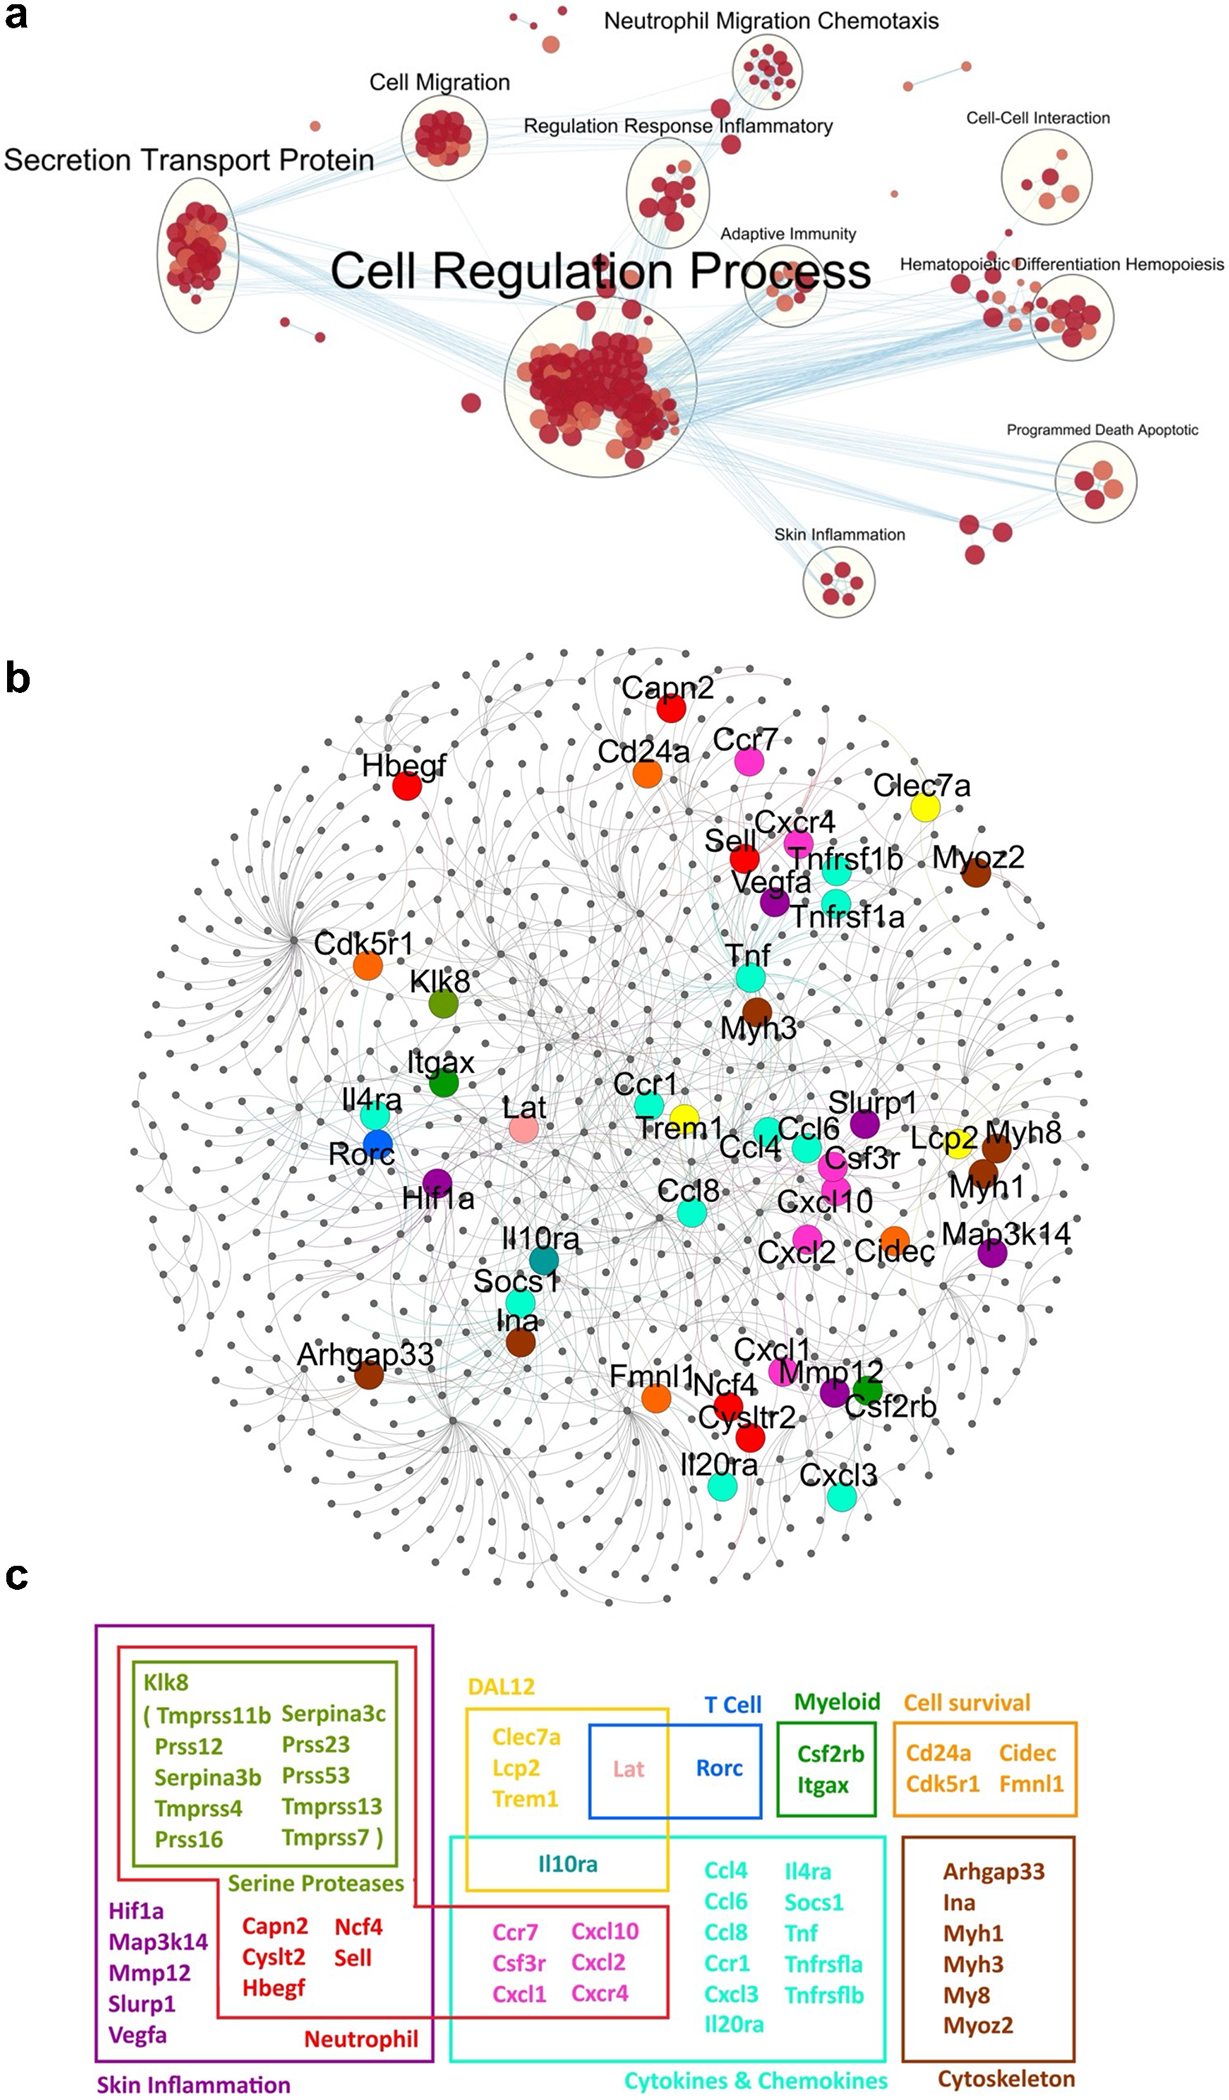
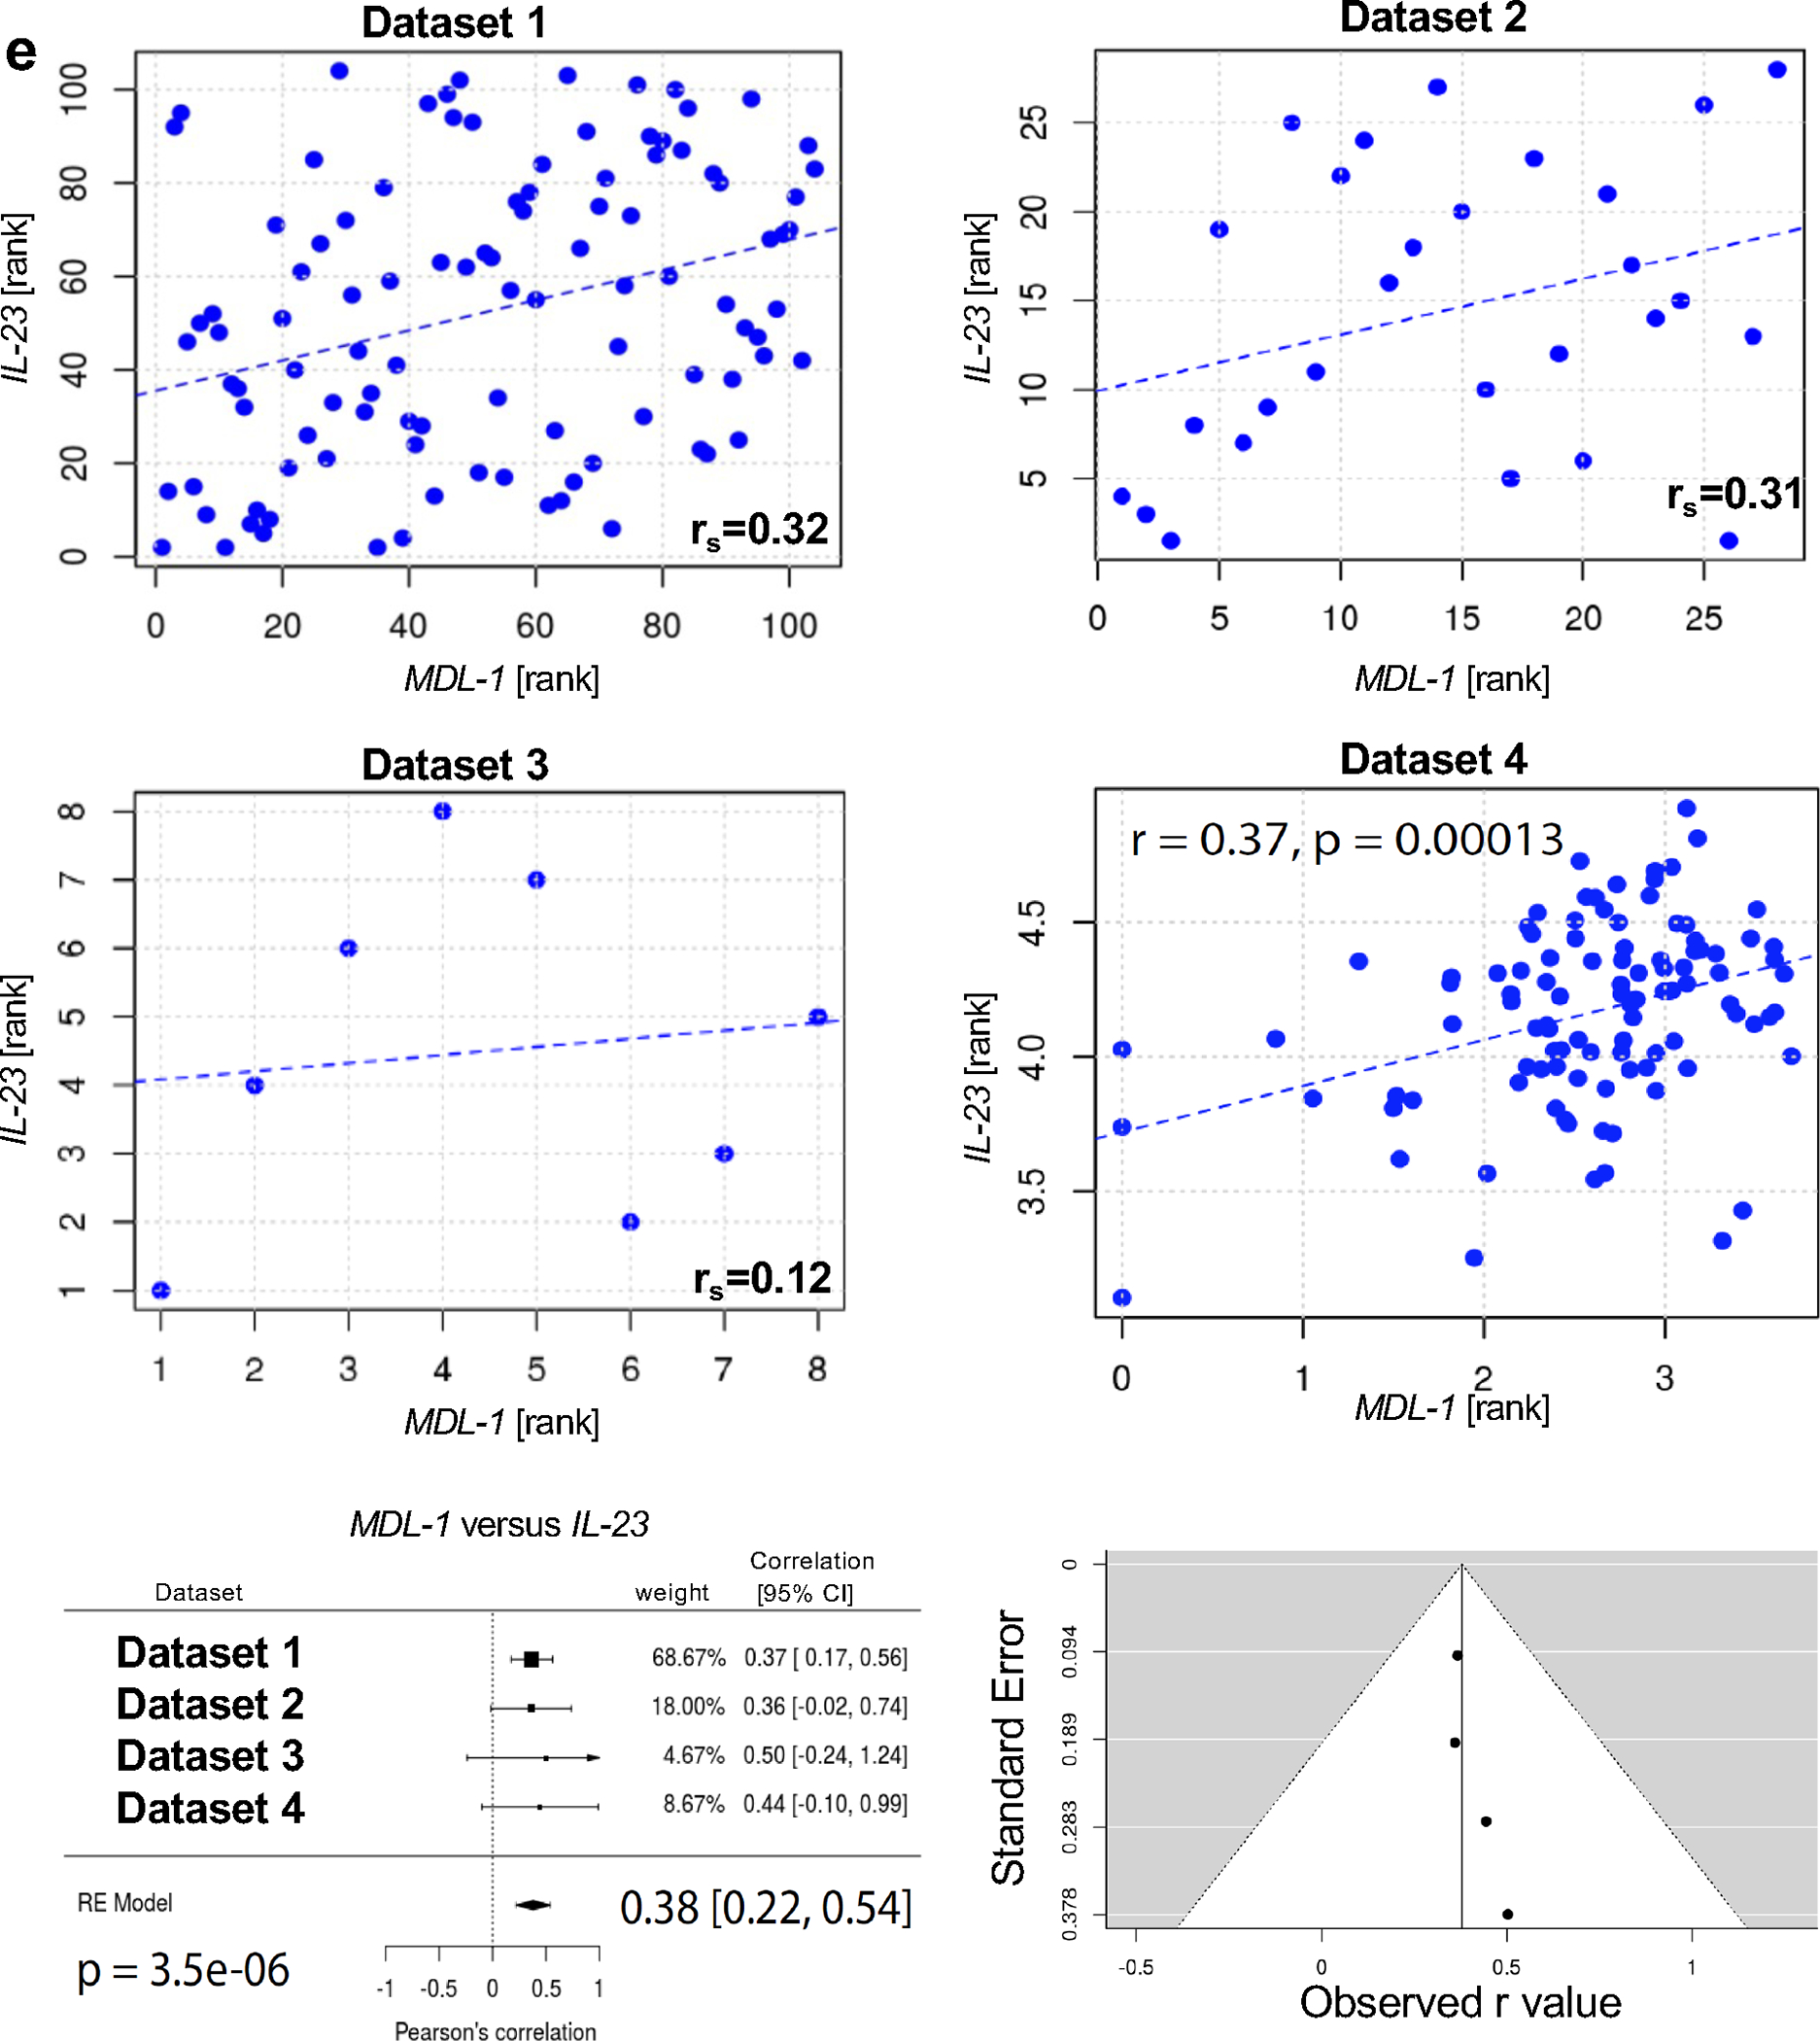
IL-23-activation of IL-17 producing T cells is involved in many rheumatic diseases. Herein, we investigate the role of IL-23 in the activation of myeloid cell subsets that contribute to skin inflammation in mice and man. IL-23 gene transfer in WT, IL-23RGFP reporter mice and subsequent analysis with spectral cytometry show that IL-23 regulates early innate immune events by inducing the expansion of a myeloid MDL1+CD11b+Ly6G+ population that dictates epidermal hyperplasia, acanthosis, and parakeratosis; hallmark pathologic features of psoriasis. Genetic ablation of MDL-1, a major PU.1 transcriptional target during myeloid differentiation exclusively expressed in myeloid cells, completely prevents IL-23-pathology. Moreover, we show that IL-23-induced myeloid subsets are also capable of producing IL-17A and IL-23R+MDL1+ cells are present in the involved skin of psoriasis patients and gene expression correlations between IL-23 and MDL-1 have been validated in multiple patient cohorts. Collectively, our data demonstrate a novel role of IL-23 in MDL-1-myelopoiesis that is responsible for skin inflammation and related pathologies. Our data open a new avenue of investigations regarding the role of IL-23 in the activation of myeloid immunoreceptors and their role in autoimmunity.

Keywords: Arthritis; Autoimmune diseases; Autoimmunity; Inflammation; Psoriatic.


Conflict of interest statement

Declaration of competing interest The authors have no conflicts of interest to declare.

Figures

Fig. 1:
Fig. 1:. IL-23-induced skin pathology depends on IL-23R signaling and correlates with increased number of epidermal MDL-1+ cells.
(a) Photographs of murine ears 21 days post IL-23 MC gene transfer showing the development of silvery white scales in WT mice compared to GFP MC and/or IL-23RGFP+/+. (b) H&E staining of murine ears showing epidermal hyperplasia and number of infiltrated cells. Arrow indicates neutrophil exudates (Munro’s microabscess). (Images are representative of three independent experiments and 9–11 mice per each group. Scale bars, 100 μm). (c) Quantification of epidermal thickness (μm) and (d) infiltrated cell number. (e) Gene expression analysis of inflammatory markers showing an elevation of K16, S100a7, S100a8, S100a9, Cxcl-1, and Cxcl-2 in the ears of IL-23 MC gene transfer WT mice and/or IL-23RGFP+/+ mice compared to GFP MC (control). (f) H&E and immunofluorescence images of staining with DAPI (blue), MDL-1-PE (red), LY6G-FITC (green) and DAPI (blue), MDL-1-FITC (green), IL-23R-PE (red) showing an increase of epidermal MDL-1+IL-23R+ neutrophils (orange) in the ears of IL-23 MC gene transfer mice compared to GFP MC (control) mice. Scale bars, 100 μm. (g) Flow cytometric analysis of murine dorsal skin post IL-23 MC gene transfer, showing an expansion of (h) CD11b+CD45+ cells and (i) CD11b+CD45+Ly6G+, cells compared to GFP MC (control) mice. (j) Gene expression analysis of murine ear post IL-23 gene transfer showing an elevation of Cd11b, Cd14, Mdl-1, and Mpo compared to GFP MC (control) and or IL-23RGFP+/+ mice. Data represent mean ± SEM of three independent experiments. *P<0.05; ** P<0.01; *** P<0.001 by Mann-Whitney.
Fig. 2.
Fig. 2.. IL-23 induces the expansion of MDL-1+ cell subsets in the bone marrow that migrate to the skin.
(a) Schematic presentation of GFP/IL-23 gene transfer model in WT mice. (b) Representative Fig. of integrated flow cytometry data showing the gating strategy of lineageCSF1R+ cell used for unsupervised clustering with (c) tSNE plot and (d) FlowSOM based on seven surface molecules, showing distinct clusters. (e) Cell clusters post-GFP/IL-23 gene transfer visualized in tSNE plot. (f) Representative flow cytometry and (g) quantitative data of bone marrow derived MDL-1+CD11b+ and MDL-1+CD11b+Ly6G+ 6 days post-IL-23 gene transfer. (h) Representative flow cytometry (i) and quantitative data of skin derived MDL-1+CD11b+, MDL-1+CD11b+Ly6G+and MDL-1+IL-17+CD11b+Ly6G+ 21 days post-IL-23 gene transfer. *P<0.05; ** P<0.01; *** P<0.001 by Mann-Whitney.
Fig. 3:
Fig. 3:. IL-23 induced epidermal hyperplasia is prevented with genetic ablation of MDL-1 receptor.
(a) Representative flow cytometry and (b) quantitative data of bone marrow derived MDL-1+Ly6G+ cells and (c) Gene expression analysis of Il6, S100a7, Cxcl1, Cxcl2 and Il23r of total bone marrow cells 48 hours post-IL-23 gene transfer in WT and/or Mdl-1−/− compared to GFP (control) mice. (d) Photographs of murine ears 21 days post IL-23 gene transfer showing the development of silvery white scales in WT and/or Mdl-1−/− compared to GFP MC (control) mice. (e) H&E staining showing epidermal hyperplasia and inflammatory infiltrate in the murine ear. (Images are representative of three independent experiments and 9–11 mice per each group. Scale bars, 100 μm). (f) Quantification of epidermal thickness (μm) and (g) infiltrated cells per mm2. (h) Gene expression analysis of Il1b, Tnf and Il6 in the ears of IL-23 gene transfer WT and/or Mdl-1−/− compared to GFP MC (control) mice. (i) Gene expression analysis of Il1b in sorted CD11b+ bone marrow cells in the presence or absence of LPS stimulation. Data represent mean ± SEM of three independent experiments. *P<0.05; ** P<0.01; *** P<0.001 by Mann-Whitney.
Fig. 4:
Fig. 4:. Myeloid activation in the IL-23 induced skin transcriptome
(a, b) Venn diagrams showing the overlap of DEGs between WT+IL-23 v. WT+GFP and Mdl1−/−+IL-23 v. WT+GFP and WT+IL-23 v. Mdl1−/−+IL-23. (c) The hierarchically clustered heat-map of the target DEGs associated with immune response (myeloid cells, neutrophils, T cell, DAP12) genes, (d) skin inflammation associated genes. Color-coding is based on log-transformed read count values. DEGs are defined by fold change >2 or <0.5 and q-value (FDR-adjusted p-value) < 0.05. The samples were clustered using average linkage and 1-correlation distances. (Red to green color bar indicates low to high log fold-change values). (e) Chord diagram shows interrelationship for interested genes among KEGG pathways with 4 DEGs or more in the comparison group WT+IL-23 v. WT+GFP. Link thickness is proportional to the overlap between pathways and log-fold change is depicted from decreasing to increasing next to each gene.
Fig. 5:
Fig. 5:. Genetic ablation of MDL-1 protects against IL-23-induced expression of neutrophil-associated genes, neutrophil chemotaxis, and neutrophil proteases in the skin.
(a) Map of biological processes that are statistically enriched in the shared DEGs between the WT+IL23 and Mdl-1−/−+IL23 groups. Nodes are gene-sets with 10 or more genes each. Size and color intensity of each node correspond to the number of genes and its statistical enrichment, respectively. Two nodes are connected when they share a significant number of genes (Jaccard coefficient > 0.25). (b) Protein-protein interaction network for the target DEGs among WT+GFP v. WT+IL-23 v. Mdl-1−/− +IL-23. Yellow, red, blue, dark, purple, orange, bright blue, and brown nodes indicate DAP12-, neutrophil-, T cell-, myeloid-, skin inflammation-, cell survival-, cytokines & chemokines-, and cytoskeleton-associated genes, respectively. (c) For genes that belong to different groups, the color pink was used to show an overlap between the neutrophil and cytokines & chemokines groups, light green an overlap between the DAP12 and cytokines & chemokines groups, dark blue an overlap between the DAP12 and T cell groups, and blue-green an overlap between the skin inflammation and serine proteases groups.
Fig. 6:
Fig. 6:. MDL-1 correlates with IL-23R and IL-23 in human PsA and PsO patients.
(a) Representative images of H&E staining of human psoriatic skin showing the presence of neutrophil exudates in the stratum corneum. (Arrows indicate Munro’s microabscesses). (b) Chloroacetate esterase staining showing the accumulation of neutrophil polymorphs in the stratum corneum and dermis. (Arrows indicate chloroacetate esterase positive cells). Immunofluorescent staining of human skin biopsies of patients with (c) PsA and (d) psoriasis with DAPI (blue), anti-MDL-1 (green) and anti-IL-23R (red) indicating MDL-1 colocalization with IL-23R, (MDL-1+IL-23R+ cells) (orange) in the epidermal and dermal infiltrates. Images are representative of three experiments. Scale bar, 50 μm. (e) Gene expression correlations with MDL-1 and IL-23. Linear regression lines are depicted as blue dashes. Spearman’s rank-order correlations (rs) are listed. Within these correlations none of the data points were found to be overly influential (Cook’s distance for all data points was < 1). Meta-analyses were conducted to evaluate these correlations across the four independently acquired RNA-Seq datasets and the results are displayed as Forest plots. 95% confidence intervals (CI), weighted averages and p values are shown. There was no evidence (p = 0.87 and p = 0.75, respectively) of any substantial residual heterogeneity, i.e. there was no remaining variability in effect sizes that was unexplained.

Similar articles

Cited by

References

    1. Filer C, Ho P, Smith RL, Griffiths C, Young HS, Worthington J et al. Investigation of association of the IL12B and IL23R genes with psoriatic arthritis. Arthritis and rheumatism, 2008;58:3705–9. - PMC - PubMed
    1. Nair RP, Duffin KC, Helms C, Ding J, Stuart PE, Goldgar D et al. Genome-wide scan reveals association of psoriasis with IL-23 and NF-kappaB pathways. Nature genetics, 2009;41:199–204. - PMC - PubMed
    1. Sutton CE, Lalor SJ, Sweeney CM, Brereton CF, Lavelle EC, Mills KH. Interleukin-1 and IL-23 induce innate IL-17 production from gammadelta T cells, amplifying Th17 responses and autoimmunity. Immunity, 2009;31:331–41. - PubMed
    1. Smith E, Zarbock A, Stark MA, Burcin TL, Bruce AC, Foley P et al. IL-23 is required for neutrophil homeostasis in normal and neutrophilic mice. J Immunol, 2007;179:8274–9. - PubMed
    1. Mamedov MR, Scholzen A, Nair RV, Cumnock K, Kenkel JA, Oliveira JHM et al. A Macrophage Colony-Stimulating-Factor-Producing gammadelta T Cell Subset Prevents Malarial Parasitemic Recurrence. Immunity, 2018;48:350–63 e7. - PMC - PubMed

Publication types