. 2024 Feb 15;187(4):861-881.e32.
doi: 10.1016/j.cell.2024.01.008. Epub 2024 Jan 31.

SMARCAL1 is a dual regulator of innate immune signaling and PD-L1 expression that promotes tumor immune evasion

Affiliations

SMARCAL1 is a dual regulator of innate immune signaling and PD-L1 expression that promotes tumor immune evasion

Giuseppe Leuzzi et al. Cell. .

Abstract

Genomic instability can trigger cancer-intrinsic innate immune responses that promote tumor rejection. However, cancer cells often evade these responses by overexpressing immune checkpoint regulators, such as PD-L1. Here, we identify the SNF2-family DNA translocase SMARCAL1 as a factor that favors tumor immune evasion by a dual mechanism involving both the suppression of innate immune signaling and the induction of PD-L1-mediated immune checkpoint responses. Mechanistically, SMARCAL1 limits endogenous DNA damage, thereby suppressing cGAS-STING-dependent signaling during cancer cell growth. Simultaneously, it cooperates with the AP-1 family member JUN to maintain chromatin accessibility at a PD-L1 transcriptional regulatory element, thereby promoting PD-L1 expression in cancer cells. SMARCAL1 loss hinders the ability of tumor cells to induce PD-L1 in response to genomic instability, enhances anti-tumor immune responses and sensitizes tumors to immune checkpoint blockade in a mouse melanoma model. Collectively, these studies uncover SMARCAL1 as a promising target for cancer immunotherapy.

Keywords: AP-1; CRISPR-Cas9 screens; DNA damage response; JUN; PD-L1 regulation; SMARCAL1; cGAS-STING pathway; cancer immunotherapy; cancer-intrinsic innate immunity.


Conflict of interest statement

Declaration of interests EpiCypher is a commercial developer and supplier of reagents and platforms used in this study. All authors affiliated with EpiCypher own shares in (with M.-C.K. also a board member of) EpiCypher Inc. B.I. is a consultant for or received honoraria from Volastra Therapeutics, Johnson & Johnson/Janssen, Novartis, Eisai, AstraZeneca, and Merck and has received research funding to Columbia University from Agenus, Alkermes, Arcus Biosciences, Checkmate Pharmaceuticals, Compugen, Immunocore, and Synthekine. A. Califano is founder, equity holder, and consultant of DarwinHealth Inc., a company that has licensed some of the algorithms used in this manuscript from Columbia University. Columbia University is also an equity holder in DarwinHealth Inc.

Figures

Figure 1.
Figure 1.. FACS-based CRISPR-Cas9 genetic screens in MDA-MB-436 triple negative breast cancer cells
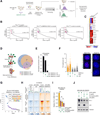
(A), Gene network targeted by sgRNA library 1. The size of nodes (genes) reflects the number of genetic and physical interactions (gray lines) between nodes, according to PrePPI. (B), Schematic of CRISPR screens to identify regulators of nuclear IRF3 and PD-L1. Following selection of MDA-MB-436 cells transduced with the lentiviral sgRNA library 1, cells were collected as a pool (unsorted), or sorted into three populations, as indicated. sgRNA abundance in distinct cell populations was determined by next-generation sequencing. (C-E), Distribution of normalized β-scores for genes targeted by sgRNA library 1 and ranked according to the abundance of their sgRNAs in the examined groups. The normalized β-scores for genes in the IRF3High/PD-L1Low (C), IRF3High/PD-L1High (D), and IRF3Low/PD-L1Low (E) populations were calculated with MAGeCK MLE using the unsorted population as a reference. Red and blue dots represent genes associated with enriched and depleted sgRNAs (positive or negative β-score and p-value <0.05), respectively.
Figure 2.
Figure 2.. Analysis of PD-L1 expression and cancer-intrinsic innate immunity upon SMARCAL1 deficiency
(A), Immunoblot showing SMARCAL1, PD-L1, and vinculin levels in MDA-MB-436 cells treated with the indicated siRNAs, and MDA-MB-436 control cells or SMARCAL1-KO clones. S.e., short exposure; l.e., long exposure. (B), Immunoblot showing SMARCAL1, phosphorylated IRF3 (pIRF3 S386), total IRF3, and tubulin or vinculin levels in the cell lines described in A. (C), Pathway activity within the indicated Hallmark gene sets (MSigDB) exhibited by SMARCAL1-depleted cells (Query 1) and SMARCAL1-KO clones (Query 2–4) relative to control MDA-MB-436 cells, as determined by VIPER. (D), Normalized enrichment scores (NES) for Hallmark gene sets (MSigDB) in SMARCAL1-KO clone #1 compared to control MDA-MB-436 cells. (E), Gene set enrichment analysis for SMARCAL1-KO clone #1 vs control MDA-MB-436 cells for the indicated Hallmark gene sets (MSigDB). (F), RT-qPCR analysis of mRNA levels of IFNA, IFNB1 or selected ISGs and pro-inflammatory cytokines in control and SMARCAL1-KO #1 MDA-MB-436 cells. Data represent the fold change of gene expression in SMARCAL1-KO #1 vs control cells. Columns represent the mean ± SEM of independent biological replicates (dots). P-values were calculated by multiple unpaired t test. (G), Cytokine antibody arrays showing cytokines expressed in control and SMARCAL1-KO #1 MDA-MB-436 cells. Reference and background signals are shown. (H), Cytokines levels normalized over reference signals in control and SMARCAL1-KO #1 MDA-MB-436 cells from the experiment in G. (I), Immunoblot showing SMARCAL1, phosphorylated STAT1 (pSTAT1 Y701), total STAT1, and tubulin levels in control and SMARCAL1-KO #1 MDA-MB-436 cells. (J), Volcano plot of RNA-seq analysis comparing SMARCAL1-KO #1 to control MDA-MB-436 cells (FDR <0.05). Red dots indicate genes with significantly increased expression in SMARCAL1-KO #1 vs control cells from the Hallmark gene sets in D. The CD274 (PD-L1) gene is indicated in blue. (K), RT-qPCR analysis of PD-L1 mRNA levels in MDA-MB-436 cells treated with the indicated siRNAs, and MDA-MB-436 control cells and SMARCAL1-KO clones. Expression data were analyzed and represented as in F. P-values were calculated by one-way ANOVA.
Figure 3.
Figure 3.. Analysis of cell-intrinsic immune signaling in SMARCAL1-deficient cells
(A), Images of DAPI and cGAS staining in MDA-MB-436 control cells and SMARCAL1-KO clones (left). The percentage of cells with one or more micronuclei (middle) and with cGAS-positive micronuclei (right) is shown. Columns represent mean ± SEM of independent biological replicates (dots). P-values were determined by one-way ANOVA. (B), Relative intracellular cGAMP levels in MDA-MB-436 control cells and SMARCAL1-KO clones. Graphical representation and statistical analysis were conducted as in A. (C), Immunoblot showing SMARCAL1, cGAS, phosphorylated IRF3 (pIRF3 S386), total IRF3, and tubulin levels in MDA-MB-436 cells, control and SMARCAL1-KO #1 cells treated with the indicated siRNAs. (D), RT-qPCR analysis of mRNA levels of selected ISGs and pro-inflammatory cytokines in control and SMARCAL1-KO #1 MDA-MB-436 cells treated with the indicated siRNAs. Data represent fold change of gene expression relative to control siRNA-treated cells. Graphical representation was conducted as in A. Statistical analysis was performed by multiple unpaired t test. (E), Schematic of SMARCAL1 and its mutants used in this study. (F), Percentage of cells with one or more micronuclei (left) or with cGAS-positive micronuclei (right) in SMARCAL1-deficient MDA-MB-436 cells reconstituted with SMARCAL1 WT or the indicated mutants. Graphical representation and statistical analysis were conducted as in A. (G), Intracellular cGAMP levels in SMARCAL1-deficient MDA-MB-436 cells reconstituted with the indicated SMARCAL1 mutants relative to WT. Graphical representation and statistical analysis were conducted as in A.
Figure 4.
Figure 4.. Regulation of PD-L1 expression by SMARCAL1
(A), Schematic of the assay to evaluate PD-L1 levels in replicating and non-replicating RPE1-hTERT TP53−/− or U2OS-Fucci cells treated with the indicated siRNAs. (B), Immunoblot showing SMARCAL1, PD-L1, and vinculin levels at day 7 in RPE1-hTERT TP53−/− cells cultured in either growth or starvation medium and treated with the indicated siRNAs at day 4, as in A. (C), RT-qPCR analysis of PD-L1 mRNA levels in RPE1-hTERT TP53−/− cells treated with the indicated siRNAs and cultured as in B. Data represent the fold change of PD-L1 expression relative to control cells (RPE1-hTERT TP53−/− cells treated with control siRNA and cultured in growth medium). Columns represent the mean ± SEM of technical replicates (dots) for two independent biological replicates. P-values were calculated by one-way ANOVA. (D), Heatmaps of IgG and SMARCAL1 signals aligned to H3K4me3 peaks identified by CUT&RUN in MDA-MB-436 cells. RPKM, reads per kilobase per million mapped reads. (E), Heatmaps of IgG, SMARCAL1, H3K4me3 and H3K27me3 CUT&RUN signals aligned within −2 kb of the transcription start site (TSS) and +2 kb of the transcription end site (TES) of 23,245 protein-coding genes (normalized for gene length) and ranked by H3K4me3 signal in MDA-MB-436 cells. (F), Number of common and unique ATAC-seq peaks between control and SMARCAL1-KO #1–2 MDA-MB-436 cells. Unique and common peaks represent peaks present in at least one biological replicate of a single dataset, or all datasets, respectively. (G), Normalized ATAC-seq tracks (counts per million) for the CD274 (PD-L1) locus in control and SMARCAL1-KO #1 MDA-MB-436 cells. Each track represents the merge of three independent biological replicates. Identified peaks (P1, 5450318–5450905; P2, 5455316–5455499; P3, 5459366–5459591) are highlighted. The H3K27ac ChIP-seq track for the PD-L1 locus in MDA-MB-436 cells was obtained from a publicly available dataset (GSE85158). (H), Schematic of CRISPRi assays targeting the P3 peak with dCas9-KRAB-MeCP2 (top). RT-qPCR analysis of PD-L1 and SMARCAL1 mRNA levels in MDA-MB-436 cells treated with the indicated siRNAs, and transfected with dCas9-KRAB-MeCP2 and the indicated sgRNAs (bottom). Data represent the fold change of gene expression in the indicated conditions relative to MDA-MB-436 cells treated with control siRNA and transfected with dCas9-KRAB-MeCP2 and a non-targeting sgRNA. Columns represent the mean ± SEM of independent biological replicates (dots). P-values were calculated by multiple unpaired t test. (I), Immunoblot showing SMARCAL1, PD-L1, and tubulin levels in MDA-MB-436 cells expressing dCas9-KRAB-MeCP2 (MDA-MB-436-CRISPRi), the indicated sgRNAs and treated with the indicated siRNAs. (J), ChIP-qPCR analysis of SMARCAL1-Flag and RNAPII (RNA polymerase II) occupancy in the genomic region of the P1 and P3 peaks or in the GAPDH promoter as control. Data are representative of three independent experiments and show the mean ± SEM of technical replicates. P-values were calculated by multiple unpaired t test. (K), Immunoblot showing SMARCAL1, PD-L1, and tubulin levels in MDA-MB-436 cells treated with SMARCAL1 siRNA and complemented with either WT or mutant SMARCAL1 cDNAs or a vector control.
Figure 5.
Figure 5.. Identification of transcription factors that cooperate with SMARCAL1 in promoting PD-L1 expression
(A), Schematic of CRISPR screens to identify transcription factors (TFs) that regulate SMARCAL1-dependent PD-L1 expression. Following selection of control or SMARCAL1-KO #1 MDA-MB-436 cells transduced with the sgRNA library 2, cells were collected as a pool (unsorted) or sorted as shown. sgRNA abundance in distinct cell populations was determined by next-generation sequencing. (B), Distribution of RRA scores for genes targeted by sgRNA library 2 ranked according to their positive selection score from the MAGeCK RRA output in the indicated comparisons. Pink dots represent genes associated with enriched sgRNAs (positive log fold change and p-value <0.05). (C), Heatmap showing the mean of PD-L1 mRNA levels from three biological replicates measured by RT-qPCR in control and SMARCAL1-KO #1 MDA-MB-436 cells transduced with the indicated sgRNAs. Clustering analysis was performed using Euclidian distance and Ward’s method. See Table S3. (D), Schematic of the BioID assay to identify SMARCAL1 interactors. Biotinylated proteins from MDA-MB-436 cells expressing BirA* alone or fused to WT or mutant SMARCAL1 proteins were captured by streptavidin pulldown and subjected to mass spectrometry (left). Numbers of proteins identified by mass spectrometry that are enriched in the indicated pulldowns relative to the BirA* control are shown (right). See Table S4. (E), Normalized enrichment of the intensity of JUN peptides obtained by mass spectrometry upon pulldown of biotinylated proteins from MDA-MB-436 cells expressing the indicated BirA* fusions. Data are presented as fold change in the intensity of JUN peptides from the indicated pulldowns relative to a BirA* control. (F), Number of PLA spots in MDA-MB-436 cells obtained using anti-SMARCAL1, anti-RPA and anti-JUN antibodies, either in combination or individually. Data were obtained from three independent biological replicates, with each dot representing PLA spots per cell. Median values are indicated. (G), P-value distribution for all motifs identified by de novo discovery motif analysis, using SMARCAL1-bound chromatin regions as input peaks for the Homer algorithm. The top three motifs are shown (#1, NFY-like; #2, G-rich, #3 AP-1/JUN-like). (H), Heatmaps of IgG and SMARCAL1 CUT&RUN signals aligned within −2 kb of the transcription start site (TSS) and +2 kb of the transcription end site (TES) of protein-coding genes in MDA-MB-436 cells, with or without JUN depletion (top heatmap panel). Heatmaps of IgG and SMARCAL1 signals aligned to H3K4me3 and JUN peaks in MDA-MB-436 cells, depleted or not of JUN, are also shown (bottom two panels). (I), RT-qPCR analysis of PD-L1 mRNA levels in MDA-MB-436 cells expressing dCas9-KRAB-MeCP2 (MDA-MB-436-CRISPRi) and the indicated sgRNAs. Data represent the fold change of gene expression in the indicated conditions relative to MDA-MB-436 cells expressing non-targeting and AAVS1 sgRNAs. Columns represent the mean ± SEM of independent biological replicates (dots). P-values were calculated by one-way ANOVA. (J), Immunoblot showing JUN, PD-L1, and tubulin levels in MDA-MB-436-CRISPRi cells expressing the indicated sgRNAs.
Figure 6.
Figure 6.. Analyses of anti-tumor immune responses against SMARCAL1-deficient cancer cells
(A), Analysis of tumor volume in C57BL/6 mice subcutaneously injected with B16/F10 Smarcal1-KO cells reconstituted with Smarcal1 cDNA or empty vector (EV). Graphs are representative of three independent experiments and show the mean ± SEM of individual mice per group. P-value was calculated by unpaired t test. (B), Survival analysis conducted on the C57BL/6 mice described in A. P-value was calculated by log-rank test. (C), Analysis of tumor volume in C57BL/6 mice subcutaneously injected with B16/F10 Smarcal1-KO cells reconstituted as in A with or without Cgas disruption. Graphs represents two independent experiments and show the mean ± SEM of individual mice per group. P-values were calculated as in A. (D), Survival analysis conducted on the C57BL/6 mice described in C. Experiments were conducted and analyzed as in B. (E), Number of tumor infiltrating lymphocytes in C57BL/6 mice injected with the B16/F10 Smarcal1-KO cells described in A. Each dot represents the number of infiltrating lymphocytes per gram in a single tumor. P-values were calculated by unpaired t test. (F), Analysis of tumor volume in C57BL/6 mice treated with isotype control or anti-mouse CD8α antibody before injection of the B16/F10 Smarcal1-KO cells described in A. Graphical representation and statistical analysis were performed as in A. See Figure S7F–G. (G), Survival analysis conducted on the C57BL/6 mice described in F. Experiments and statistical analysis were conducted as in B. (H), Representative images from (NLS)-dsRed-MDA-MB-436 control and SMARCAL1-KO #1 cells transduced with PD-L1 cDNA (pHAGE_PD-L1) or empty vector (pHAGE_EV) and incubated for forty-eight hours (T2) with or without human CD8+ T cells. See Figure S8D. (I), Quantification of the growth of the tumor cells described in H at T2 post-incubation with activated CD8+ T cells. Bar graphs represent the proliferation rate of (NLS)-dsRed-MDA-MB-436 control and SMARCAL1-KO #1 cells transduced with the indicated constructs in the presence of CD8+ T cells relative to their proliferation rate in the absence of CD8+ T cells. Columns represent the mean ± SD of three replicates. P-values were calculated by two-way ANOVA.
Figure 7.
Figure 7.. Effects of immune checkpoint blockade in mice carrying Smarcal1-deficient tumors and analysis of the clinical outcome of cancer patients with low SMARCAL1 expression
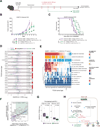
(A), Schematic of ICB treatments in mice injected with B16/F10 Smarcal1-KO cells reconstituted with Smarcal1 cDNA or empty vector (EV). (B), Analysis of tumor volume in C57BL/6 mice subcutaneously injected with B16/F10 Smarcal1-KO cells reconstituted as in A, and subsequently treated with isotype control or anti-mouse CTLA-4 plus anti-mouse PD-L1 antibodies. Data represent the mean ± SEM of individual mice per group. P-values were calculated by multiple unpaired t test. (C), Survival analysis conducted on the C57BL/6 mice described in B. P-values were calculated by log-rank test. (D), Analysis of SMARCAL1 expression in tumors and their respective normal tissues from TCGA patients with the indicated cancer types. P-values were calculated by unequal variance t test. CPM, counts per million. (E), Tumor-context specific differential analysis of SMARCAL1Low vs SMARCAL1High cancer patients for the indicated Hallmark gene sets (MSigDB), PD-L1 expression and leukocyte score ratio. (F), Pearson correlation between the normalized enrichment score (NES) of inflammatory response pathway and the leukocyte score ratio for the indicated TCGA tumor types. (G), SMARCAL1 levels prior to treatment with anti-PD-1 checkpoint inhibitors in non-responder and responder groups of patients from the referenced datasets. P-values were calculated by unequal variance t test. FPKM, fragments per kilobase of transcript per million mapped reads. (H), Proposed model for the dual role of SMARCAL1 in regulating the response of tumors to host immunity and PD-L1-mediated immune checkpoint.

References

    1. Del Poggetto E, Ho IL, Balestrieri C, Yen EY, Zhang S, Citron F, Shah R, Corti D, Diaferia GR, Li CY, et al. (2021). Epithelial memory of inflammation limits tissue damage while promoting pancreatic tumorigenesis. Science 373, eabj0486. 10.1126/science.abj0486. - DOI - PMC - PubMed
    1. Martin TD, Patel RS, Cook DR, Choi MY, Patil A, Liang AC, Li MZ, Haigis KM, and Elledge SJ (2021). The adaptive immune system is a major driver of selection for tumor suppressor gene inactivation. Science 373, 1327–1335. 10.1126/science.abg5784. - DOI - PubMed
    1. Leach DR, Krummel MF, and Allison JP (1996). Enhancement of antitumor immunity by CTLA-4 blockade. Science 271, 1734–1736. 10.1126/science.271.5256.1734. - DOI - PubMed
    1. Dong H, Zhu G, Tamada K, and Chen L (1999). B7-H1, a third member of the B7 family, co-stimulates T-cell proliferation and interleukin-10 secretion. Nat Med 5, 1365–1369. 10.1038/70932. - DOI - PubMed
    1. Freeman GJ, Long AJ, Iwai Y, Bourque K, Chernova T, Nishimura H, Fitz LJ, Malenkovich N, Okazaki T, Byrne MC, et al. (2000). Engagement of the PD-1 immunoinhibitory receptor by a novel B7 family member leads to negative regulation of lymphocyte activation. J Exp Med 192, 1027–1034. 10.1084/jem.192.7.1027. - DOI - PMC - PubMed