. 2024 Feb 13;57(2):379-399.e18.
doi: 10.1016/j.immuni.2024.01.006. Epub 2024 Jan 31.

An atlas of cells in the human tonsil

Affiliations

An atlas of cells in the human tonsil

Ramon Massoni-Badosa et al. Immunity. .

Abstract

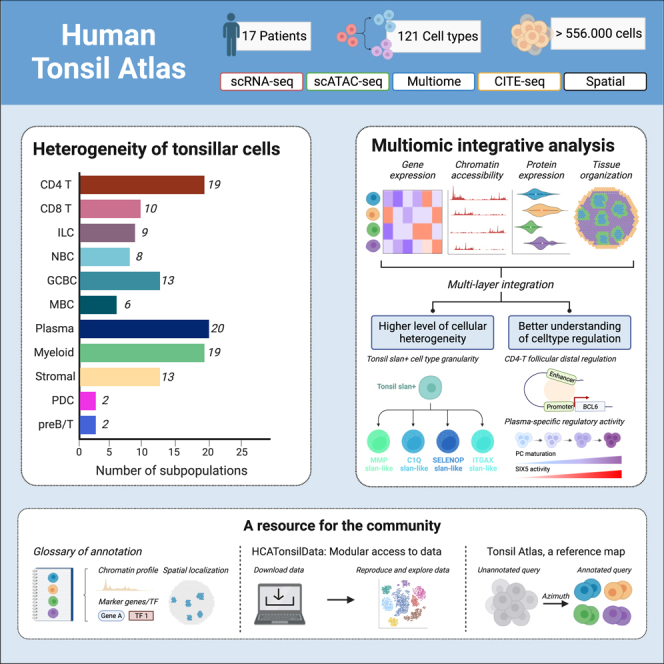
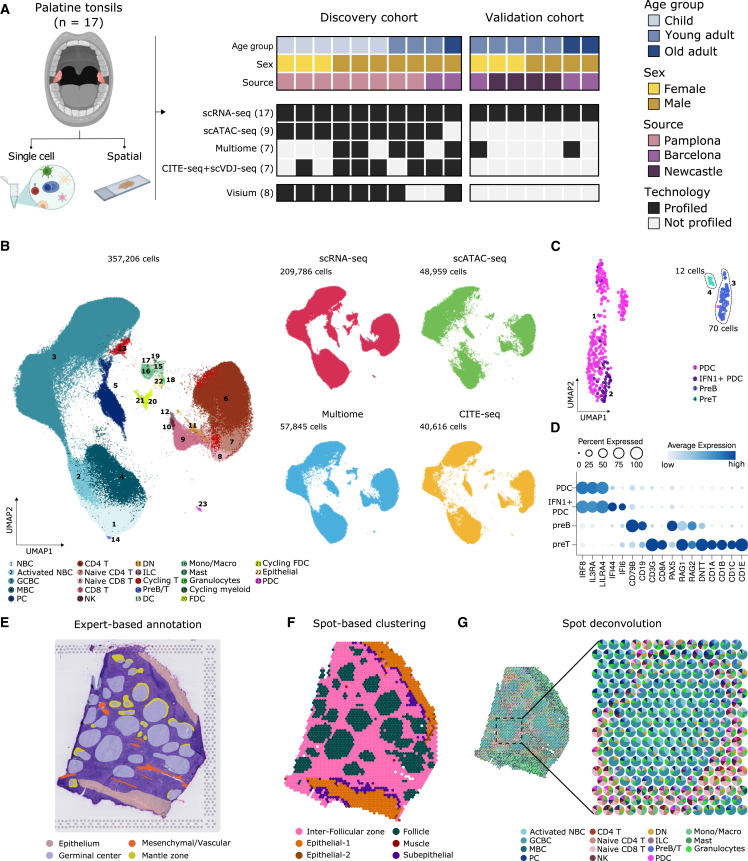
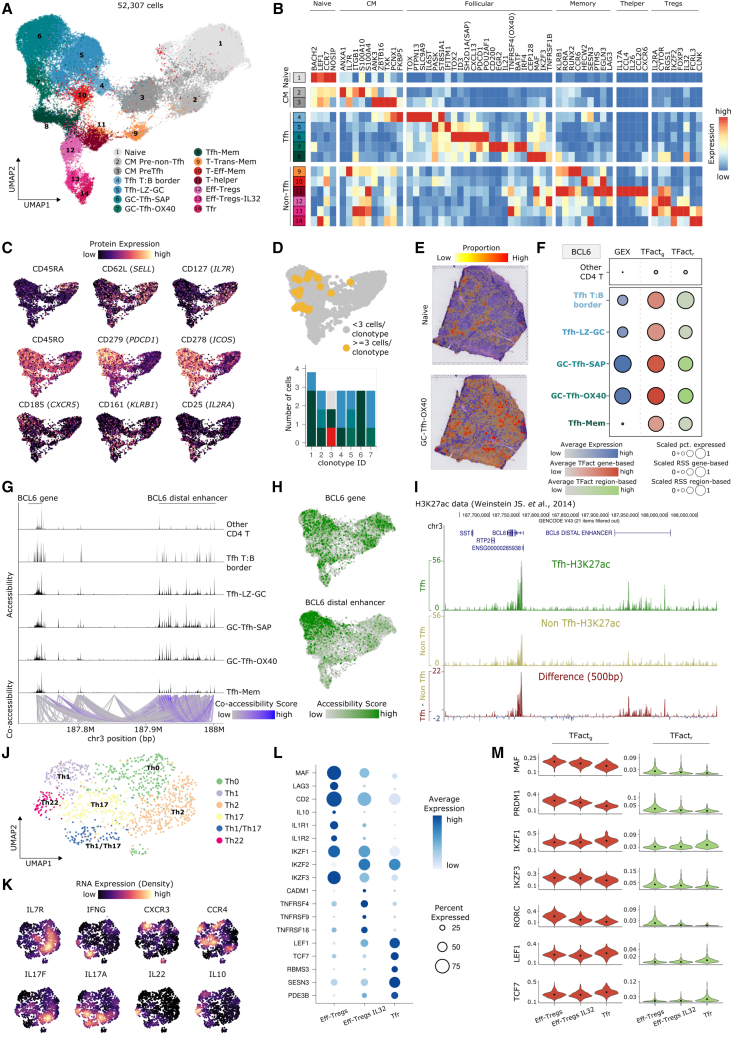
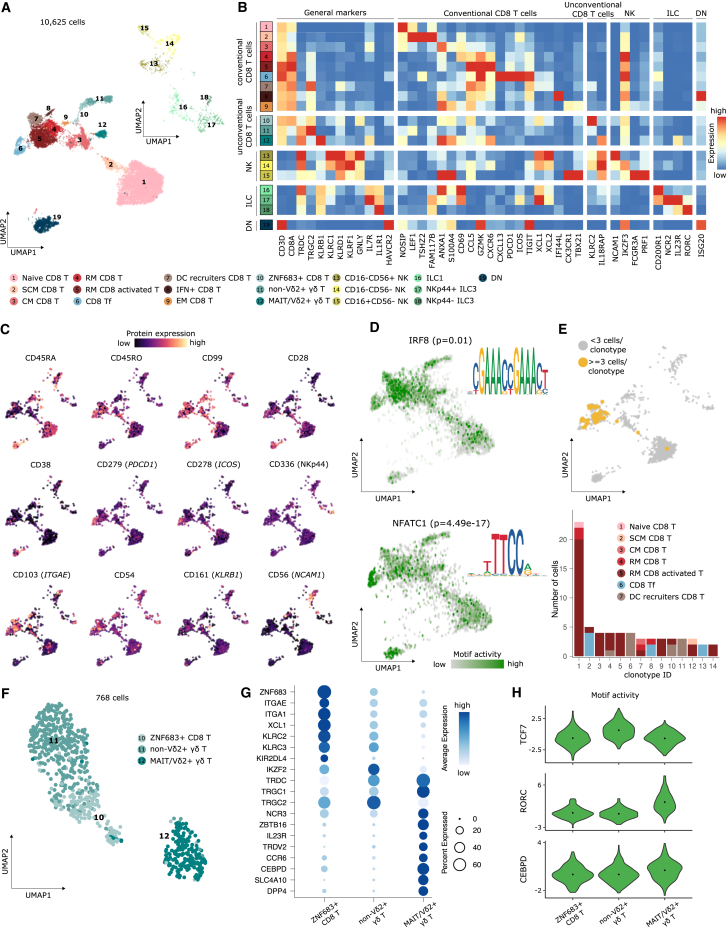
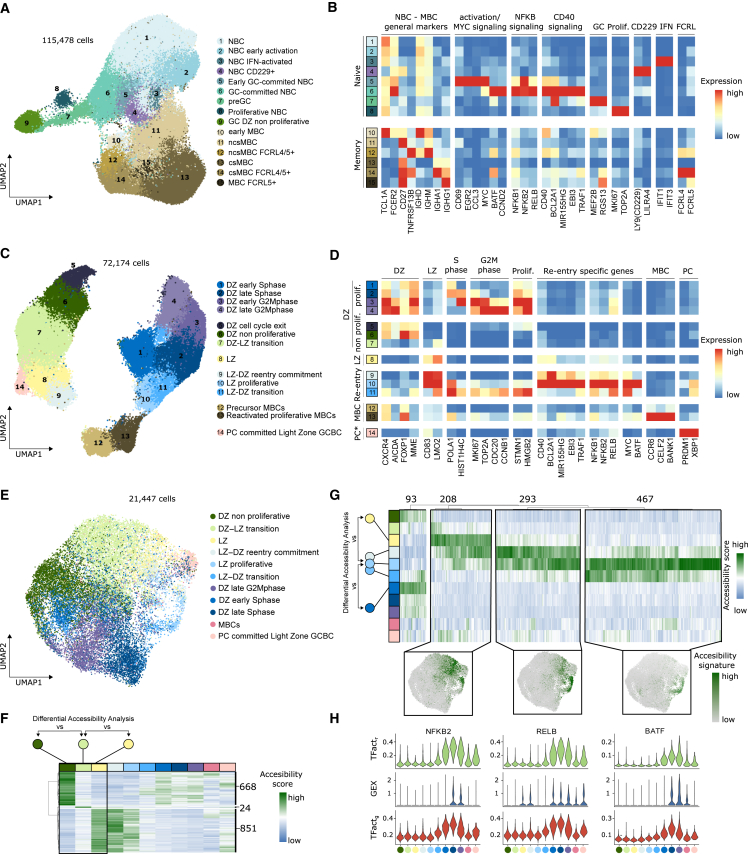
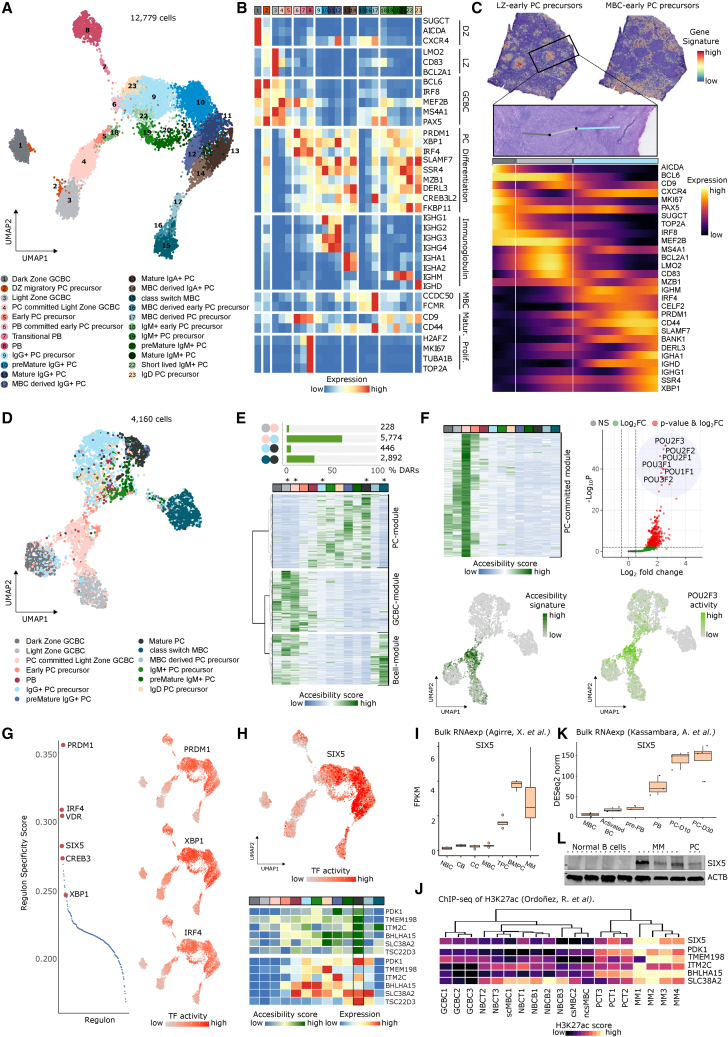
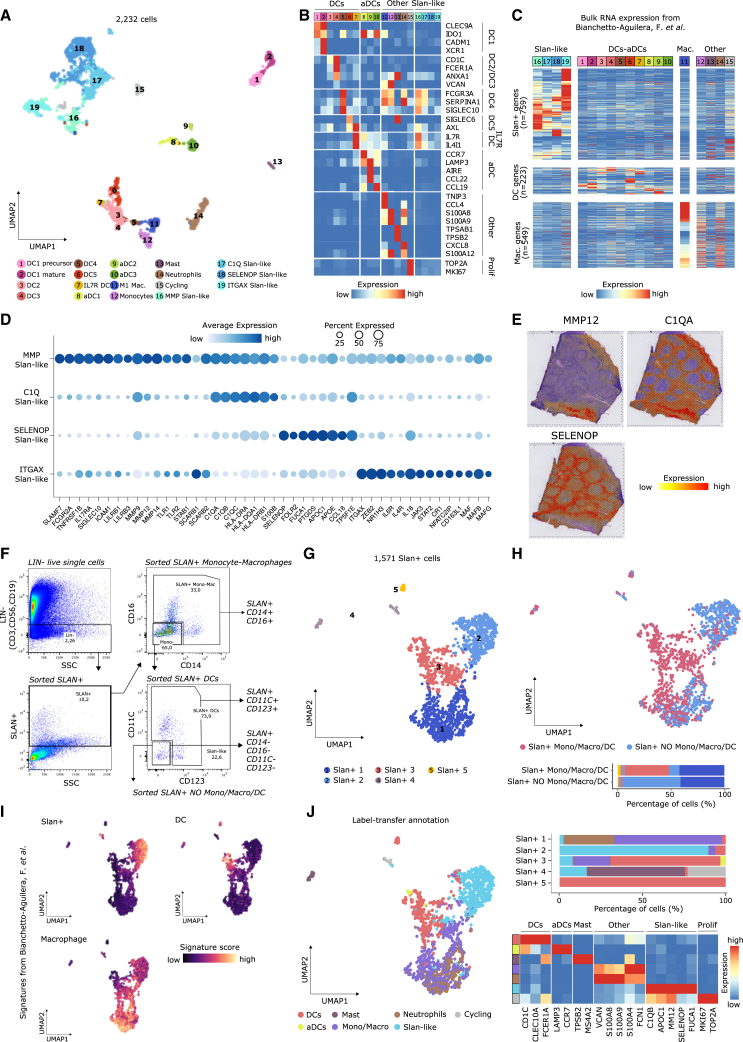
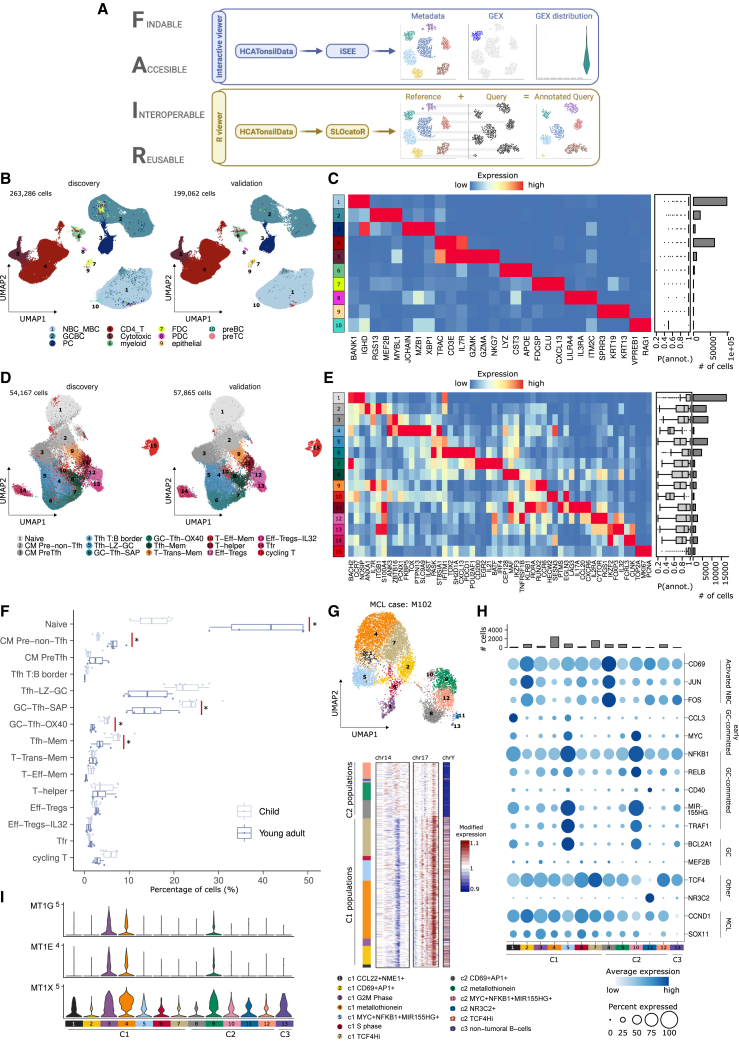
Palatine tonsils are secondary lymphoid organs (SLOs) representing the first line of immunological defense against inhaled or ingested pathogens. We generated an atlas of the human tonsil composed of >556,000 cells profiled across five different data modalities, including single-cell transcriptome, epigenome, proteome, and immune repertoire sequencing, as well as spatial transcriptomics. This census identified 121 cell types and states, defined developmental trajectories, and enabled an understanding of the functional units of the tonsil. Exemplarily, we stratified myeloid slan-like subtypes, established a BCL6 enhancer as locally active in follicle-associated T and B cells, and identified SIX5 as putative transcriptional regulator of plasma cell maturation. Analyses of a validation cohort confirmed the presence, annotation, and markers of tonsillar cell types and provided evidence of age-related compositional shifts. We demonstrate the value of this resource by annotating cells from B cell-derived mantle cell lymphomas, linking transcriptional heterogeneity to normal B cell differentiation states of the human tonsil.

Keywords: Human Cell Atlas; adaptive immunity; aging; human tonsil; innate immunity; mantle cell lymphoma; secondary lymphoid organs; single-cell genomics; spatial transcriptomics.


Conflict of interest statement

Declaration of interests H.H. is co-founder of Omniscope, SAB member of Nanostring and MiRXES, and consultant to Moderna and Singularity. J.C.N. is consultant to Omniscope.

Figures

None
Graphical abstract
Figure 1
Figure 1
A single-cell multiomic atlas of human tonsillar cells (A) Schematic diagram of the multiomic approach in both the discovery and validation cohorts. (B) Uniform manifold approximation and projection (UMAP) of the 357,206 tonsillar cells analyzed. Left: colored and numbered by the main 23 populations. Right: split by data modality. (C) UMAP of tonsillar plasmacytoid dendritic cells (PDCs) and precursor B and T cells (preB/preT clusters). (D) Dotplot showing average gene expression of marker genes of PDC, preB, and preT clusters. (E) Representative histologically annotated slide of a human tonsil. (F) Gene expression-based clusters of spatial transcriptomics (ST) spots. (G) Spatial scatter pie plot showing each ST spot as a pie chart representing the predicted proportion of cell types.
Figure 2
Figure 2
CD4 T follicular and non-follicular cell fate decision in the human tonsil (A) UMAP of tonsillar CD4 T cells colored and numbered by scRNA-seq clusters. (B) Heatmap showing scaled mean marker expression by subpopulation. (C) UMAPs colored by protein expression of canonical phenotype markers of CD4 T cells. (D) Clonal expansion and diversity analysis in CD4 T cells. Top: UMAP showing clonal expansion denoted by ≥3 cells having identical complementarity determining region (CDR)3 sequence (yellow). Bottom: barplot of CD4 T cell subpopulations distribution across the top seven most expanded clonotypes. Color code as in UMAP in (A). (E) Predicted proportions of CD4 T subpopulations. (F) Dotplot showing BCL6 gene expression (blue) and TF activity gene-based (red) and region-based (green). (G) Accessibility and co-accessible links at the BCL6 locus across Tfh subsets and other CD4 T cells combined. (H) UMAP showing the accessibility score of BCL6 gene (gene body + 2 kb upstream) (top) and the distal enhancer (bottom). (I) Visualization of H3K27ac signal in BCL6 and the BCL6 distal enhancer. Signal represents absolute values for Tfh (top) and non-Tfh cells (bottom). (J) UMAP of tonsillar Th cells colored by the six scRNA-seq clusters. (K) UMAPs highlighting the estimated expression for key interleukin and chemokine receptors. (L) Dotplot showing expression for the top 18 genes of Treg subpopulations. (M) Violin plots showing gene-based (red) and region-based (green) eRegulon activity for the top TF in Eff-Tregs, Eff-Tregs-IL-32, and Tfr.
Figure 3
Figure 3
Landscape of CD8 and ILCs in the human tonsil (A) UMAP of tonsillar CD8 T cells (bottom) and ILC (top) colored and numbered by scRNA-seq clusters. (B) Heatmap showing scaled mean marker expression per subpopulation. (C) UMAPs highlighting the protein expression of canonical phenotype markers of CD8 T and ILC. (D) UMAP highlighting the motif activity of IRF8 and NFATC1. The p value represents the significance of the pairwise differential motif analysis performed for each TF. DNA sequence motifs’ logos for each TF. (E) Clonal expansion and diversity analysis in CD8 T cells. Top: UMAP showing clonal expansion denoted by ≥3 cells having identical CDR3 sequence (yellow). Bottom: barplot of CD8 T cell subpopulations distribution across the top 14 most expanded clonotypes. (F) UMAP of tonsillar unconventional CD8 T cells colored and numbered by scRNA-seq clusters. (G) Dotplot showing expression for the top 19 genes for unconventional CD8 T cells. (H) Violin plots of the motif activity score for the top three TF motifs in unconventional CD8 T subpopulations.
Figure 4
Figure 4
B cell activation and GC dynamics (A) UMAP of tonsillar NBC and MBC B cells colored and numbered by scRNA-seq clusters (including GC DZ non-proliferative, C). (B) Heatmap showing scaled mean marker expression per NBC and MBC subpopulations. (C) UMAP of tonsillar GCBCs colored and numbered by scRNA-seq clusters. (D) Heatmap showing scaled mean marker expression per GCBC subpopulations (including PC-committed light zone GCBC, Figure 5A). (E) UMAP of GCBC colored by scATAC-seq clusters. (F) Heatmap showing normalized accessibility scores of the DARs in the DZ-to-LZ transition (DZ no proliferative → DZ-LZ transition → LZ). Numbers of DARs indicated. (G) Top: heatmap showing normalized accessibility score of the DARs in the LZ-to-DZ reentry (LZ → LZ-DZ reentry commitment → LZ-proliferative → LZ-DZ transition → DZ early S phase). Numbers of DARs indicated. Bottom: UMAP highlighting the accessibility signature scores for each of the main clusters. (H) Violin plots showing gene expression (blue) and gene-based (red) and region-based (green) eRegulon activity for the top TF enriched in each of the clusters (G).
Figure 5
Figure 5
Plasma cell differentiation and cell identity regulation in human tonsils (A) UMAP of tonsillar plasma cells (PCs) colored and numbered by scRNA-seq clusters. (B) Heatmap showing scaled mean marker expression per PC subpopulation. (C) Top: transcriptomics-based tissue localization of LZ-derived early PC precursor (left) and MBC-derived early PC precursor (right), using the top 25 marker genes for each population. Middle: DZ (dark gray) to LZ (light gray) to subepithelial-PC-rich zone (light blue) trajectory on an H&E image from the highlighted area. Bottom: heatmap showing smoothed expression changes through the pre-defined trajectory. (D) UMAP of PC colored by scATAC-seq clusters. (E) Top: proportion of pairwise differentially accessible regions (DARs) between LZ, PC-committed, IgG PC precursor, mature PC, and csMBC. Bottom: clustered heatmap representation of the normalized accessibility score from the 9,340 DARs of the 3 main modules. (F) PC-committed module analysis. Left: heatmap showing normalized accessibility score of the 654 DARs and UMAP of their combined accessibility signature. Right: motif enrichment analysis of the 654 DARs (p cutoff: 0.001, FC cutoff: 0.5) and UMAP of top motif (POU2F3) activity (fold-enrichment: 2.57, p < 0.001). (G) Left: regulon specificity score for the PC subpopulation. Right: UMAP highlighting the activity (AUCell score) of PRDM1, XBP1, and IRF4 TFs. (H) Top: UMAP highlighting the activity (AUCell score) of SIX5. Bottom: heatmap showing scaled mean accessibility and gene expression for SIX5 targets. (I) Boxplot of fragments per kilobase per million fragments mapped (FPKM) values for SIX5 (NBC, naive B cell; CB, centroblast; CC, centrocyte; MBC, memory B cell; TPC, tonsillar plasma cell; BMPC, bone marrow plasma cell; MM, multiple myeloma). (J) Heatmap showing normalized mean H3K27ac signal for SIX5 and its targets (NBCT, tonsillar NBC; NBCB, NBC from peripheral blood; csMBC, class-switch MBC; ncsMBC, non-class switch MBC). (K) Boxplot of SIX5 expression during B cell maturation (BC, B cell; PB, plasmablast; PC-D10/30, in vitro generated PC at day 10/30). (L) Western blot showing SIX5 protein levels in normal B cells (CD19+ cells from three PBMC donors), multiple myeloma cell lines (XG6, XG21, and KMS11), and in vitro differentiated PC.
Figure 6
Figure 6
Myeloid cell heterogeneity in human tonsils (A) UMAP of tonsillar myeloid cells colored and numbered by scRNA-seq clusters. (B) Heatmap showing scaled mean marker expression per myeloid subpopulation. (C) Heatmap showing scaled mean expression of slan+, DC, and macrophage differentially expressed genes. (D) Dotplot showing expression of the top marker genes per slan-like subpopulation. (E) Denoised expression of genes identifying slan-like populations on an ST slide. (F) FACS isolation strategy of slan+ myeloid cells. (G) UMAP of sorted slan+ cells colored and numbered by scRNA-seq clusters. (H) Top: UMAP of sorted slan+ cells colored by sorting gate. Bottom: barplot showing cluster frequencies across sorting gates. (I) UMAPs colored by slan+, DC, and macrophage signatures (C). (J) Left: UMAP of sorted slan+ cells after label transfer from myeloid subpopulation (A). Right, top: barplot showing label-transferred subpopulation frequencies across the five slan+ clusters (G). Bottom, right: heatmap showing scaled mean marker expression per label-transferred subpopulation.
Figure 7
Figure 7
Dissemination and application of the tonsil atlas (A) Schematic representation showing the computational framework to access and reuse the tonsil atlas dataset. (B and D) UMAP of all cells (B) and CD4 T cells (D) of the reference and query (validation cohort) annotated with SLOcatoR. (C and E) Heatmap showing scaled mean marker expression of level 1 clusters (C) and CD4 T subclusters (E) for the validation cohort. Boxplots represent the annotation confidence for each cluster, and barplots represent the number of cells for that cluster in the validation cohort. (F) Boxplot showing the percentage of CD4 T subclusters across child and young adult subgroups (inclusion criteria: scRNA-seq, fresh samples, tonsillitis). Asterisks indicate significant changes (scCODA, false discovery rate [FDR] = 0.1). (G) Top: UMAP of MCL cells from case M102 colored and numbered by scRNA-seq clusters. Bottom: inferCNV result using c3 non-tumoral B cells as reference (showing chromosomes with large copy-number changes). (H) Top: barplot showing total number of cells per M102 scRNA-seq clusters. Bottom: dotplot showing the average expression of normal and neoplastic B cell markers across M102 scRNA-seq clusters. (I) Violinplot showing the expression of metallothionein genes across annotated clusters of case M102.

References

    1. Ruddle N.H., Akirav E.M. Secondary Lymphoid Organs: Responding to Genetic and Environmental Cues in Ontogeny and the Immune Response. J. Immunol. 2009;183:2205–2212. - PMC - PubMed
    1. Nave H., Gebert A., Pabst R. Morphology and immunology of the human palatine tonsil. Anat. Embryol. (Berl.) 2001;204:367–373. - PubMed
    1. De Silva N.S., Klein U. Dynamics of B cells in germinal centres. Nat. Rev. Immunol. 2015;15:137–148. - PMC - PubMed
    1. Park J.-E., Botting R.A., Domínguez Conde C., Popescu D.-M., Lavaert M., Kunz D.J., Goh I., Stephenson E., Ragazzini R., Tuck E., et al. A cell atlas of human thymic development defines T cell repertoire formation. Science. 2020;367 - PMC - PubMed
    1. Baccin C., Al-Sabah J., Velten L., Helbling P.M., Grünschläger F., Hernández-Malmierca P., Nombela-Arrieta C., Steinmetz L.M., Trumpp A., Haas S. Combined single-cell and spatial transcriptomics reveal the molecular, cellular and spatial bone marrow niche organization. Nat. Cell Biol. 2020;22:38–48. - PMC - PubMed

Publication types