. 2024 Mar 18;30(4):418-434.
doi: 10.1261/rna.079897.123.

T helper cells exhibit a dynamic and reversible 3'-UTR landscape

Affiliations

T helper cells exhibit a dynamic and reversible 3'-UTR landscape

Denis Seyres et al. RNA. .

Abstract

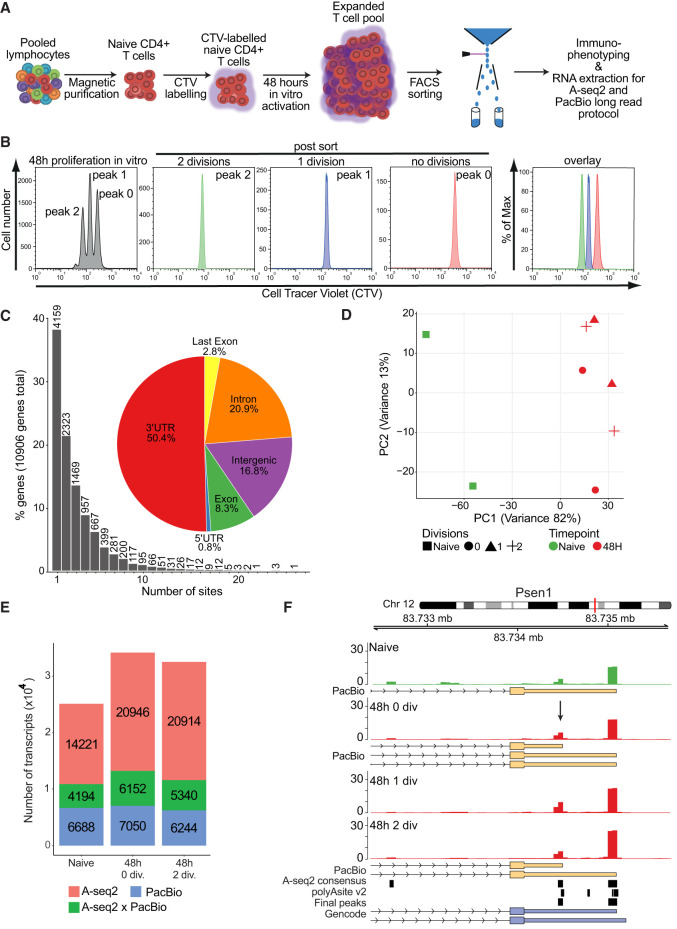
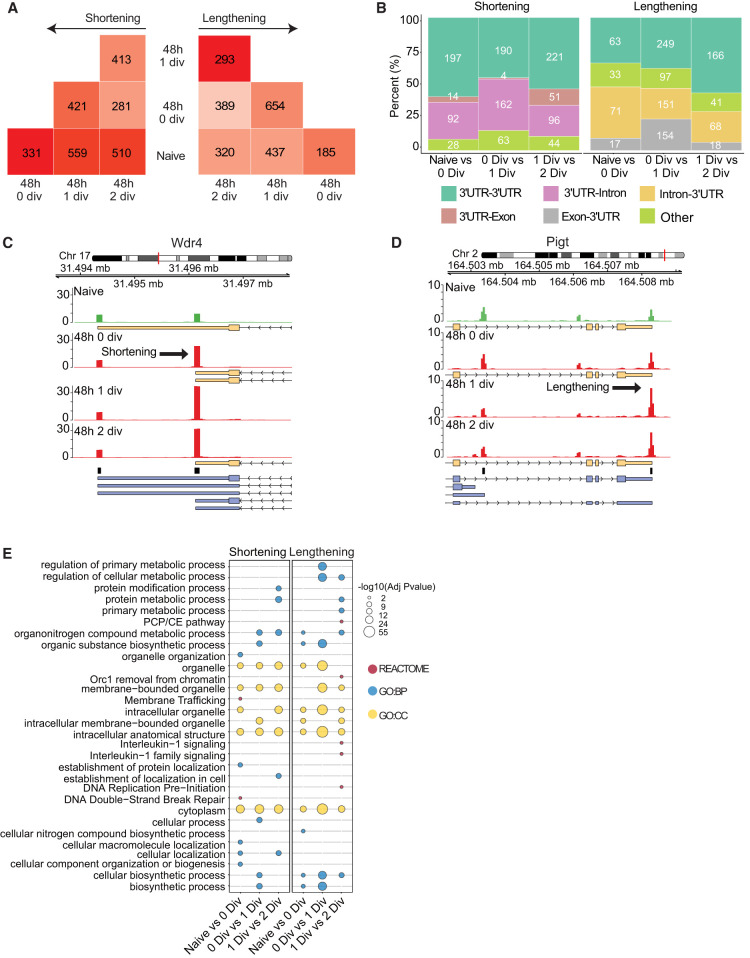
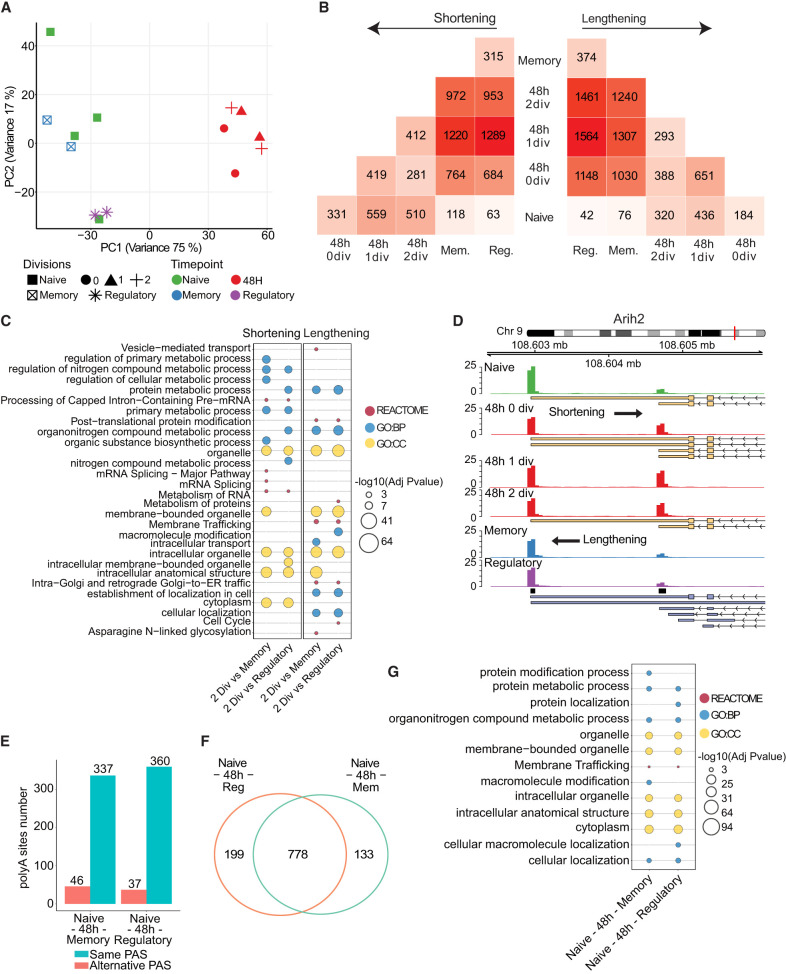
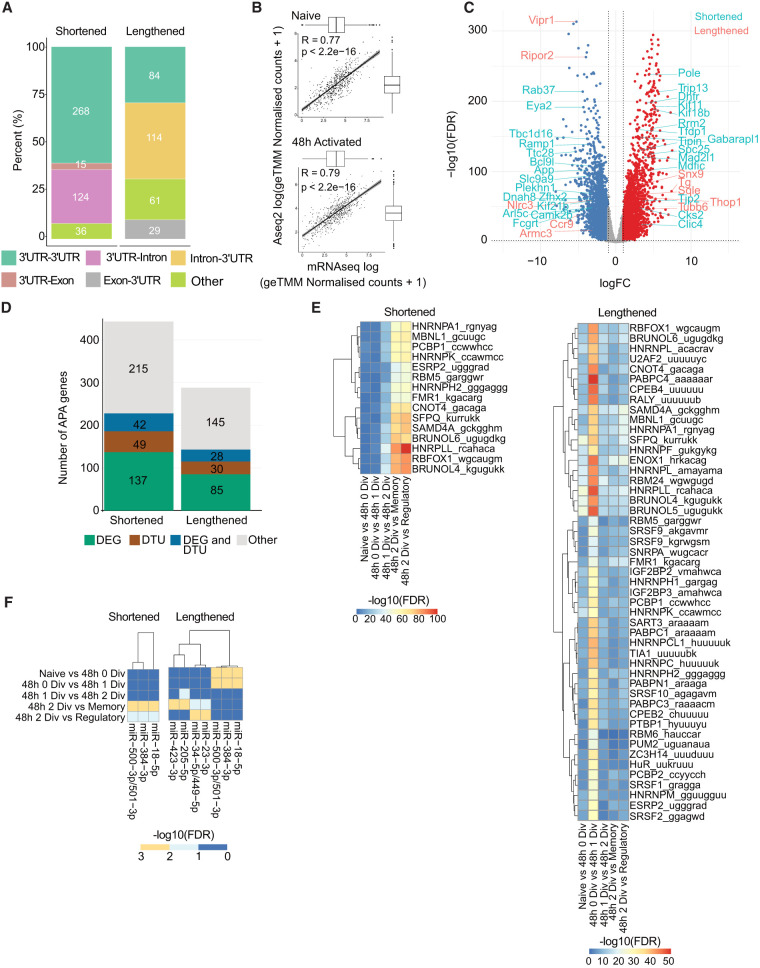
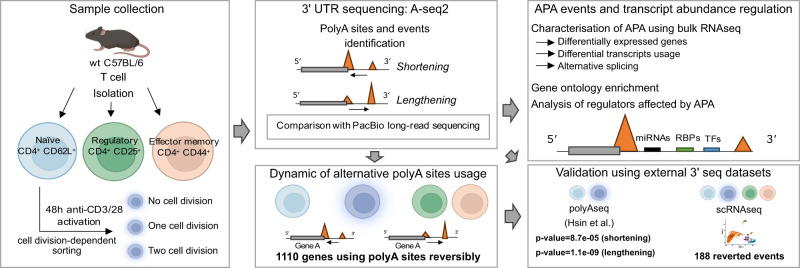
3' untranslated regions (3' UTRs) are critical elements of messenger RNAs, as they contain binding sites for RNA-binding proteins (RBPs) and microRNAs that affect various aspects of the RNA life cycle including transcript stability and cellular localization. In response to T cell receptor activation, T cells undergo massive expansion during the effector phase of the immune response and dynamically modify their 3' UTRs. Whether this serves to directly regulate the abundance of specific mRNAs or is a secondary effect of proliferation remains unclear. To study 3'-UTR dynamics in T helper cells, we investigated division-dependent alternative polyadenylation (APA). In addition, we generated 3' end UTR sequencing data from naive, activated, memory, and regulatory CD4+ T cells. 3'-UTR length changes were estimated using a nonnegative matrix factorization approach and were compared with those inferred from long-read PacBio sequencing. We found that APA events were transient and reverted after effector phase expansion. Using an orthogonal bulk RNA-seq data set, we did not find evidence of APA association with differential gene expression or transcript usage, indicating that APA has only a marginal effect on transcript abundance. 3'-UTR sequence analysis revealed conserved binding sites for T cell-relevant microRNAs and RBPs in the alternative 3' UTRs. These results indicate that poly(A) site usage could play an important role in the control of cell fate decisions and homeostasis.

Keywords: 3′-UTR usage; T helper cells; alternative polyadenylation; effector/memory T cells; naive T cells; posttranscriptional regulation; proliferation.


Figures

FIGURE 1.
FIGURE 1.
Analysis of division-dependent global 3′-UTR changes in murine CD4+ T cells. (A) Schematic workflow of T cell-labeling, activation, and sorting. (B) Representative CTV-labeling profile of CD4+ T cells after in vitro activation for 48 h and typical results for sorted peaks of undivided T cells (peak 0), and T cells which are divided once (peak 1) and twice (peak 2). The right panel shows an overlay of all populations after FACS sorting. (C) Barplot representing the distribution of APA sites per gene. Pie plot shows the genomic localization distribution of APA sites. (D) PCA resulting from read coverage over the final peak set. (E) Stacked barplot summarizing 3′ UTRs identified by A-seq2 only (red), PacBio only (blue), or both A-seq2 and PacBio (green). (F) Example of Psen1 (chr12:83,732,374–83,735,700, “+”) gene 3′-UTR region. Overlap of A-seq2 peaks (consensus) and PolyASite database is labeled as the “Final peaks” track. A-seq2 signal of the different sorted cell populations is represented. Yellow boxes represent isoforms identified using PacBio long-read sequencing (arrows indicate newly identified isoforms), blue boxes represent Gencode (v25) isoforms, and black boxes indicate PAS.
FIGURE 2.
FIGURE 2.
Identification of alternative poly(A) site usage. (A) Number of shortening and lengthening events identified in each comparison. Dark color indicates higher numbers, light color indicates lower numbers. (B) Classification of APA events per type of transition. (C,D) Example of Wdr4 gene (chr17:31,493,503–31,497,899, “−”), whose shortened transcripts are more abundant upon activation, and Pigt gene (chr2:164,502,304–164,508,853, “+”), whose longer transcripts are more abundant upon activation. Arrow indicates the event direction. Yellow boxes represent isoforms identified using PacBio long-read sequencing, blue boxes represent Gencode (v25) isoforms, and black boxes indicate PAS. (E) Functional annotations of genes associated with an APA event. Dot colors indicate source types. Dot size represents −log10(adjusted P-values).
FIGURE 3.
FIGURE 3.
Dynamic of alternative poly(A) site usage. (A) PCA resulting from A-seq2 read coverage over the final peak set using naive, all 48 h activated, memory, and regulatory T cells. (B) Number of shortening and lengthening events identified in each comparison. Dark color indicates higher numbers, light color indicates lower numbers. (C) Functional annotations of genes associated to an APA event between activated two divisions and either memory or regulatory states. (D) Example of 3′-UTR Arih2 gene (chr9:108,602,316–108,606,119, “−”) showing reverted length during activation and effector stages. (E) Concordance of APA sites’ usage in genes associated with a reverting event. (F) Venn diagram showing overlap of genes presenting a reverting pattern. (G) Functional annotations of genes associated with a reverted APA event.
FIGURE 4.
FIGURE 4.
APA events and transcript abundance regulation. (A) Classification of APA events per type of transition. (B) Pearson correlation of mRNA-seq (Dölz et al. 2022) and A-seq2 gene coverage at naive (left) and 48 h after activation (right). Reported values are log-transformed normalized counts + 1. Boxplots indicate value distribution and their mean. (C) Volcano plot resulting from mRNA differential analysis (Dölz et al. 2022). Blue and red dots indicate genes with FDR < 0.01 and absolute logFC > 1. APA genes that are also DEG are indicated: light blue indicates shortening event and red, lengthening event. (D) Barplot reporting number of APA genes is also differentially expressed (DEG), having a DTU of both or none. (E,F) Heatmaps show enrichment for miRNA (E) and RBP (F) binding sites within alternative 3′ UTR by type of event, shortening or lengthening. Color legend indicates −log10 (FDR).
FIGURE 5.
FIGURE 5.
Graphical overview of the analysis.
Denis Seyres
Denis Seyres
Oliver Gorka
Oliver Gorka

Similar articles

Cited by

References

    1. Agarwal V, Bell GW, Nam J-W, Bartel DP. 2015. Predicting effective microRNA target sites in mammalian mRNAs. Elife 4: e05005. 10.7554/eLife.05005 - DOI - PMC - PubMed
    1. Alexandrov A, Martzen MR, Phizicky EM. 2002. Two proteins that form a complex are required for 7-methylguanosine modification of yeast tRNA. RNA 8: 1253–1266. 10.1017/S1355838202024019 - DOI - PMC - PubMed
    1. Andreatta M, Berenstein AJ, Carmona SJ. 2022. scGate: marker-based purification of cell types from heterogeneous single-cell RNA-seq datasets. Bioinformatics 38: 2642–2644. 10.1093/bioinformatics/btac141 - DOI - PMC - PubMed
    1. Bartel DP. 2018. Metazoan microRNAs. Cell 173: 20–51. 10.1016/j.cell.2018.03.006 - DOI - PMC - PubMed
    1. Berkovits BD, Mayr C. 2015. Alternative 3′ UTRs act as scaffolds to regulate membrane protein localization. Nature 522: 363–367. 10.1038/nature14321 - DOI - PMC - PubMed