. 2024 Feb 1;15(1):458.
doi: 10.1038/s41467-023-44579-z.

Neuronal DSCAM regulates the peri-synaptic localization of GLAST in Bergmann glia for functional synapse formation

Affiliations

Neuronal DSCAM regulates the peri-synaptic localization of GLAST in Bergmann glia for functional synapse formation

Ken-Ichi Dewa et al. Nat Commun. .

Abstract

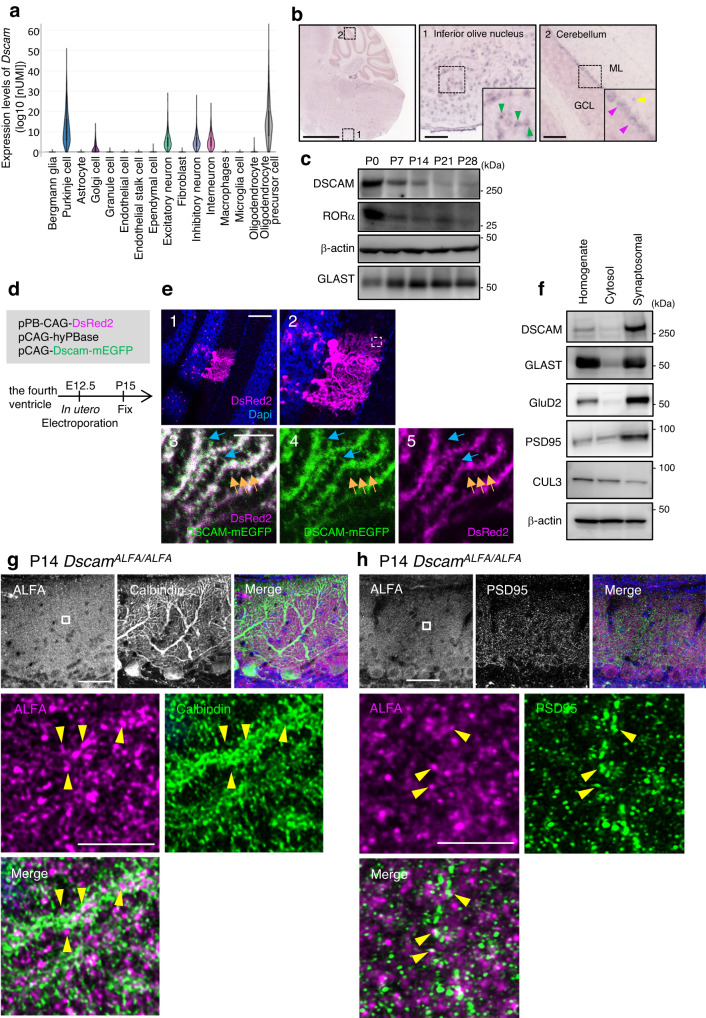
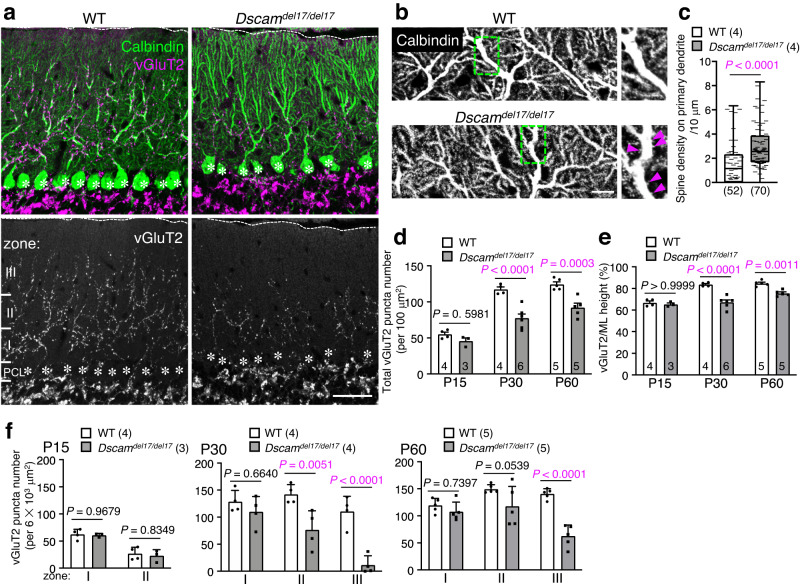
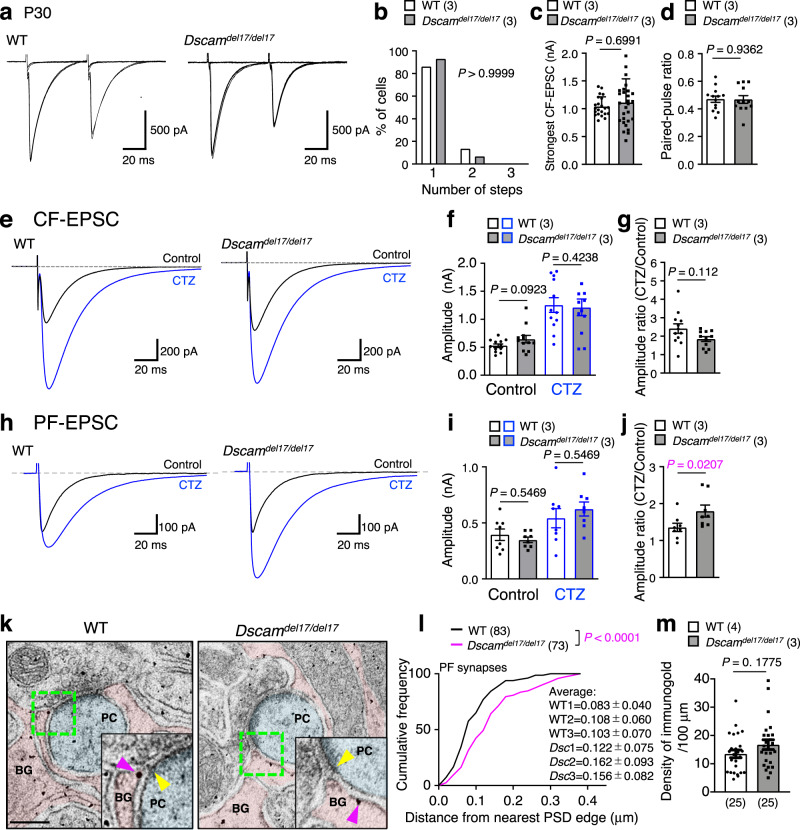
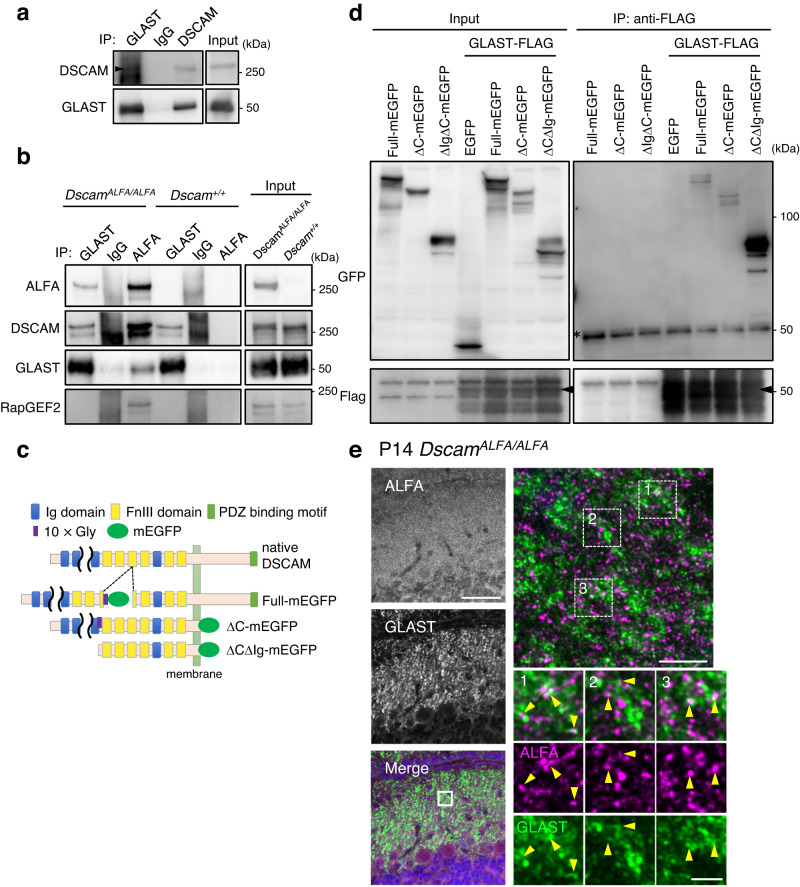
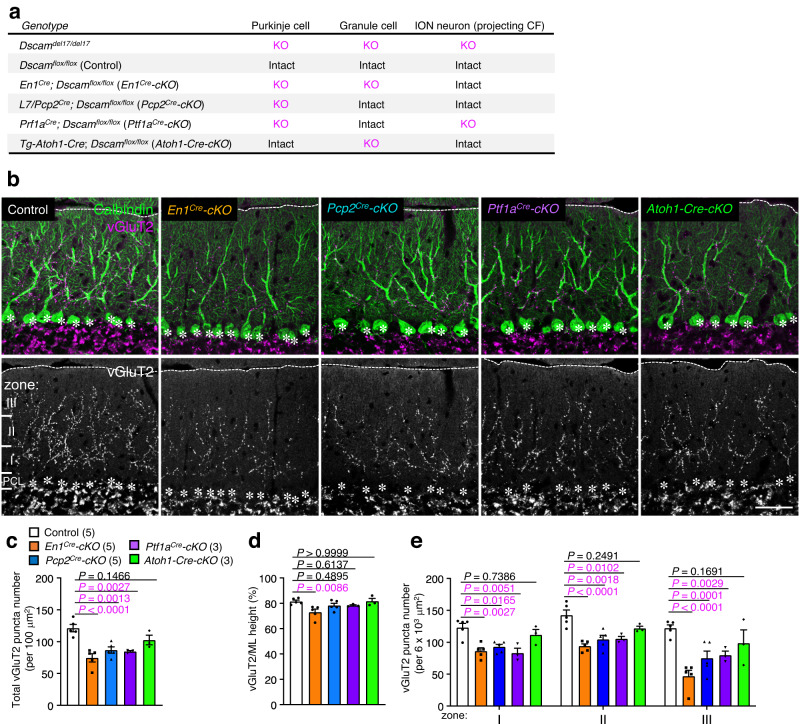
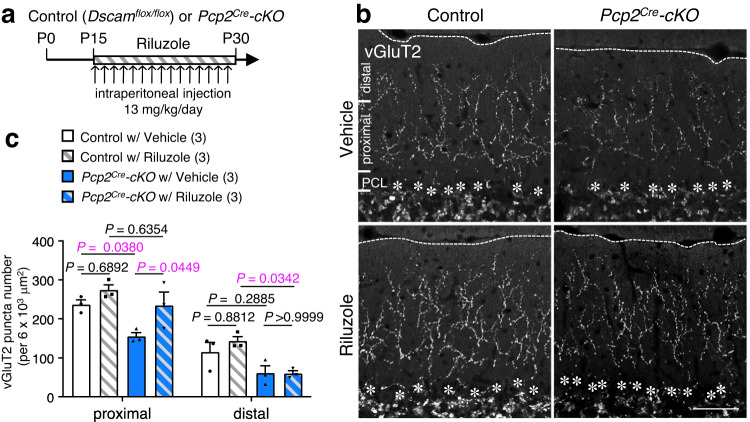
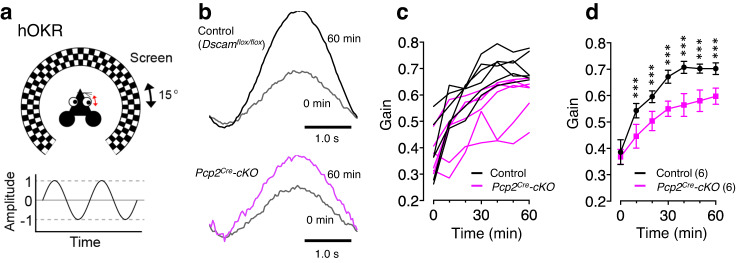
In the central nervous system, astrocytes enable appropriate synapse function through glutamate clearance from the synaptic cleft; however, it remains unclear how astrocytic glutamate transporters function at peri-synaptic contact. Here, we report that Down syndrome cell adhesion molecule (DSCAM) in Purkinje cells controls synapse formation and function in the developing cerebellum. Dscam-mutant mice show defects in CF synapse translocation as is observed in loss of function mutations in the astrocytic glutamate transporter GLAST expressed in Bergmann glia. These mice show impaired glutamate clearance and the delocalization of GLAST away from the cleft of parallel fibre (PF) synapse. GLAST complexes with the extracellular domain of DSCAM. Riluzole, as an activator of GLAST-mediated uptake, rescues the proximal impairment in CF synapse formation in Purkinje cell-selective Dscam-deficient mice. DSCAM is required for motor learning, but not gross motor coordination. In conclusion, the intercellular association of synaptic and astrocyte proteins is important for synapse formation and function in neural transmission.


Conflict of interest statement

The authors declare no competing interests.

Figures

Fig. 1
Fig. 1. Expression and localisation of DSCAM in the developing mouse cerebellum.
a Violin plot of log10 (nUMI) per profile across the 16 cell types identified. The relative median values are consistent with known differences in cell size; e.g., Purkinje cells have the highest median number of UMIs. UMI: unique molecular identifier. b In situ hybridisation images of the mouse cerebellum and its surrounding area. Allen Brain Atlas, https://mouse.brain-map.org/gene/show/13287. The green arrowhead indicates the signals in the inferior olive nucleus. The pink and yellow arrowheads indicate the signals of the Purkinje cells and interneurons, respectively. Scale bars in the left and middle/right boxes are 1.68 mm and 100 µm, respectively. c Temporal expression profiles of DSCAM protein in the cerebellum. Data are confirmed by three independent experiments. d Experimental design for in-utero electroporation and analyses. e P15 sagittal cerebellar sections expressing DSCAM–mEGFP with DsReds2 in electroporated Purkinje cells. 2, High magnification picture of 1. Boxed regions indicate the area shown in 35. 3–5, Orange arrows indicate the dendritic spine of Purkinje cells. Blue arrows indicate DSCAM-EGFP-positive thin structures like filopodia. Scale bars 1 and 3 are 100 µm and 5 µm, respectively. Data are confirmed by three independent experiments. f Fractionation of DSCAM into a synaptosomal fraction using P20 wild-type cerebella. Data are confirmed by three independent experiments. Immunostainings of endogenous ALFA-tagged DSCAM and Calbindin (g) or PSD95 (h) in cerebellar slices from DscamALFA/ALFA mice on postnatal day 14 (P14). (top) Boxed regions are enlarged in the bottom images. Yellow arrowheads indicate adjacent localisation of DSCAM-ALFA and Calbindin (g) or PSD95 (h). Data are confirmed by three independent experiments. Scale bars, 50 µm (top), 5 µm (bottom). Source data are provided as the Source Data file.
Fig. 2
Fig. 2. Regressed CF territory and decreased CF synapses in Dscamdel17/del17 cerebella.
a Immunohistochemistry of Calbindin and vGluT2 in P30 wild-type (WT) (left) and Dscamdel17/del17 (right) mouse cerebellum. Dotted lines and asterisks represent the pial surface and Purkinje cell soma, respectively. The molecular layer located at the upper area of the Purkinje cell layer (PCL) was divided into three areas in f: Zone I was up to 40 µm in height from the PCL; Zone II was from 40 µm to 80 µm in height; Zone III was above 80 µm in height. Scale bar, 50 µm. b Immunohistochemistry of Calbindin in P30 WT (upper) and Dscamdel17/del17 (lower) mouse cerebellum. The boxed regions are enlarged in the right images. Pink arrowheads represent ectopic spines from proximal dendrites. Scale bar, 50 µm. c The density of spines on the primary dendrites per 10 µm dendrite length. WT, N = 4 mice, n = 52 dendrites; Dscamdel17/del17, N = 4 mice, n = 70 dendrites, box plots show median (horizontal line), quartiles (box), and range (whiskers), two-tailed Mann-Whitney test. d Developmental changes in the total vGluT2 puncta number per 100 µm2. The numbers in each column indicate the number of mice examined. Data represent mean ± SEM; Two-way ANOVA with multiple comparisons. e Developmental changes in the ratio of vGluT2 height per height of molecular layer (ML). The numbers in each column indicate the number of mice examined. Data represent mean ± SEM; Two-way ANOVA with multiple comparisons. f Developmental and regional changes in the total number of vGluT2 puncta per 6×103 µm2. The zone was represented in a. Data represent mean ± SEM; Two-way ANOVA with multiple comparisons.
Fig. 3
Fig. 3. Hypofunction of GLAST in PF synapse in Dscamdel17/del17 mouse.
a Representative traces of stimulated CF-EPSCs from P30 cerebellar slices in adult WT (left) and Dscamdel17/del17 (right) mice. Superimposition of CF-EPSCs evoked by various stimulus intensities. CF: climbing fibre. b Frequency distributions of the number of CFs innervating each Purkinje cell at P30. The numbers in parentheses are mice count. Two-tailed Wilcoxon matched-pairs signed rank test. Strongest CF-EPSC amplitudes (c) and the paired-pulse ratio (d) from P28–32. The numbers in parentheses are mice count. Statistical analysis was performed using data from each neuron indicated by the dots in the graph. Data represent mean ± SEM with individual data from each neuron (c WT, n = 22; Dscamdel17/del17, n = 29, d WT, n = 13; Dscamdel17/del17, n = 12); two-tailed Mann-Whitney U test. Datasets of CF-EPSCs (eg) and PF-EPSCs (hj). Representative traces of EPSCs (e and h), amplitude (f and i), and amplitude ratio (g and j) from P28–32. The numbers in parentheses are mice count. Statistical analysis was performed using data from each neuron indicated by the dots in the graph. Data represent mean ± SEM with individual data from each neuron (fg, WT, n = 12; Dscamdel17/del17, n = 12, ij, WT, n = 8; Dscamdel17/del17, n = 8); two-tailed Mann-Whitney U test (fg, ij). PF-EPSC: parallel fibre-evoked excitatory postsynaptic current. CTZ: cyclothiazide. CF-EPSC: climbing fibre-evoked excitatory postsynaptic current. k, Immunoelectron microscopy of WT and Dscamdel17/del17 mouse molecular layer. Bergmann glial (BG) processes and dendritic spines of Purkinje cells (PC) are tinted pink and light blue, respectively. Higher magnification in the bottom-right corner represents the area surrounded by the green dotted box. The nearest postsynaptic density (PSD) edge and closest GLAST labelled with immunogold are indicated by yellow and pink arrowheads, respectively. Scale bar, 200 nm. l, Cumulative histogram of the distance between nearest PSD edge to closest GLAST labelled by immunogold in PF synapse. Samples were collected from three littermates per genotype. WT, n = 86 PSD edges; Dscamdel17/del17, n = 75 PSD edges. Unpaired two-tailed t-test. m, The density of GLAST labelled by immunogold. WT, N = 4 mice, n = 25 Bergmann glia; Dscamdel17/del17, N = 3 mice, n = 25 Bergmann glia. Statistical analysis was performed using data from each neuron indicated by the dots in the graph. Data represent mean ± SEM; two-tailed Mann-Whitney U test.
Fig. 4
Fig. 4. DSCAM associates with GLAST.
a Co-immunoprecipitation and western blot assays using synaptosomal fraction (n = 3). The arrowhead indicates the bands of DSCAM. b Co-immunoprecipitation assays using whole brain lysate from DscamALFA/ALFA and Dscam+/+ mice. The lysates were incubated with anti-GLAST or anti-ALFA nanobody and the immunoprecipitants analysed by western blot using anti-ALFA nanobody, anti-DSCAM, and anti-GLAST and anti-RapGEF2 antibodies. Data are confirmed by three independent experiments. Input, 1% of total lysate. c Diagram of the domain structure of native DSCAM and deletion constructs fused with mEGFP. d Co-immunoprecipitation assay using lysates of COS-7 cells expressing Dscam constructs and full-length GLAST fused with FLAG at the C-terminus were incubated with an anti-Flag antibody. The input (left: 5%) and immunoprecipitants (IP, right) were analysed by western blotting using anti-GFP and anti-Flag antibodies. The experiment was repeated at least three times. The asterisk indicates the bands of antibodies. The arrowheads indicate the intact band of GLAST-FLAG. e Immunostainings of endogenous ALFA-tagged DSCAM and GLAST in cerebellar slices from DscamALFA/ALFA mice on postnatal day 14 (P14). The left images show wide-field views of ML. Scale bar, 50 µm. The boxed region in the merged image is enlarged in the top right corner image. Scale bar, 5 µm. High-magnification images for three rectangles (1, 2, 3) in the right upper panel are shown below. Yellow arrowheads indicate adjacent localisation of DSCAM-ALFA and GLAST. Data are confirmed by three independent experiments. Scale bar, 1 µm. Source data are provided as the Source Data file.
Fig. 5
Fig. 5. CF synapse translocation is perturbed in conditional KO mice lacking Dscam in Purkinje cells.
a Table showing the depletion of Dscam on Purkinje cells, granule cells, and ION neurons in each cKO mouse. ION: inferior olive nucleus. CF: climbing fibre. cKO: conditional knockout. b Immunohistochemistry of Calbindin and vGluT2 in P30 Control and conditional KO mouse cerebella. Dotted lines and asterisks represent the pial surface and Purkinje cell soma, respectively. The molecular layer located at the upper area of the Purkinje cell layer (PCL) was divided into three areas in e; Zone I was up to 40 µm in height from the PCL; Zone II was from 40 µm to 80 µm in height; Zone III was above 80 µm in height. Scale bar, 50 µm. Quantification of the total vGluT2 puncta number (c) and the ratio of vGluT2 height to molecular layer height (d) in the molecular layer of each cKO cerebella. The numbers in parentheses are mice count. Data represent mean ± SEM; Two-way ANOVA with multiple comparisons. e Regional changes in the total number of vGluT2 puncta per 6×103 µm2. The zone was represented in a. The numbers in parentheses are mice count. Data represent mean ± SEM; Two-way ANOVA with multiple comparisons.
Fig. 6
Fig. 6. Riluzole administration rescues the impaired CF translocation.
a Experimental design for riluzole administration. CF: climbing fibre. Control: Dscamflox/flox. cKO: conditional knockout. b Immunohistochemistry of vGluT2 in adult control (left) and Pcp2Cre-cKO (right) mouse cerebella treated with vehicle (upper) or riluzole (lower). Dotted lines and asterisks represent the pial surface and Purkinje cell soma, respectively. The molecular layer located at the upper area of the Purkinje cell layer (PCL) was divided into two areas in c. The proximal area was up to 80 µm in height from the PCL; the distal area was above 80 µm in height. Scale bar, 50 µm. c Quantification of vGluT2 puncta number in the proximal and distal half areas. The zone was represented in b. The numbers in parentheses are mice count. Data represent mean ± SEM; Two-way ANOVA with multiple comparisons.
Fig. 7
Fig. 7. Motor learning is impaired in conditional KO mice lacking Dscam in Purkinje cells.
a Cartoon of hOKR system. The mouse was placed on a table surrounded by a checkered screen, and the head was fixed. Eye movements were monitored while the screen oscillated sinusoidally. b Representative hOKR waveforms in Pcp2Cre-cKO (lower) and its control littermate (upper) mice before (0 min) and after (60 min) training. Individual data (c) and the averaged values (d) of hOKR acquisition for 60 min in Pcp2Cre-cKO mice versus their control littermates. The numbers in parentheses are mice count. Data represent mean ± SEM; ***p < 0.001, Two-way repeated measures ANOVA in (d). Control: Dscamflox/flox.

References

    1. Danbolt NC. Glutamate uptake. Prog. Neurobiol. 2001;65:1–105. doi: 10.1016/S0301-0082(00)00067-8. - DOI - PubMed
    1. Yuzaki M. The C1q complement family of synaptic organizers: not just complementary. Curr. Opin. Neurobiol. 2017;45:9–15. doi: 10.1016/j.conb.2017.02.002. - DOI - PubMed
    1. Kano M, Watanabe T. Developmental synapse remodeling in the cerebellum and visual thalamus. F1000Res. 2019;8:F1000. doi: 10.12688/f1000research.18903.1. - DOI - PMC - PubMed
    1. Ichikawa R, et al. Territories of heterologous inputs onto Purkinje cell dendrites are segregated by mGluR1-dependent parallel fibre synapse elimination. Proc. Natl Acad. Sci. USA. 2016;113:2282–2287. doi: 10.1073/pnas.1511513113. - DOI - PMC - PubMed
    1. Uesaka N, et al. Retrograde semaphorin signaling regulates synapse elimination in the developing mouse brain. Science. 2014;344:1020–1023. doi: 10.1126/science.1252514. - DOI - PubMed