Clinical Trial
. 2024 Feb 1;15(1):972.
doi: 10.1038/s41467-024-45216-z.

Durvalumab and guadecitabine in advanced clear cell renal cell carcinoma: results from the phase Ib/II study BTCRC-GU16-043

Affiliations
Clinical Trial

Durvalumab and guadecitabine in advanced clear cell renal cell carcinoma: results from the phase Ib/II study BTCRC-GU16-043

Yousef Zakharia et al. Nat Commun. .

Abstract

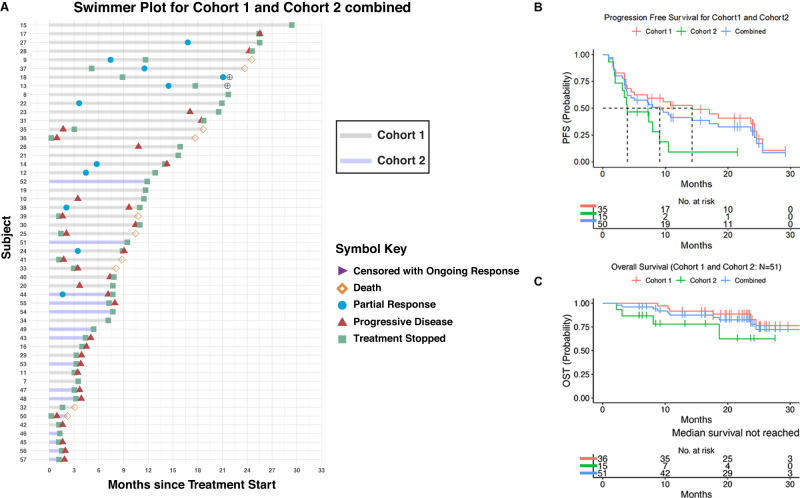
Epigenetic modulation is well established in hematologic malignancies but to a lesser degree in solid tumors. Here we report the results of a phase Ib/II study of guadecitabine and durvalumab in advanced clear cell renal cell carcinoma (ccRCC; NCT03308396). Patients received guadecitabine (starting at 60 mg/m2 subcutaneously on days 1-5 with de-escalation to 45 mg/m2 in case of dose limiting toxicity) with durvalumab (1500 mg intravenously on day 8). The study enrolled 57 patients, 6 in phase Ib with safety being the primary objective and 51in phase II, comprising 2 cohorts: 36 patients in Cohort 1 were treatment naive to checkpoint inhibitors (CPI) with 0-1 prior therapies and 15 patients in Cohort 2 were treated with up to two prior systemic therapies including one CPI. The combination of guadecitabine 45 mg/m2 with durvalumab 1500 mg was deemed safe. The primary objective of overall response rate (ORR) in cohort 1 was 22%. Sixteen patients (44%) experienced stable disease (SD). Secondary objectives included overall survival (OS), duration of response, progression-free survival (PFS), clinical benefit rate, and safety as well as ORR for Cohort 2. Median PFS for cohort 1 and cohort 2 were 14.26 and 3.91 months respectively. Median OS was not reached. In cohort 2, one patient achieved a partial response and 60% achieved SD. Asymptomatic neutropenia was the most common adverse event. Even though the trial did not meet the primary objective in cohort 1, the tolerability and PFS signal in CPI naive patients are worth further investigation.


Conflict of interest statement

Y.Z.: advisory boards: Bristol Myers Squibb, Amgen, Roche Diagnostics, Novartis, Janssen, Eisai, Exelixis, Castle Bioscience, Genzyme Corporation, Astrazeneca, Array, Bayer, Pfizer, Clovis, EMD Serono, Myovant. Grant/research support from: institutional clinical trial support from NewLinkGenetics, Pfizer, Exelixis, Eisai. Data safety and monitoring committee: Janssen Research and Development. Consultant honorarium: Pfizer, Novartis. E.S.: institutional research funding: Medivation/Astellas. Advisory boards: Merck, Johnson & Johnson, Vyriad. Data safety monitoring board: Aura Biosciences. M.J.: institutional research funding: AstraZeneca. Advisory boards: Seagen, Gilead. Travel and accommodation: DAVA Oncology. Mentor on diversity grant: Bristol Myers Squibb. S.A., R.H., D.P., V.B., A.M., XL, C.L., I.K., W.Z., A.A.: declare no competing interest.

Figures

Fig. 1
Fig. 1. Efficacy outcomes in the treatment of patients with mRCC using durvalumab and guadecitabine.
A Swimmer plot showing treatment response (RECIST 1.1) and survival characteristics for Cohort 1 (n = 36 gray) and Cohort 2 (n = 15 violet). Symbols indicate time point when progressive disease (triangles) or partial response (circle) was achieved. Arrowheads indicate patients whose stable disease or response was ongoing at the time of data analysis. B Progression-free survival and C overall survival based on cohort, Kaplan-Meier plot. Source data are provided as a Source Data file.
Fig. 2
Fig. 2. Relationship between immune cell phenotype and response.
Mononuclear cells isolated from peripheral blood collected before treatment (C1D1) were analyzed by flow cytometry. Response assessment was performed using RECIST 1.1 and allowed patients to be grouped as those with progressive disease (PD n = 9), stable disease (SD n = 28), and partial or complete response (PR n = 11). A Myeloid-derived suppressor cells (MDSC) (n = 47) were gated as CD45+Lin (−) CD33+CD14 and CD45+Lin(−) CD33+HLA-DR). Mean + SEM, two-way ANOVA. BH Association peripheral T-cell effector status with patients’ responses. Percentages of IFNɣ (n = 43) (B, C) TNFɑ (n = 42) (DG), RORɣt (n = 45) (I, J) and Foxp3 (n = 43) (K, L) in CD8+ or CD4+ T cells were analyzed by FACS. Results are expressed as mean + SEM, Kruskal-Wallis ANOVA. Gating started is shown in supplementary Fig. 1A. One representative dot plot from each of the response types is shown. Source data are provided as a Source Data file.
Fig. 3
Fig. 3. Relationship between immune cell phenotype and immune-mediated toxicity.
Mononuclear cells isolated from peripheral blood collected before treatment (C1D1) and at 5 weeks (C2D8) were analyzed by flow cytometry. Patients were categorized based on their CTCAE grade of immune-mediated toxicity into Grade 1–2 (mild) (n = 5), Grade 3–5 (severe) (n = 24), and no immune-mediated toxicity (none) (n = 19). Results are expressed as mean + SEM, one-sided paired t test. Gating started is shown in supplementary Fig. 1A. One representative dot plot from each time point is shown. Source data are provided as a Source Data file.
Fig. 4
Fig. 4. Methylation changes with treatment.
A Methylation at LINE-1 repetitive element regions, a decrease in methylation was observed in 22/25 patients between C1D1 and C2D8 timepoints. B Gartner-Aldman plot of change in CXCL10 methylation between first and second endpoints (n = 12). One-sided paired t test. Source data are provided as a source data file.
Fig. 5
Fig. 5. The association between chemokine serum levels and patient clinical outcome.
Plasma samples from 34 patients at baseline prior to treatment (C1D1) and at 5 weeks (C2D8) were analyzed for presence chemokines by Luminex (Panel HCYP3MAG-63K-08 for CXCL9 and CXCL10, Millipore). A Heatmap generated from non-transformed data separate for each chemokine. Units are in pg/mL; one-sided paired t test. BD Gardner-Altman plot with denotes log-transformed (B) CXCL9 (n = 34), (C) CXCL10 (n = 34), and (D) CXCL11 (n = 34) values at C1D1 and C2D8 collection timepoints. One-sided paired t test. Increased group is created based on >15% change, and decreased group is based on <15% change. The 15% cutoff was determined arbitrarily by testing significance in 15% increments of 15%, 30%, and 45%, respectively. Source data are provided as a Source Data file.

References

    1. Rini BI, et al. The society for immunotherapy of cancer consensus statement on immunotherapy for the treatment of advanced renal cell carcinoma (RCC) J. Immunother. Cancer. 2019;7:354. doi: 10.1186/s40425-019-0813-8. - DOI - PMC - PubMed
    1. Rathmell WK, et al. Management of metastatic clear cell renal cell carcinoma: ASCO guideline. J. Clin. Oncol. 2022;40:2957–2995. doi: 10.1200/JCO.22.00868. - DOI - PubMed
    1. Zou W, Wolchok JD, Chen L. PD-L1 (B7-H1) and PD-1 pathway blockade for cancer therapy: mechanisms, response biomarkers, and combinations. Sci. Transl. Med. 2016;8:328rv4–rv4. doi: 10.1126/scitranslmed.aad7118. - DOI - PMC - PubMed
    1. Alva AS, et al. Hypomethylating agents for urologic cancers. Future Oncol. 2011;7:447–463. doi: 10.2217/fon.11.9. - DOI - PubMed
    1. Wendel M, Galani IE, Suri-Payer E, Cerwenka A. Natural killer cell accumulation in tumors is dependent on IFN-γ and CXCR3 ligands. Cancer Res. 2008;68:8437–8445. doi: 10.1158/0008-5472.CAN-08-1440. - DOI - PubMed

Publication types

MeSH terms

Supplementary concepts