. 2024 Feb 1;14(1):2642.
doi: 10.1038/s41598-024-52939-y.

The Cantril Ladder elicits thoughts about power and wealth

Affiliations

The Cantril Ladder elicits thoughts about power and wealth

August Håkan Nilsson et al. Sci Rep. .

Abstract

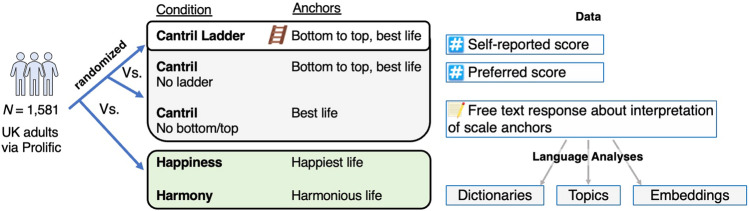
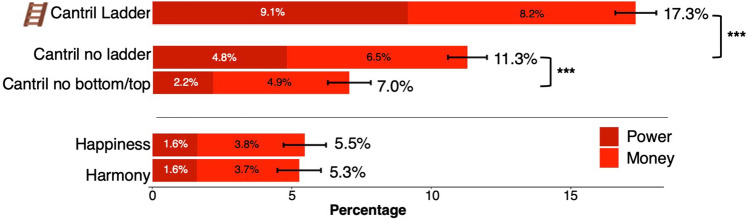
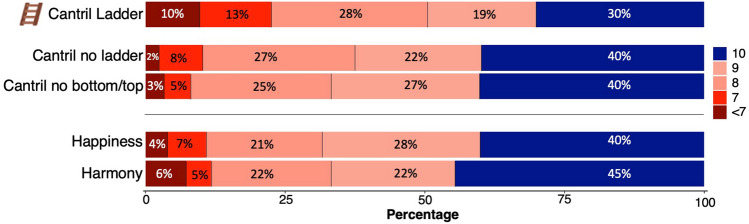
The Cantril Ladder is among the most widely administered subjective well-being measures; every year, it is collected in 140+ countries in the Gallup World Poll and reported in the World Happiness Report. The measure asks respondents to evaluate their lives on a ladder from worst (bottom) to best (top). Prior work found Cantril Ladder scores sensitive to social comparison and to reflect one's relative position in the income distribution. To understand this, we explored how respondents interpret the Cantril Ladder. We analyzed word responses from 1581 UK adults and tested the impact of the (a) ladder imagery, (b) scale anchors of worst to best possible life, and c) bottom to top. Using three language analysis techniques (dictionary, topic, and word embeddings), we found that the Cantril Ladder framing emphasizes power and wealth over broader well-being and relationship concepts in comparison to the other study conditions. Further, altering the framings increased preferred scale levels from 8.4 to 8.9 (Cohen's d = 0.36). Introducing harmony as an anchor yielded the strongest divergence from the Cantril Ladder, reducing mentions of power and wealth topics the most (Cohen's d = -0.76). Our findings refine the understanding of historical Cantril Ladder data and may help guide the future evolution of well-being metrics and guidelines.


Conflict of interest statement

Oscar Kjell has co-founded a start-up using computational language assessments to diagnose mental health problems.

Figures

Figure 1
Figure 1
Summary of the study design.
Figure 2
Figure 2
Relative frequency of closed dictionaries for “Power” and “Money”. This figure shows relative frequencies of the Linguistic Inquiry & Word Counts (LIWC) dictionaries Power and Money for the different study conditions, expressed in % of the words used in the interpretations generated by the participants. ***p < 0.001 in pairwise t-tests. Black bars show standard errors.
Figure 3
Figure 3
The impact of the ladder: Cantril Ladder (red) vs Cantril no ladder (blue). (A) The LDA topics and their mean differences in relative frequencies between the Cantril Ladder versus Cantril no ladder conditions expressed in Cohen’s d. (B) Significant words related to the Cantril Ladder (red) versus Cantril no ladder (blue) conditions in the word embedding space compared to a permuted null distribution. The font size represents frequency. The position on the x-axis represents the dot product score on the direction line representing the maximal variance. For better visualization, the words are separated on the y-axis, but the y-axis does not represent any information. (C) The three scale interpretations with the highest out-of-sample log odds of being in each condition from the logistic ridge regression model.
Figure 4
Figure 4
Distribution of preferred levels. The figure shows the distribution of preferred level: all scores below 7 were grouped into one color. The differences between the Cantril Ladder to all the other conditions were statistically significant both by using pairwise Wilcoxon rank-sum tests (all p < 0.001 adjusted for multiple comparisons, r = 0.16–19) and pairwise t-tests of the estimated marginal means that were adjusted for age, gender, and subjective social status (all p < 0.001 adjusted for multiple comparisons, d = 0.27–0.39, for more details, see the "Statistical analysis” section).
Figure 5
Figure 5
The top of the ladder (red) vs the most harmonious life (green). (A) The LDA topics and their mean differences in relative frequencies between the Cantril Ladder and Harmony conditions expressed in Cohen’s d. (B) Significant words related to the Cantril Ladder (red words) and Harmony (green) in the word embedding space compared to a permuted null distribution. The font size represents frequency. The position on the x-axis represents the dot product score on the direction line representing the maximal variance. For better visualization, the words are separated on the y-axis, but the y-axis does not represent any information. (C) The three scale interpretations with the highest log odds of being in each condition from our logistic ridge regression model.

References

    1. Cantril H. The Pattern of Human Concerns. Rutgers University Press; 1965.
    1. Gallup. Understanding How Gallup Uses the Cantril Scale.http://www.gallup.com/poll/122453/understanding-gallup-uses-cantril-scal... (2011). Accessed 23 Apr 2011.
    1. Gallup . World Poll Methodology. Technical Report; 2019.
    1. Helliwell JF, Layard R, Sachs JD, De Neve J-E, Aknin LB, Wang S, editors. World Happiness Report 2023. Sustainable Development Solutions Network; 2023.
    1. Diener E, Oishi S, Lucas R. National accounts of subjective well-being. Am. Psychol. 2015;70:234–242. doi: 10.1037/a0038899. - DOI - PubMed