. 2024 Feb 1;14(1):2722.
doi: 10.1038/s41598-024-53016-0.

Modulating the skin mycobiome-bacteriome and treating seborrheic dermatitis with a probiotic-enriched oily suspension

Affiliations

Modulating the skin mycobiome-bacteriome and treating seborrheic dermatitis with a probiotic-enriched oily suspension

Mauro Truglio et al. Sci Rep. .

Abstract

Seborrheic dermatitis (SD) affects 2-5% of the global population, with imbalances in the skin microbiome implicated in its development. This study assessed the impact of an oily suspension containing Lactobacillus crispatus P17631 and Lacticaseibacillus paracasei I1688 (termed EUTOPLAC) on SD symptoms and the skin mycobiome-bacteriome modulation. 25 SD patients were treated with EUTOPLAC for a week. Symptom severity and skin mycobiome-bacteriome changes were measured at the start of the treatment (T0), after seven days (T8), and three weeks post-treatment (T28). Results indicated symptom improvement post-EUTOPLAC, with notable reductions in the Malassezia genus. Concurrently, bacterial shifts were observed, including a decrease in Staphylococcus and an increase in Lactobacillus and Lacticaseibacillus. Network analysis highlighted post-EUTOPLAC instability in fungal and bacterial interactions, with increased negative correlations between Malassezia and Lactobacillus and Lacticaseibacillus genera. The study suggests EUTOPLAC's potential as a targeted SD treatment, reducing symptoms and modulating the mycobiome-bacteriome composition.


Conflict of interest statement

The authors declare no competing interests.

Figures

Figure 1
Figure 1
Clinical parameters in SD patients treated with EUTOPLAC. (a) The severity of erythema, desquamation, and pruritus in the forehead and nasolabial regions was evaluated according to the Seborrheic Dermatitis Area Severity Index (SDASI). Assessments were made at three distinct time points: before treatment (T0), one-week post-treatment (T8), and three weeks post-treatment (T28). Statistical differences were determined using the Friedman teste and post hoc Nemenyi test. (b) Images showing the skin lesions on a patient's face with seborrheic dermatitis at different time points.
Figure 2
Figure 2
Mycobiome taxonomic composition and diversity. (a) Boxplot showed the fungal diversity in SD patients at T0, T8, and T28. Alpha diversity was calculated using the Shannon diversity index and Pielou Evenness index at the genus level. Statistical differences were determined using the Kruskal–Wallis test. (b) Bray Curtis and Jaccard beta diversity was calculated at the genus level and represented as principal coordinate analysis (PCoA). PERMANOVA test was used to assess significance. (c) The bar plot depicted the fungal mean relative abundance at the phylum and genus levels. (d) Microbiome Multivariable Associations with Linear Models (MaAsLin 2) heatmap showing significant variations in bacterial abundance at the genus level at T8 and T28 compared to T0. The color scale bar shows positive (red) and negative (blue) correlations between fungal genera, ranging from the highest positive normalization (+ 15) to the lowest one (− 15). e Relative abundance for the indicated fungal genera at T0, T8, and T28. Significance was assessed by the Kruskal Wallis static test. *, P < 0.05; **, P < 0.01; ***, P < 0.001, ****, P < 0.0001.
Figure 3
Figure 3
Bacteriome taxonomic composition and diversity. (a) Boxplot showed the bacterial diversity in SD patients at T0, T8, and T28. Alpha diversity was calculated using the Shannon diversity index and Pielou Evenness index at the genus level. Statistical differences were determined using the Kruskal–Wallis test. (b) Bray Curtis and Jaccard beta diversity was calculated at the genus level and represented as principal coordinate analysis (PCoA). PERMANOVA test was used to assess significance. (c) The bar plot depicted the bacterial mean relative abundance at the phylum and genus levels. (d) Microbiome Multivariable Associations with Linear Models (MaAsLin 2) heatmap showing significant variations in bacterial abundance at the genus level at T8 and T28 compared to T0. The color scale bar shows positive (red) and negative (blue) correlations between bacterial genera, ranging from the highest positive normalization (+ 20) to the lowest one (− 20). (e) Relative abundances for the indicated bacterial genera at T0, T8, and T28. Significance was assessed by the Kruskal Wallis static test. *, P < 0.05; **, P < 0.01; ***, P < 0.001, ****, P < 0.0001.
Figure 4
Figure 4
Bacteriome signature of SD patients at the species level. (a) Microbiome Multivariable Associations with Linear Models (MaAsLin 2) heatmap showing significant variations in bacterial abundance at the species level across different time points in SD patients. Cells denoting significant associations are colored (red or blue) with a plus ( +) or minus ( −) sign indicating the direction of the association. (b) Boxplots showing the relative abundances of the indicated bacterial species across time points. Significance was assessed by the Kruskal Wallis static test. *, P < 0.05; **, P < 0.01; ***, P < 0.001, ****, P < 0.0001.
Figure 5
Figure 5
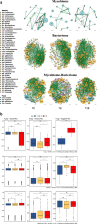
Skin mycobiome-bacteriome networks. (a), Fungal and bacterial co-occurrence and co-exclusion network attributes at T0, T8, and T28. Node size reflects the log-transformed relative abundance level of the mycobiome-bacteriome. The thickness of the edges corresponds to the | r | value of the Spearman correlation coefficient. The color of the edges corresponds to the positive (> 0.4) (green) or negative (< -0.4) (purple) relationship. Edge length is not indicative of any particular attribute. (b), Differences in Spearman’s r values between T0, T8, and T28 (*, P < 0.05; **, P < 0.01; ***, P < 0.001, ****, P < 0.0001; ns, not significant) determined via the Wilcoxon test.
Figure 6
Figure 6
Cumulative skin mycobiome-bacteriome networks with high abundance. Each node shows one taxon of fungi (blue) or bacteria (yellow) with an average abundance greater than 4000 reads in all samples analyzed. Node size reflects the log-transformed relative abundance level of the mycobiome-bacteriome. The thickness of the edges corresponds to the | r | value of the Spearman correlation coefficient. The color of the edges corresponds to the positive (> 0.5) (green) or negative (< −0.5) (purple) relationship. Edge length is not indicative of any particular attribute.
Figure 7
Figure 7
Surface adhesion and biofilm formation in Lactobacillus crispatus P17631 and Lacticaseibacillus paracasei I1688 strains. Experiments were conducted under aerobic (solid bars) and anaerobic (filled bars) conditions. S. epidermidis 12,228 and S. aureus 6538 from the American Type Culture Collection (ATCC) were used as reference strains. (a), The level of bacterial surface adhesion, quantified using the BioFilm Ring Test at 5 and 24 h. (b), The quantity of biofilm biomass produced after 48 h as measured by crystal violet assays (optical density (OD) at 590 nm). (c) Reconstructed three-dimensional (3D) images of biofilm formation of Lactobacillus crispatus P17631 and Lacticaseibacillus paracasei I1688 strains after 48 h of incubation in BHI at 37 °C.The graphs represent the mean values and standard errors derived from three independent experiments of duplicate samples. Significance was assessed by using the Kruskal Wallis static test. *, P < 0.05; **, P < 0.01; ***, P < 0.001, ****, P < 0.0001.

References

    1. Dessinioti, C. & Katsambas, A. Seborrheic dermatitis: etiology, risk factors, and treatments: facts and controversies. Clin. Dermatol. 31, 343–351; 10.1016/j.clindermatol.2013.01.001 (2013). - PubMed
    1. Borda LJ, Perper M, Keri JE. Treatment of seborrheic dermatitis: a comprehensive review. J. Dermatolog. Treat. 2019;30:158–169. doi: 10.1080/09546634.2018.1473554. - DOI - PubMed
    1. Borda, L. J. & Wikramanayake, T. C. Seborrheic Dermatitis, and Dandruff: A Comprehensive Review. J. Clin. Investig. Dermatol.3, 10.13188/2373-1044.1000019 (2015). - PMC - PubMed
    1. Tao, R., Li, R. & Wang, R. Skin microbiome alterations in seborrheic dermatitis and dandruff: A systematic review. Exp. Dermatol.30, 1546–1553; 10.1111/exd.14450 (2021). - PubMed
    1. Lunjani, N., Ahearn-Ford, S., Dube, F. S., Hlela, C. & O'Mahony, L. Mechanisms of microbe-immune system dialogue within the skin. Genes Immun. 22, 276–288; 10.1038/s41435-021-00133-9 (2021). - PMC - PubMed