. 2024 Feb 1;17(1):7.
doi: 10.1186/s13045-024-01526-9.

METTL16 promotes liver cancer stem cell self-renewal via controlling ribosome biogenesis and mRNA translation

Affiliations

METTL16 promotes liver cancer stem cell self-renewal via controlling ribosome biogenesis and mRNA translation

Meilin Xue et al. J Hematol Oncol. .

Abstract

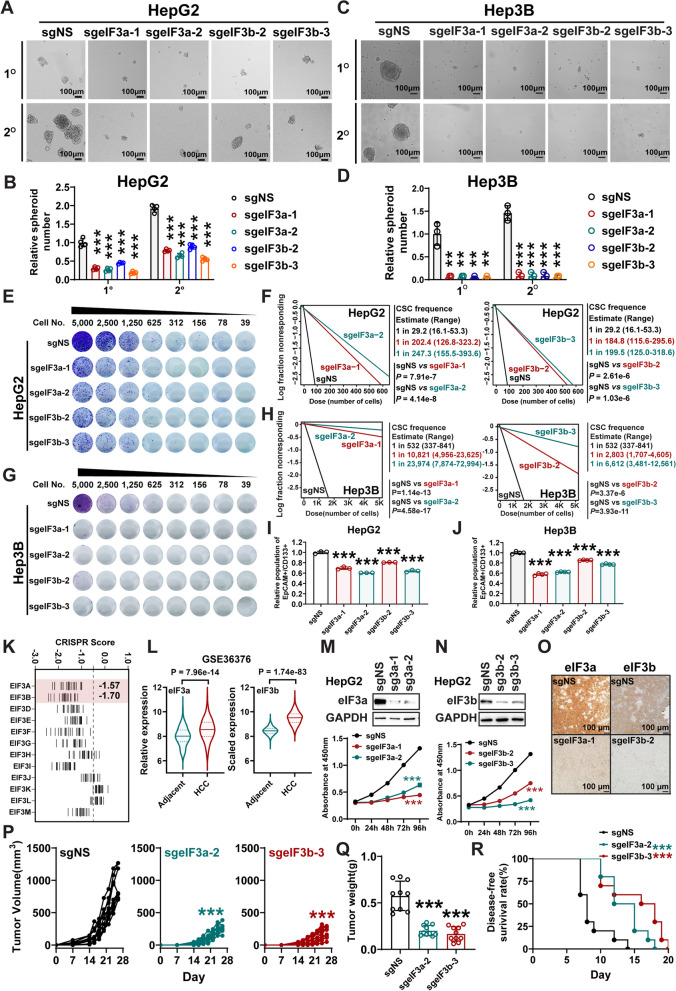
Background: While liver cancer stem cells (CSCs) play a crucial role in hepatocellular carcinoma (HCC) initiation, progression, recurrence, and treatment resistance, the mechanism underlying liver CSC self-renewal remains elusive. We aim to characterize the role of Methyltransferase 16 (METTL16), a recently identified RNA N6-methyladenosine (m6A) methyltransferase, in HCC development/maintenance, CSC stemness, as well as normal hepatogenesis.

Methods: Liver-specific Mettl16 conditional KO (cKO) mice were generated to assess its role in HCC pathogenesis and normal hepatogenesis. Hydrodynamic tail-vein injection (HDTVi)-induced de novo hepatocarcinogenesis and xenograft models were utilized to determine the role of METTL16 in HCC initiation and progression. A limiting dilution assay was utilized to evaluate CSC frequency. Functionally essential targets were revealed via integrative analysis of multi-omics data, including RNA-seq, RNA immunoprecipitation (RIP)-seq, and ribosome profiling.

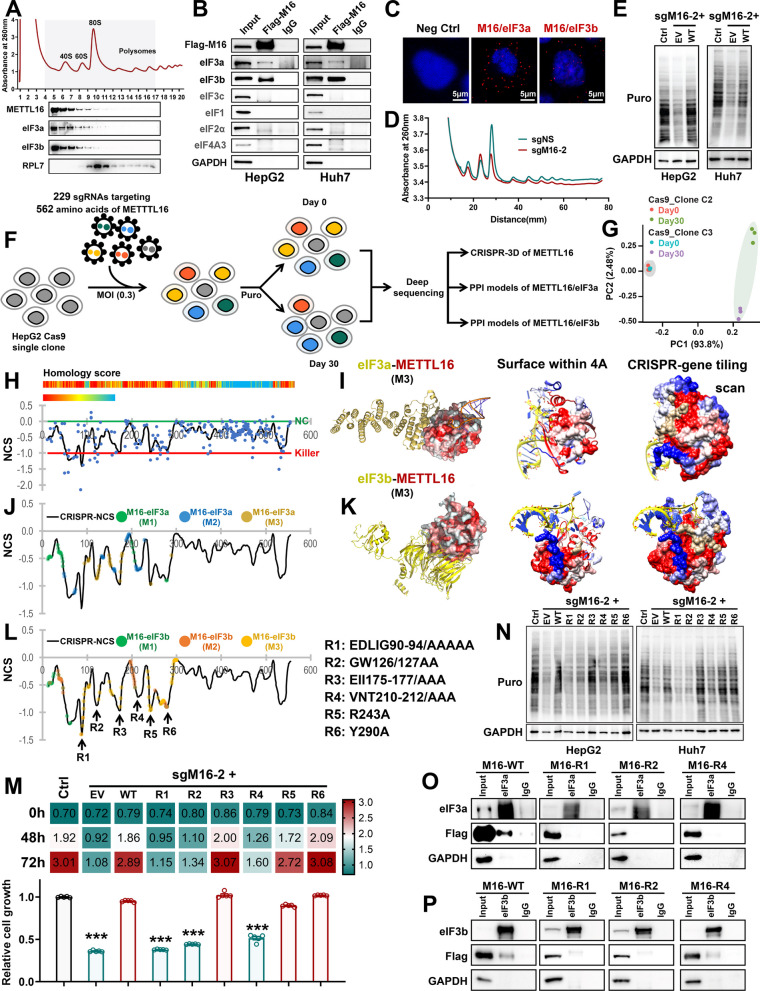
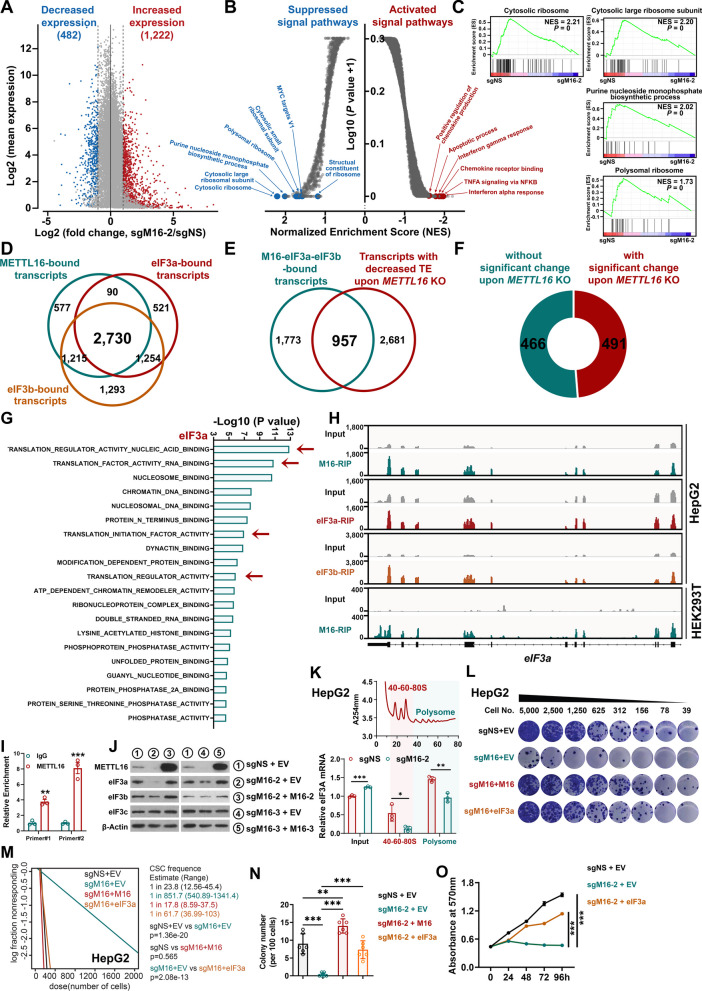
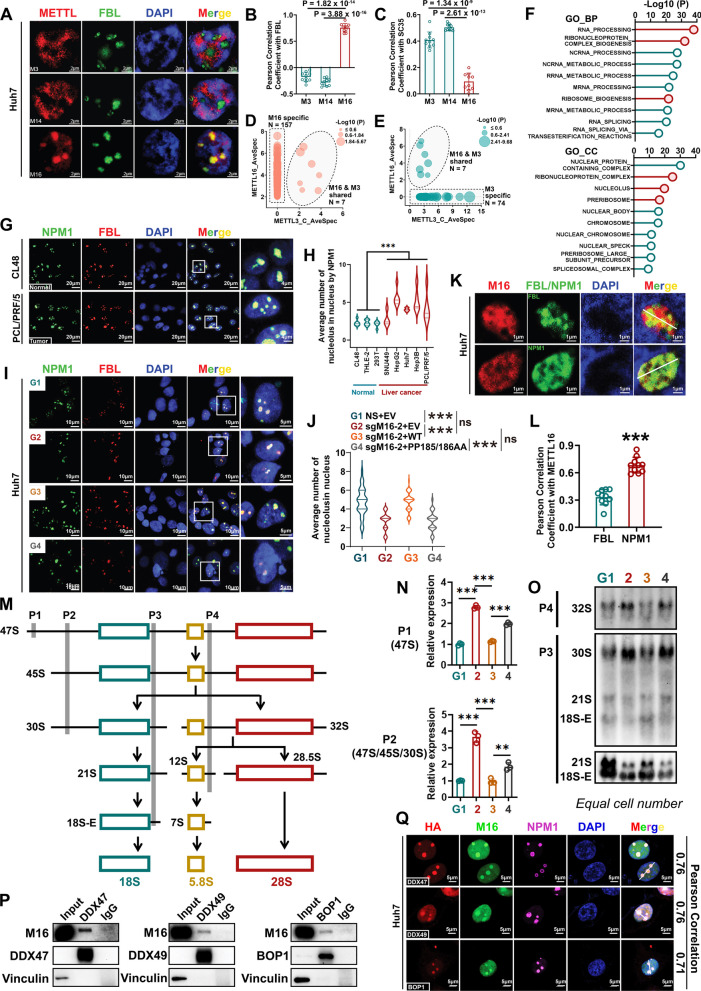
Results: METTL16 is highly expressed in liver CSCs and its depletion dramatically decreased CSC frequency in vitro and in vivo. Mettl16 KO significantly attenuated HCC initiation and progression, yet only slightly influenced normal hepatogenesis. Mechanistic studies, including high-throughput sequencing, unveiled METTL16 as a key regulator of ribosomal RNA (rRNA) maturation and mRNA translation and identified eukaryotic translation initiation factor 3 subunit a (eIF3a) transcript as a bona-fide target of METTL16 in HCC. In addition, the functionally essential regions of METTL16 were revealed by CRISPR gene tiling scan, which will pave the way for the development of potential inhibitor(s).

Conclusions: Our findings highlight the crucial oncogenic role of METTL16 in promoting HCC pathogenesis and enhancing liver CSC self-renewal through augmenting mRNA translation efficiency.

Keywords: Cancer stem cells; Hepatocellular carcinoma; METTL16; N6-methyladenosine; Ribosome biogenesis; Self-renewal; eIF3a; mRNA translation.


Conflict of interest statement

All authors declare no potential conflicts of interest.

Figures

Fig. 1
Fig. 1
Mettl16 is essential for de novo hepatocarcinogenesis, but dispensable for normal hepatogenesis. A Spatial feature plots of METTL16 expression in HCC patient. N, non-tumor region; T, tumor region. B Schematic of the design and representative genotyping results of the liver-specific Mettl16 conditional KO (cKO) mouse model. C Western blotting showing the Mettl16 KO efficiency of liver of Mettl16 wild-type (WT), heterozygous cKO (Mettl16fl/+), and homozygous cKO (Mettl16fl/fl) mice. D Western blotting showing the Mettl16 KO efficiency in the livers of 0- and 5-week-old homozygous cKO mice. E Kaplan–Meier survival curves of Mettl16 WT, heterozygous cKO and homozygous cKO mice. F, G Body (F) and liver (G) weight of adult Mettl16 WT, heterozygous cKO and homozygous cKO mice (n = 10 for WT; n = 6 for Mettl16fl/+; n = 9 for Mettl16fl/fl; mean ± SEM). H Representative liver images of adult Mettl16 WT, heterozygous cKO and homozygous cKO mice. I Representative H&E staining images of adult Mettl16 WT, heterozygous cKO and homozygous cKO mice. J Representative H&E staining images of liver sections from Mettl16 cKO mice at indicated time points postnatally. K, L Relative abundance of CD4T cells, CD8T cells, B cells, NK cells, and macrophages in Mettl16 heterozygous cKO (K) and homozygous cKO (L) mice as compared to Mettl16 WT (n = 3–5; mean ± SEM). M Western blotting showing the cleaved Caspase-3 level in the livers of Mettl16 WT, heterozygous cKO, and homozygous cKO mice. N Schematic of HDTVi-induced de novo hepatocarcinogenesis model. O Representative liver (upper panel) and H&E staining (lower panel) images of tumors generated in Mettl16 WT, heterozygous cKO, and homozygous cKO mice. P, Q The bar plots showing the ratio of liver weight to body weight (P) and the nodule numbers per liver (Q) (n = 6–8; mean ± SEM). R Representative images showing the tumor (T) and adjacent normal (N) tissue in the HDTVi-HCC model. S Western blotting showing the expression levels of Mettl16 in HCC tumors and adjacent normal liver tissues. Statistical analyses: un-paired t-test (F, G, K, L, P, Q). ns, not significantly; *P < 0.05; **P < 0.01
Fig. 2
Fig. 2
METTL16 is highly expressed in liver CSCs and genetic depletion of METTL16 attenuates liver CSC self-renewal. A, B Histogram plot (A) and the statistical results (B) showing METTL16 abundance in CD133 and CD133+ populations in HCC cell lines (n = 5). C, D Histogram plot (C) and the statistical results (D) showing METTL16 abundance in CD133 and CD133+ populations in HCC tumors (n = 3). E, F Representative images (E) and the statistical results (F) showing the effects of METTL16 KO on liver CSC maintenance as determined by spheroid formation assay in HepG2 cells (n = 4; mean ± SD). G, H Representative images (G) and the statistical results (H) showing the effects of METTL16 KO on liver CSC maintenance as determined by spheroid formation assay in Hep3B cells (n = 3; mean ± SD). I, J Representative images (I) and the statistical results (J) showing the effects of METTL16 KO on liver CSC frequency as determined by in vitro limiting dilution assay (LDA) in HepG2 cells. K, L Representative images (K) and the statistical results (L) showing the effects of METTL16 KO on liver CSC frequency as determined by in vitro LDA in Hep3B cells. M, N Percentage of liver CSCs in HepG2 (M) and Hep3B (N) cells upon METTL16 KO as determined by flow cytometry (n = 3; mean ± SD). O Table showing the injected cell numbers and the ratios of xenograft tumors implanted with HepG2 cells at the indicated number of days post transplantation. P Quantitative and statistical results showing the effects of METTL16 KO induced by sgMETTL16-2 (left panel) and sgMETTL16-3 (right panel) on liver CSC frequency as determined by in vivo LDA. Q Percentage of liver CSCs in xenograft tumors implanted with HepG2 cells with or without METTL16 KO [n = 3 (left panel); n = 6 (right panel); mean ± SD]. Statistical analyses: paired t test (B, D); un-paired t test (F, H, M, N, Q); extreme limiting dilution analysis (ELDA) (https://bioinf.wehi.edu.au/software/elda/) (J, L, P). *P < 0.05, **P < 0.01, ***P < 0.001
Fig. 3
Fig. 3
eIF3a and eIF3b, the binding partners of METTL16, promote CSC self-renewal and HCC development. A, B Representative images (A) and the statistical results (B) showing the effects of KO of eIF3a or eIF3b on liver CSC maintenance as determined by spheroid formation assay in HepG2 cells (n = 4; mean ± SD). C, D Representative images (C) and the statistical results (D) showing the effects of KO of eIF3a or eIF3b on liver CSC maintenance as determined by spheroid formation assay in Hep3B cells (n = 3; mean ± SD). E, F Representative images (E) and statistical results (F) showing the effects of KO of eIF3a or eIF3b on liver CSC self-renewal ability as determined by in vitro LDA in HepG2 cells. G, H Representative images (G) and statistical results (H) showing the effects of KO of eIF3a or eIF3b on liver CSC self-renewal ability as determined by in vitro LDA in Hep3B cells. I, J Effect of KO of eIF3a or eIF3b on the population of liver CSCs (EpCAM+/CD133+) in HepG2 (I) and Hep3B (J) cells upon as determined by flow cytometry [n = 3 (I), n = 4 (J); mean ± SD]. K CERES scores of eIF3 subunits from genome-scale CRISPR–Cas9 essentiality screens across 23 liver cancer cell lines. The raw data were downloaded from DepMap (https://depmap.org/portal/). The lower CERES score indicates a higher cancer dependency of the specific gene. Each stick represents one HCC cell line. L Comparison of the mRNA levels of eIF3a and eIF3b between human HCC tissues and normal controls. Adjacent = 193, HCC = 240. The three lines inside the violin plots are the first quartile, median and third quartile. M, N Effect of eIF3a (M) and eIF3b (N) KO on proliferation of HepG2 cells (n = 5; mean ± SD). O eIF3a or eIF3b KO efficacy in the xenograft liver tumors implanted with HepG2 cells as determined by immunohistochemistry. P Average growth curves of xenograft liver tumors upon KO of eIF3a or eIF3b (n = 10). Q Weights of the liver tumors on day 28 post injection (n = 10; mean ± SD). R Kaplan–Meier disease-free survival (DFS) of the xenograft models implanted with HepG2 cells with or without KO of eIF3a or eIF3b (n = 10). Statistical analyses: unpaired t-test (B, D, I, J, L, Q); Log-rank test (R); Two-way ANOVA (M, N, P). **P < 0.01, ***P < 0.001
Fig. 4
Fig. 4
METTL16-eIF3a/b interactions are required for translation and proliferation promotion in HCC. A Polysome profiles of HepG2 cells as determined by sucrose density-gradient ultracentrifugation (top). The localization of eIF3a, eIF3b, METTL16, and RPL7 proteins were validated by Western blotting (bottom). B Representative Co-IP images showing the direct interaction between METTL16 and eIF members in HepG2 and Huh7 cells. C In situ detection of METTL16–eIF3a and METTL16–eIF3b interactions through PLA in HepG2 cells. D Representative polysome profiles of Huh7 cells upon METTL16 KO. Data are representative of 3 independent experiments. E Representative Western blotting images of SUnSET assays used to quantify the amount of nascent [puromycin (Puro)-labeled] peptides in Huh7 and HepG2 cells with METTL16 KO and rescued expression. F Schematic describing our in-house CRISPR screening with two HepG2 Cas9 single clones and protein–protein interaction (PPI) models. G Principal component analysis (PCA) of CRISPR screening data from 2 groups of HepG2 Cas9 single clones on day 0 and day 30. H Normalized CRISPR score (NCS) of each sgRNA construct (dot) and smoothed score (line) of the METTL16-tiling survival screen in HepG2 Cas9 single clones. Top, Peptide homology alignment of METTL16 across different species. I The PPI model between eIF3a and METTL16-CRISPR gene tiling scan. Left, PPI modeled structure (model 3, M3); Middle, Visualization of METTL16 surface area within 4 amino acids (4A) from the predicted eIF3a binding models; Right, CRISPR gene tiling scan plotting of METTL16 from the predicted eIF3a binding models. J The amino acids on the METTL16 predicted to be within 4A distance to eIF3a. K The PPI model between eIF3b and METTL16-CRISPR gene tiling scan. Left, PPI modeled structure (model 3, M3); Middle, Visualization of METTL16 surface area within 4A from the predicted eIF3b binding models; Right, CRISPR gene tiling scan plotting of METTL16 from the predicted eIF3b binding models. L The amino acids on the METTL16 predicted to be within 4A distance to eIF3b. Regions 1–6 (R1-R6) were derived from high-density CRISPR gene tiling scans of METTL16. M Rescue effect of regions 1–6 mutated METTL16s on METTL16 KO-induced cell proliferation suppression in Huh7 cells (n = 5; mean ± SEM). N Representative Western blotting images of SUnSET assays in Huh7 and HepG2 cells with METTL16 KO and rescued expression. O, P Representative Co-IP images showing the direct interaction between eIF3a (O) or eIF3b (P) and METTL16 with R1, R2 or R4 mutations in HepG2 cells. Statistical analyses: unpaired t-test (M); ***P < 0.001
Fig. 5
Fig. 5
METTL16 enhances translation-associated pathways and eIF3a mRNA translation efficiency to promote CSC self-renewal. A MA plots displaying the decreased- and increased- expression genes in Huh7 cells upon METTL16 KO. The dashed vertical lines represent Log2(fold change) = 1 or − 1. The significantly increased- or decreased- expression genes are shown in red and blue, respectively (P < 0.01); the grey dots indicate P ≥ 0.01. B Volcano plots showing the enriched gene signatures in Huh7 upon METTL16 depletion. Here, we highlight the top decreased and increased pathways upon METTL16 KO according to GSEA. C GSEA showing of top down-regulated gene signatures in Huh7 upon METTL16 depletion. D Venn diagram showing the overlap between METTL16-, eIF3a-and eIF3b bound transcripts in HepG2 cells. E Venn diagram showing the overlap between the transcripts with decreased translation efficiency (TE) upon METTL16 KO cells and the transcripts directly bound by METTL16-eIF3a- eIF3b. F Pie charts showing the distribution of 957 transcripts with or without significant mRNA level change upon METTL16 KO. G The Gene Oncology Molecular Function (GO MF) enrichment analysis of the 466 transcripts without significant changes at mRNA levels upon METTL16 KO. H Integrative genome viewer (IGV) browser tracks showing M16 (METTL16), eIF3a, and eIF3b binding peaks on eIF3a mRNA. The up three were conducted in HepG2 cells, while the bottom one was conducted in HEK293T cells. I METTL16 CLIP-qPCR analysis showing the interaction between METTL16 protein and eIF3a mRNA in HepG2 cells (n = 3; mean ± SEM). J Western blotting showing the expression levels of eIFs in HepG2 cells upon METTL16 KO and rescue expression. K Ribo-qPCR showing the translation efficiency of eIF3a mRNA in HepG2 cells upon METTL16 KO. L, M Representative images (L) and the statistical results (M) of liver CSC frequency as determined by in vitro LDA in HepG2 cells upon METTL16 KO and rescue expression of METTL16 or eIF3a. N The bar plots showing the colony number in HepG2 cells upon METTL16 KO and rescue expression of METTL16 or eIF3a (n = 6; mean ± SD). O The rescue effect of eIF3a on the cell proliferation of HepG2 cells upon METTL16 KO (n = 3; mean ± SD). Statistical analyses: un-paired t-test (I, K, N); ELDA software (M); Two-way ANOVA (O). *P < 0.05, **P < 0.01, ***P < 0.001
Fig. 6
Fig. 6
METTL16 preferentially localizes to the granular component (GC) of the nucleolus and facilitates rRNA processing and ribosome biogenesis. A Representative SIM images of FBL (green) and METTL members (red; including METTL3, M3; METTL14, M14; METTL16, M16) in the nucleus of Huh7 cells. FBL, nucleolar marker; DAPI, nuclear marker. B, C Pearson’s correlation analysis between distributions of FBL and the three METTL members (B) or between SC35 and the three METTL members in Huh7 cells (C) (n = 10; mean ± SD). SC35, nuclear speckle marker. D, E Bubble plots showing the METTL16-interacting (D) and METTL3-interacting (E) proteins identified by BioID assay. The size of each dot represents the P value of probability of binding of METTL16 or METTL3 with each protein. The proteins within the rectangle specifically interact with METTL16-BirA* (D) or METTL3-BirA* (E); while the proteins within the oval interact with both METTL16 and METTL3-BirA*. BirA*, BirA R118G variant. F GO enrichment analysis of the specific METTL16-interacting proteins. BP, biological process; CC, cellular component. G Representative confocal images showing the nucleolus in normal (CL48) and cancer (PCL/PRF/5) cells. H Statistical results of nucleolar numbers in normal cells and cancer cells (n > 40). I, J Representative confocal images (I) and the statistical results (J) showing the effects of METTL16 KO and rescued expression on nucleolar numbers in Huh7 cells (n > 50). K Representative confocal images showing the subnucleolar localization of METTL16 in Huh7 cells. FBL, DFC marker; NPM1, GC marker. L Pearson’s correlation analysis between METTL16 and FBL or NPM1 in Huh7 cells (n = 10; mean ± SD). M Simplified schematic of rRNA processing and the probes we used for Northern blotting and qPCR. N The effects of METTL16 KO and rescued expression on pre-rRNA levels in Huh7 cells as determined by qPCR (n = 3; mean ± SD). P1 was used to detect 47S pre-rRNA; while P2 was used to detect 47S, 45S, and 30S pre-rRNAs. O Representative images showing the effects of METTL16 KO and rescued expression on pre-rRNA levels as determined by Northern blotting in HepG2 cells. P Representative Co-IP images showing the direct interaction between METTL16 and DDX47, DDX49, or BOP1 in HepG2 cells. Q Representative confocal images showing the colocalization of METTL16 with DDX47, DDX49, or BOP1 in the nucleolus of Huh7 cells. Statistical analyses: unpaired t-test (B, C, H, J, L, N); ns, not significant; **P < 0.01, ***P < 0.001

References

    1. Llovet JM, Kelley RK, Villanueva A, et al. Hepatocellular carcinoma. Nat Rev Dis Primers. 2021;7:6. doi: 10.1038/s41572-020-00240-3. - DOI - PubMed
    1. Villanueva A. Hepatocellular carcinoma. N Engl J Med. 2019;380:1450–1462. doi: 10.1056/NEJMra1713263. - DOI - PubMed
    1. Nio K, Yamashita T, Kaneko S. The evolving concept of liver cancer stem cells. Mol Cancer. 2017;16:4. doi: 10.1186/s12943-016-0572-9. - DOI - PMC - PubMed
    1. Wang J, Yu H, Dong W, et al. N6-methyladenosine-mediated up-regulation of FZD10 regulates liver cancer stem cells' properties and lenvatinib resistance through WNT/β-catenin and hippo signaling pathways. Gastroenterology. 2023;164:990–1005. doi: 10.1053/j.gastro.2023.01.041. - DOI - PubMed
    1. Yu H, Zhou L, Loong JHC, et al. SERPINA12 promotes the tumorigenic capacity of HCC stem cells through hyperactivation of AKT/beta-catenin signaling. Hepatology. 2023;24:9173. - PubMed

Publication types