. 2024 Jan 9;27(2):108837.
doi: 10.1016/j.isci.2024.108837. eCollection 2024 Feb 16.

Long-term intermittent hypoxia in mice induces inflammatory pathways implicated in sleep apnea and steatohepatitis in humans

Affiliations

Long-term intermittent hypoxia in mice induces inflammatory pathways implicated in sleep apnea and steatohepatitis in humans

Jonathan Gaucher et al. iScience. .

Abstract

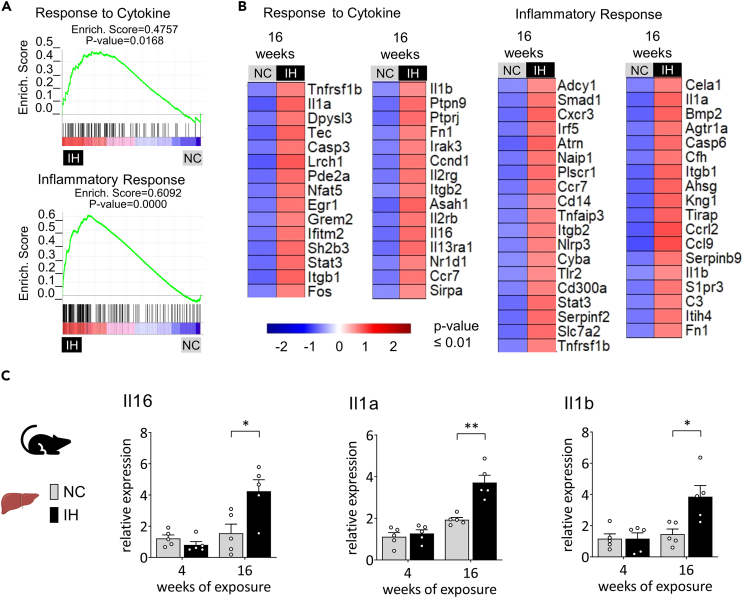
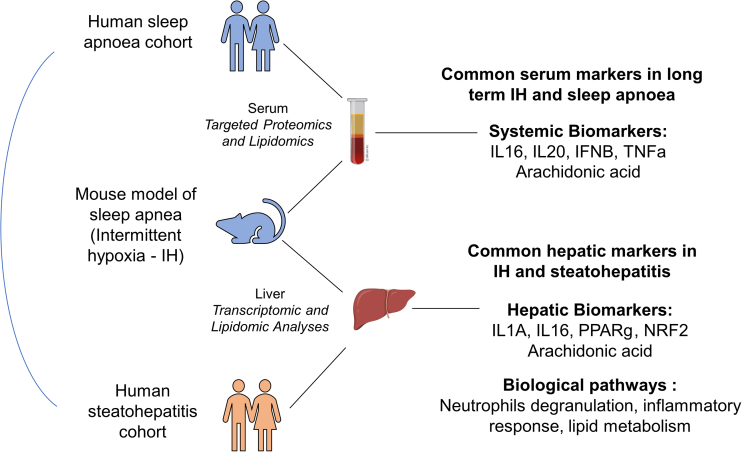
Obstructive sleep apnea (OSA) induces intermittent hypoxia (IH), an independent risk factor for non-alcoholic fatty liver disease (NAFLD). While the molecular links between IH and NAFLD progression are unclear, immune cell-driven inflammation plays a crucial role in NAFLD pathogenesis. Using lean mice exposed to long-term IH and a cohort of lean OSA patients (n = 71), we conducted comprehensive hepatic transcriptomics, lipidomics, and targeted serum proteomics. Significantly, we demonstrated that long-term IH alone can induce NASH molecular signatures found in human steatohepatitis transcriptomic data. Biomarkers (PPARs, NRFs, arachidonic acid, IL16, IL20, IFNB, TNF-α) associated with early hepatic and systemic inflammation were identified. This molecular link between IH, sleep apnea, and steatohepatitis merits further exploration in clinical trials, advocating for integrating sleep apnea diagnosis in liver disease phenotyping. Our unique signatures offer potential diagnostic and treatment response markers, highlighting therapeutic targets in the comorbidity of NAFLD and OSA.

Keywords: Animal physiology; Biological sciences; Human Physiology; Natural sciences; Physiology.


Conflict of interest statement

The authors declare no competing interests.

Figures

None
Graphical abstract
Figure 1
Figure 1
Hepatic transcriptomic signatures of long-term intermittent hypoxia in mice (A) Experimental design of mouse model of sleep apnea. Lean male mice fed with regular chow diet were exposed to 16 weeks of intermittent hypoxia (IH) or normoxic cycles (NC). (B) Body weight of mice exposed to intermittent hypoxia (IH, n = 15) and normoxic control (NC, n = 15) measured once a week over the time course of the experiment. Dark bars and circles are for NC mice and gray bars and triangles for IH mice. Body weight was presented as mean + standard error of mean (SEM). Significance was calculated per each time point using a Student’s t test and ∗∗∗ indicates a p value ≤0.001. (C) Fasted glycemia of mice exposed to intermittent hypoxia (IH, n = 15) and normoxic control (NC, n = 15) measured once a week over the time course of the experiment. Fasted glycemia was presented as mean + standard error of mean (SEM). Significance was calculated per each time point using a Student’s t test and ∗∗∗ indicates a p value ≤0.001. (D) Pie chart representing the number of differentially expressed genes in the liver after 16 weeks of IH. Upregulated genes are shown in red and downregulated genes are shown in blue. Genes were selected using a p value ≤0.01 indicating a significant difference between IH and NC. (E) Gene ontology (GO) analysis showing the top six biological processes enriched in upregulated genes upon IH (top) denoted in red and downregulated genes upon IH (bottom) represented in blue. The number of dysregulated genes in our transcriptome over the total number of genes for each GO category is indicated on the graph. On the left panel, genes were selected using a p value ≤0.01 indicating a significant difference between NC and IH and ranked GO were ranked per p value. On the right panel, the top 500 genes with the highest expression difference between IH and NC were selected and GO were ranked per p value.
Figure 2
Figure 2
Comparison of hepatic signatures of human NASH and mouse long-term IH (A) Venn diagrams representing the comparison of the top twenty GO biological processes ranked by p value enriched in the top 500 upregulated genes (red circles, left panel) or the top 500 downregulated genes (blue circles, right panel) in IH versus NC mice (dark blue and dark red circles) and NASH versus healthy humans (light blue and light red circles). The top 500 genes were selected using a p value ≤0.01. (B) Venn diagrams representing the upstream transcriptional regulators ranked by p value associated with the top 500 upregulated genes (red circles, left panel) or the top 500 downregulated genes (blue circles, right panel) in IH versus NC mice (dark blue and dark red circles) and NASH versus healthy humans (light blue and light red circles). The top 500 genes were selected using a p value ≤0.01.
Figure 3
Figure 3
IH reprograms fatty acid metabolism and PPARg-dependent gene expression (A) GSEA showing the enrichment of genes involved in mitochondrial fatty acid beta-oxidation and mitochondrial ATP synthesis coupled electron transport in the livers from the 16 weeks IH group. (B) Heatmap representing significant (p value ≤0.01) differentially expressed PPARg target genes in the livers from the 16 weeks IH group. (C) Representative expression of PPARg target and fatty acid metabolic genes determined by RT-qPCR at different length of IH exposure (4 and 16 weeks). Gene expression was normalized to beta-actin and presented as mean + standard error of mean (SEM, n = 4–5 biological replicates per group). Significance was calculated using a Student’s t test and ∗indicate a p value of 0.05. (D) Heatmap representing fatty acid profiles in the liver and serum of mice exposed to 16 weeks of IH determined by mass spectrometry. Each fatty acid abundance was calculated and normalized according to the internal standard and presented as mean + standard error of mean (SEM, n = 5 biological replicates per group). Significance was calculated using Student’s t test and ∗ indicates a p value ≤0.05. (E) Illustration depicting arachidonic acid metabolism and significant dysregulated fatty acid under IH and their link with inflammation.
Figure 4
Figure 4
IH fosters immune cell infiltration and activation in the liver (A) GSEA showing the enrichment leukocytes, neutrophils, monocytes, and lymphocytes-specific genes in the livers from the 16 weeks IH group. (B) Representative immunohistochemistry of the neutrophil marker MPO, monocytes marker CD68, and lymphocytes marker CD3 in liver biopsies at 4 and 16 weeks of IH exposure and their respective controls. A comparative observation of cell content in the liver sections from different groups was quantified and expressed as a number of positive cell staining per section area. Two slides per animal (n = 4–5) were analyzed and are presented as mean + standard error of mean (SEM). Statistical significance was calculated per each time point using a Student’s t test,∗,∗∗ and ∗∗∗ indicates respective p value ≤0.05, 0.01, and 0.001.
Figure 5
Figure 5
IH induces a set of hepatic inflammatory biomarkers (A) GSEA showing the enrichment of genes involved in response to cytokine and inflammatory response in the livers from the 16 weeks IH group. (B) Heatmap illustrating genes characterizing the response to cytokine and the inflammatory response significantly upregulated in the 16 weeks IH group (p-value ≤0.01). (C) Representative inflammatory markers expression determined by RT-qPCR at different length of IH exposure (4 and 16 weeks). Gene expression was normalized to beta-actin and presented as mean + standard error of mean (SEM, n = 4–5 biological replicates per group). Significance was calculated using a Student’s t test and ∗, ∗∗ indicates respective p value of 0.05 and 0.01.
Figure 6
Figure 6
Cytokine profiling of IH mice and OSA patients (A) Cytokine analysis was performed using serum from NC and IH mice collected after 4 or 16 weeks exposure (n = 5 biological replicates per time point per group). Results are displayed as a heatmap and significance was calculated using Student’s t test and ∗ indicates a p value ≤0.05. (B) Comparison of cytokines profiles from serum from IH mice and OSA patients. Data are shown as mean + standard error of mean (SEM). Significance was calculated using Student’s t test and ∗ indicates a p value ≤0.05.
Figure 7
Figure 7
Summary of findings Long-term IH in mice induces inflammatory pathways entangled in human sleep apnea and steatohepatitis.

References

    1. Benjafield A.V., Ayas N.T., Eastwood P.R., Heinzer R., Ip M.S.M., Morrell M.J., Nunez C.M., Patel S.R., Penzel T., Pépin J.L., et al. Estimation of the global prevalence and burden of obstructive sleep apnoea: a literature-based analysis. Lancet Respir. Med. 2019;7:687–698. - PMC - PubMed
    1. Lévy P., Kohler M., McNicholas W.T., Barbé F., McEvoy R.D., Somers V.K., Lavie L., Pépin J.L. Obstructive sleep apnoea syndrome. Nat. Rev. Dis. Primers. 2015;1 - PubMed
    1. Ryan S., Arnaud C., Fitzpatrick S.F., Gaucher J., Tamisier R., Pépin J.L. Adipose tissue as a key player in obstructive sleep apnoea. Eur. Respir. Rev. 2019;28 - PMC - PubMed
    1. Jullian-Desayes I., Trzepizur W., Boursier J., Joyeux-Faure M., Bailly S., Benmerad M., Le Vaillant M., Jaffre S., Pigeanne T., Bizieux-Thaminy A., et al. Obstructive sleep apnea, chronic obstructive pulmonary disease and NAFLD: an individual participant data meta-analysis. Sleep Med. 2021;77:357–364. - PubMed
    1. Aron-Wisnewsky J., Minville C., Tordjman J., Lévy P., Bouillot J.-L., Basdevant A., Bedossa P., Clément K., Pépin J.L. Chronic intermittent hypoxia is a major trigger for non-alcoholic fatty liver disease in morbid obese. J. Hepatol. 2012;56:225–233. - PubMed