. 2024 Jan 18:11:1339919.
doi: 10.3389/fnut.2024.1339919. eCollection 2024.

Characterization of exosomal microRNAs in preterm infants fed with breast milk and infant formula

Affiliations

Characterization of exosomal microRNAs in preterm infants fed with breast milk and infant formula

Eun-Bit Kim et al. Front Nutr. .

Abstract

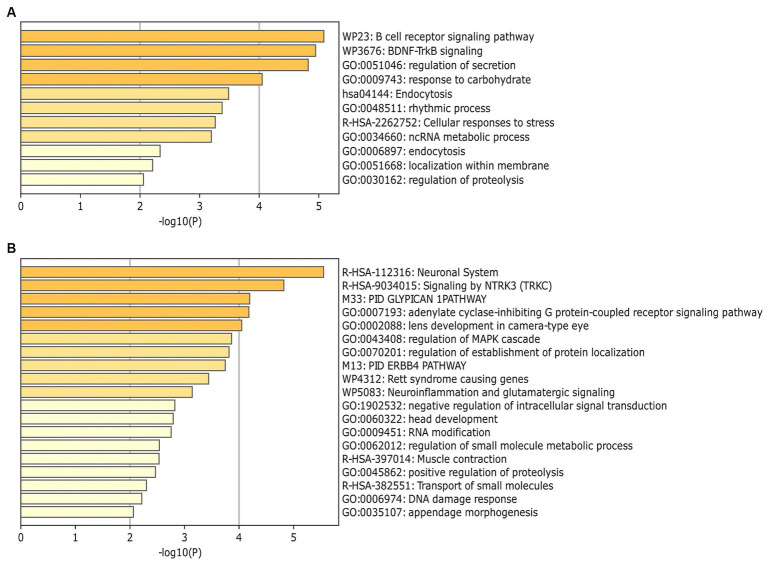
Breastfeeding not only reduces infection-related morbidity, but also increases growth of preterm infants. Advantages of breast milk (BM) for preterm infants are significant. They continue to be studied. However, because not all preterm infants can receive breastfeeding, bovine-based infant formula (IF) is used as an alternative, which may increase the risk of several preterm complications. Exosomes isolated from biofluids are emerging as biomarkers in research of various diseases. Here, we characterized miRNA contents of exosomes in urine and serum samples of preterm infants who were BM and IF fed and performed transcriptomic analysis of small RNA libraries. We identified significantly up-regulated 6 miRNAs and 10 miRNAs, respectively. Gene Ontology (GO) analysis revealed that target genes of these miRNAs might participate in neuronal development, immunity modulation, detoxification of reactive oxygen species, and transmembrane exchange. Our data suggest that exosome-based systemic screening for preterm infants with breastfeeding might be a screening tool for identifying target molecules involved in therapy for preterm infants in neonatal intensive care unit (NICU) and for future application as nutraceutical formulations or pharmaceuticals.

Keywords: breastfeeding; exosomes; miRNA; preterm infant; serum; small RNA sequencing; urine.


Conflict of interest statement

The authors declare that the research was conducted in the absence of any commercial or financial relationships that could be construed as a potential conflict of interest.

Figures

Figure 1
Figure 1
Experimental overview and bioinformatic pipeline (lower pink arrow) of this study.
Figure 2
Figure 2
Morphological characterization of isolated exosomes. (A) Transmission electron microscopy (TEM) image revealing the morphology of exosomes and presence of vesicles with sizes under 200 nm. (B) Size distribution of exosomes measured with a Nanosight NS300 (NTA). The peak of the particle size was 82 nm for urine exosomes and 86 nm for serum exosomes. (C) Expression levels of exosomal membrane marker CD9 (Cluster of Differential 9) and endoplasmic reticulum marker CALNEXIN in isolated vesicles were determined by western blotting.
Figure 3
Figure 3
Volcano plots (A,C) of differentially expressed urine and serum exosomal miRNAs in the two groups using DESeq2 for data analysis. The log2 fold change (log2 FC) indicates difference of comparison, while −log10 (p-value) shows the level of significance of each miRNA between two groups. |Fold change| ≥ 2 and p-value < 0.05 were used to identify differentially expressed miRNAs between the two groups. Differences were visualized using R 3.6.1 (www.r-project.org). The heatmap (B,D) of DEmiRNAs was constructed using “pheatmap” R package (Kolde, Raivo (2019). Pheatmap: Pretty Heatmaps. R package version 1.0.12. https://CRAN.R-project.org/package=pheatmap).
Figure 4
Figure 4
Identification of enrichment ontology (GO and KEGG) terms of miRNA-target genes. (A) Top 10 enriched terms of differentially expressed miRNAs (DEmiRNA) associated genes (colored by p-values) in urine comparison between BM and IF groups. (B) Top 20 enrichment analysis for target of DEmiRNAs in serum comparison between BM and IF groups. Heatmaps of (A,B) were produced via Metascape (https://metascape.org).
Figure 5
Figure 5
Clusters of proteins generated by clusterMaker 2.0 Cytoscape application with the gLay option. They were derived from protein–protein interaction (PPI) network. Central nodes (gray) represent proteins with higher numbers of interactions. Clusters in urine and serum samples were filtered with a False Discovery Rate (FDR) < 0.05 (Benjaminin Hockberg correction).

References

    1. WHO . WHO: recommended definitions, terminology and format for statistical tables related to the perinatal period and use of a new certificate for cause of perinatal deaths. Modifications recommended by FIGO as amended October 14, 1976. Acta Obstet Gynecol Scand. (1977) 56:247–53. - PubMed
    1. Rubens CE, Sadovsky Y, Muglia L, Gravett MG, Lackritz E, Gravett C. Prevention of preterm birth: harnessing science to address the global epidemic. Sci Transl Med. (2014) 6:262sr5. doi: 10.1126/scitranslmed.3009871 - DOI - PubMed
    1. Avila-Alvarez A, Boga AS, Bermúdez-Hormigo C, Carballal JF. Extrauterine growth restriction among neonates with a birthweight less than 1,500 grams. Anales De Pediatria. (2018) 89:325–32. doi: 10.1016/j.anpedi.2018.02.004 - DOI - PubMed
    1. Coskun D, Gunay U. The effects of kangaroo care applied by Turkish mothers who have premature babies and cannot breastfeed on their stress levels and amount of Milk production. J Pediatr Nurs. (2020) 50:e26–32. doi: 10.1016/j.pedn.2019.09.028 - DOI - PubMed
    1. Cristofalo EA, Schanler RJ, Blanco CL, Sullivan S, Trawoeger R, Kiechl-Kohlendorfer U, et al. Randomized trial of exclusive human milk versus preterm formula diets in extremely premature infants. J Pediatr. (2013) 163:1592–1595.e1. doi: 10.1016/j.jpeds.2013.07.011, PMID: - DOI - PubMed