

SARS-CoV-2-associated T-cell infiltration in the central nervous system
- PMID: 38304555
- PMCID: PMC10831126
- DOI: 10.1002/cti2.1487
SARS-CoV-2-associated T-cell infiltration in the central nervous system
Abstract
Objectives: Infection with severe acute respiratory syndrome coronavirus 2 (SARS-CoV-2) causes coronavirus disease 2019 (COVID-19). Although an acute SARS-CoV-2 infection mainly presents with respiratory illness, neurologic symptoms and sequelae are increasingly recognised in the long-term treatment of COVID-19 patients. The pathophysiology and the neuropathogenesis behind neurologic complications of COVID-19 remain poorly understood, but mounting evidence points to endothelial dysfunction either directly caused by viral infection or indirectly by inflammatory cytokines, followed by a local immune response that may include virus-specific T cells. However, the type and role of central nervous system-infiltrating T cells in COVID-19 are complex and not fully understood.
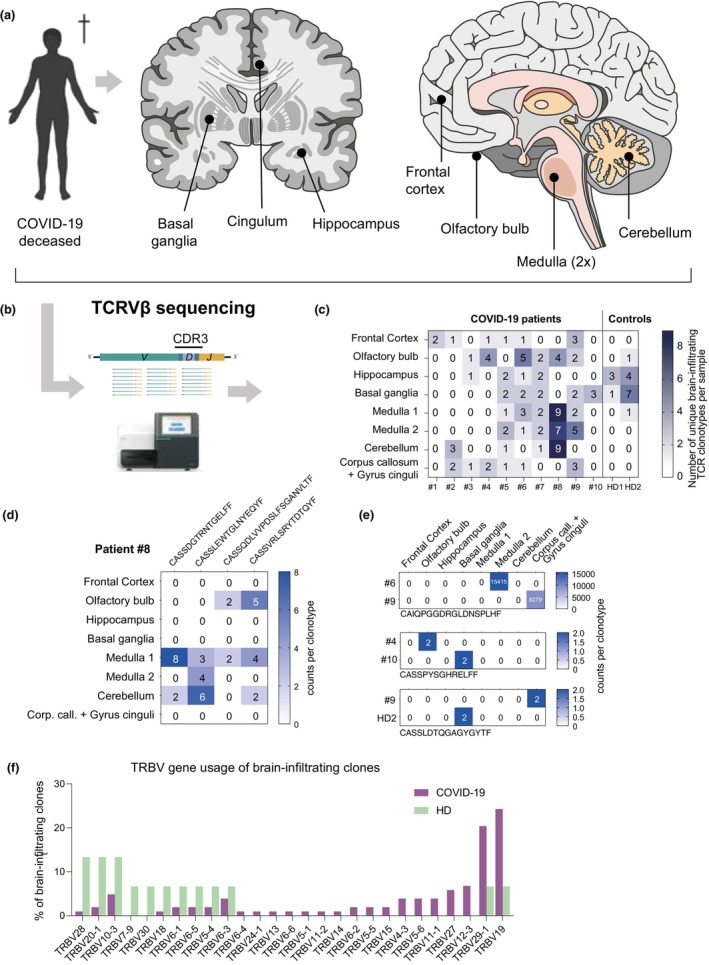
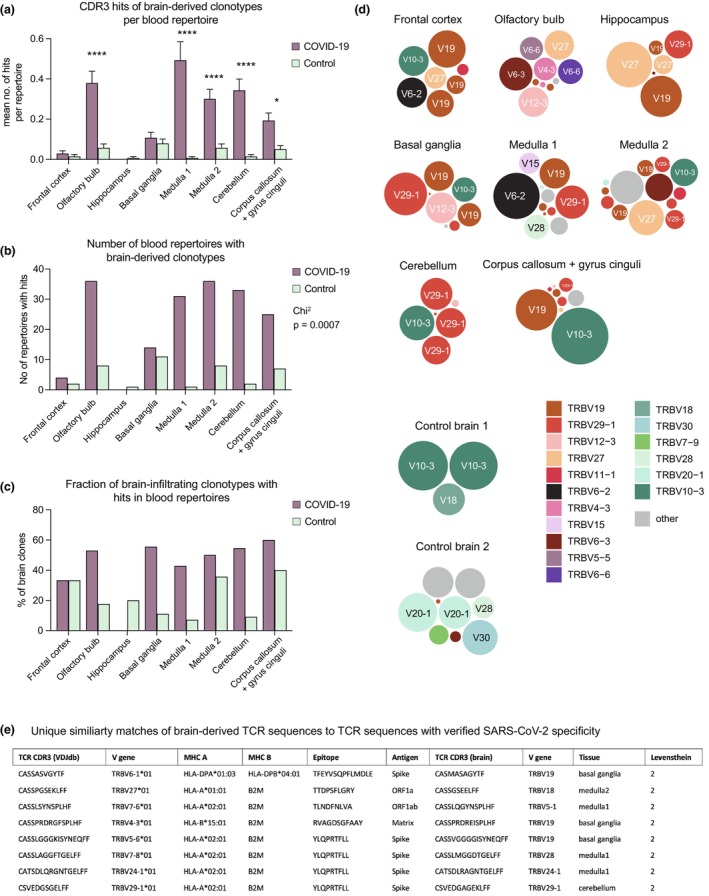
Methods: We analysed distinct anatomical brain regions of patients who had deceased as a result of COVID-19-associated pneumonia or complications thereof and performed T cell receptor Vβ repertoire sequencing. Clonotypes were analysed for SARS-CoV-2 association using public TCR repertoire data.
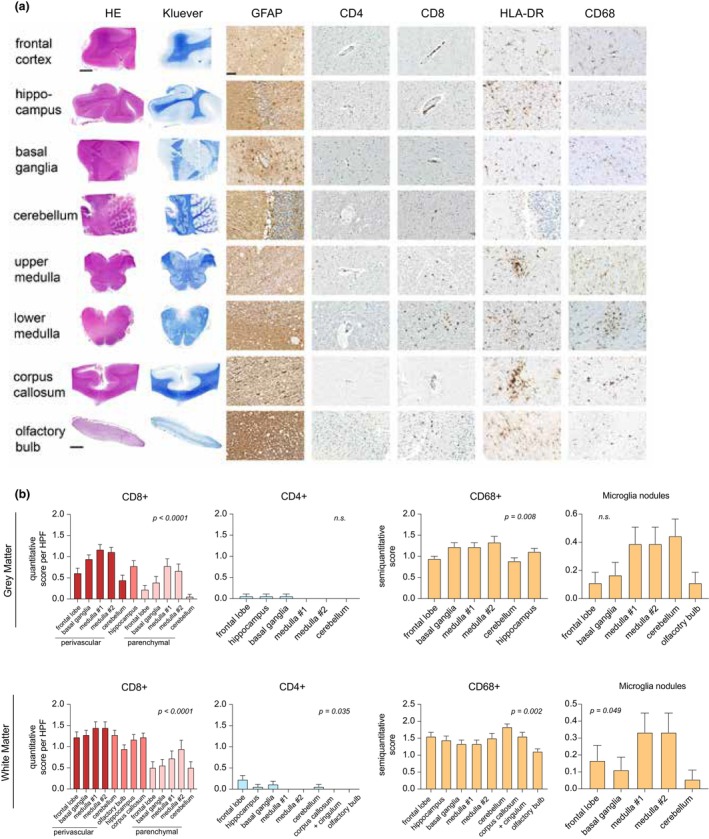
Results: Our descriptive study demonstrates that SARS-CoV-2-associated T cells are found in almost all brain areas of patients with fatal COVID-19 courses. The olfactory bulb, medulla and cerebellum were brain regions showing the most SARS-CoV-2 specific sequence patterns. Neuropathological workup demonstrated primary CD8+ T-cell infiltration with a perivascular infiltration pattern.
Conclusion: Future research is needed to better define the relationship between T-cell infiltration and neurological symptoms and its long-term impact on patients' cognitive and mental health.
Keywords: COVID‐19; COVID‐19‐specific T cell; SARS‐CoV‐2; TCR sequencing; central nervous system; neuroinflammation.
© 2024 The Authors. Clinical & Translational Immunology published by John Wiley & Sons Australia, Ltd on behalf of Australian and New Zealand Society for Immunology, Inc.
Conflict of interest statement
The authors declare no conflict of interest.
Figures
Similar articles
-
Profiling of T Cell Repertoire in SARS-CoV-2-Infected COVID-19 Patients Between Mild Disease and Pneumonia.J Clin Immunol. 2021 Aug;41(6):1131-1145. doi: 10.1007/s10875-021-01045-z. Epub 2021 May 5. J Clin Immunol. 2021. PMID: 33950324 Free PMC article.
-
Utility of Bulk T-Cell Receptor Repertoire Sequencing Analysis in Understanding Immune Responses to COVID-19.Diagnostics (Basel). 2022 May 13;12(5):1222. doi: 10.3390/diagnostics12051222. Diagnostics (Basel). 2022. PMID: 35626377 Free PMC article. Review.
-
Neuropathology of patients with COVID-19 in Germany: a post-mortem case series.Lancet Neurol. 2020 Nov;19(11):919-929. doi: 10.1016/S1474-4422(20)30308-2. Epub 2020 Oct 5. Lancet Neurol. 2020. PMID: 33031735 Free PMC article.
-
Review of Neurological Manifestations of SARS-CoV-2.Cureus. 2023 Apr 27;15(4):e38194. doi: 10.7759/cureus.38194. eCollection 2023 Apr. Cureus. 2023. PMID: 37257164 Free PMC article. Review.
-
Central nervous system complications associated with SARS-CoV-2 infection: integrative concepts of pathophysiology and case reports.J Neuroinflammation. 2020 Aug 6;17(1):231. doi: 10.1186/s12974-020-01896-0. J Neuroinflammation. 2020. PMID: 32758257 Free PMC article. Review.
Cited by
-
Neuroimmune pathophysiology of long COVID.Psychiatry Clin Neurosci. 2025 Jun 19:10.1111/pcn.13855. doi: 10.1111/pcn.13855. Online ahead of print. Psychiatry Clin Neurosci. 2025. PMID: 40536011 Free PMC article.
References
LinkOut - more resources
Full Text Sources
Research Materials
Miscellaneous