. 2024 Feb 15;38(3):e23448.
doi: 10.1096/fj.202302003R.

Multi-organ single-cell RNA sequencing in mice reveals early hyperglycemia responses that converge on fibroblast dysregulation

Affiliations

Multi-organ single-cell RNA sequencing in mice reveals early hyperglycemia responses that converge on fibroblast dysregulation

Adam T Braithwaite et al. FASEB J. .

Abstract

Diabetes causes a range of complications that can affect multiple organs. Hyperglycemia is an important driver of diabetes-associated complications, mediated by biological processes such as dysfunction of endothelial cells, fibrosis, and alterations in leukocyte number and function. Here, we dissected the transcriptional response of key cell types to hyperglycemia across multiple tissues using single-cell RNA sequencing (scRNA-seq) and identified conserved, as well as organ-specific, changes associated with diabetes complications. By studying an early time point of diabetes, we focus on biological processes involved in the initiation of the disease, before the later organ-specific manifestations had supervened. We used a mouse model of type 1 diabetes and performed scRNA-seq on cells isolated from the heart, kidney, liver, and spleen of streptozotocin-treated and control male mice after 8 weeks and assessed differences in cell abundance, gene expression, pathway activation, and cell signaling across organs and within organs. In response to hyperglycemia, endothelial cells, macrophages, and monocytes displayed organ-specific transcriptional responses, whereas fibroblasts showed similar responses across organs, exhibiting altered metabolic gene expression and increased myeloid-like fibroblasts. Furthermore, we found evidence of endothelial dysfunction in the kidney, and of endothelial-to-mesenchymal transition in streptozotocin-treated mouse organs. In summary, our study represents the first single-cell and multi-organ analysis of early dysfunction in type 1 diabetes-associated hyperglycemia, and our large-scale dataset (comprising 67 611 cells) will serve as a starting point, reference atlas, and resource for further investigating the events leading to early diabetic disease.

Keywords: RRID:IMSR_JAX:000664; RRID:SCR_001618; RRID:SCR_001905; RRID:SCR_007322; RRID:SCR_019010; RRID:SCR_021946; RRID:SCR_022146; RRID:SCR_022254; endothelial cells; fibrosis; gene expression; hyperglycemia; mice; monocytes; myofibroblast; single-cell RNA-seq; streptozotocin; type 1 diabetes.


Figures

FIGURE 1
FIGURE 1
Multi‐organ single‐cell transcriptome profiles from hyperglycemic and control mice. (A) Single‐cell profiles from all organs were integrated and cells clustered. t‐distributed stochastic neighbor‐embedding (tSNE) plots show a matched number of cells from each condition. (B) Average expression of key marker genes that were used to annotate specific cell clusters and sub‐clusters. (C) The relative functional proximity of clusters was demonstrated by building a classification hierarchy with transcriptionally similar clusters adjacent to a tree. Dend, myeloid dendritic cell; Endo, endothelial cell; Epi, epithelial cell; Fib, fibroblast; Mac, macrophage; Mono, monocyte.
FIGURE 2
FIGURE 2
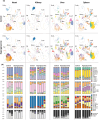
Cell‐type profiles are organ specific but relatively stable across conditions. (A) Annotated cells split by tissue of origin and group. t‐distributed stochastic neighbor‐embedding (tSNE) plots show a matched number of cells from each condition per tissue. (B) Cell sub‐clusters summarized by general type (lymphoid, myeloid, or other cells) and relative cell proportions are indicated in one column per mouse. Dend, myeloid dendritic cell; Endo, endothelial cell; Epi, epithelial cell; Fib, fibroblast; Mac, macrophage; Mono, monocyte.
FIGURE 3
FIGURE 3
Transcriptional responses to hyperglycemia converge on fibroblasts. (A) Pseudo‐bulk RNA‐sequencing profiles were generated for each mouse/tissue/cell type by summing reads per gene per sample. The variation of gene expression for each pseudo‐bulk profile was calculated using the top 150 most variable genes and visualized for the first two principal components. Each point represents summed cells from one mouse. (B–E) For key cell types, common significant differentially expressed genes (STZ vs. control; adjusted p < .05 and log2FC >0.1) were assessed across organs. Upset plots show distinct and shared differential genes from (B) endothelial cells, (C) macrophages, (D), monocytes, and (E) fibroblasts, per organ. Heatmaps show +/− log10 (adjusted p‐value) of significantly enriched pathways from over‐representation analysis of Reactome pathways using each distinct and shared differential set of up‐ and downregulated genes (log2FC >0.1, p < .05) per organ (with no enriched pathways found in monocytes). Endo, endothelial cell; Fib, fibroblast; Mac, macrophage; Mono, monocyte.
FIGURE 4
FIGURE 4
Hyperglycemia induces myeloid‐like fibroblasts. (A) Overall proportion of Lyz2+ fibroblasts when combining all cells from each organ/group. (B) Dot plots representing expression of key marker genes within Lyz2+ and Lyz2 mice fibroblasts by organ. Circle color represents average expression across cells, and circle size represents the percentage of cells positive for gene expression. (C) Top 50 differentially expressed genes (when ranked by maximum log2FC) comparing Lyz2+ and Lyz2 fibroblasts from each organ. Significantly differentially expressed genes (adjusted p < .05) are colored, with color representing log2FC (trimmed to ±0.6 for visualization). (D) Top 50 enriched Reactome pathways (when ranked by mean normalized enrichment score; NES) from gene set enrichment analysis of differentially expressed genes in Lyz2+ versus Lyz2 fibroblasts. Significantly enriched pathways (adjusted p < .05) are colored, with color representing NES (trimmed to ±3 for visualization). Volcano plots show differentially expressed genes from bulk RNA sequencing of STZ versus control mice bone‐marrow‐derived macrophages, either (E) unstimulated or (F) stimulated with interferon‐γ and lipopolysaccharide. Key fibroblast genes are highlighted.
FIGURE 5
FIGURE 5
Decorin is dysregulated across cells and is linked with human type 1 diabetes. (A) The top 25 genes as ranked based on the frequency of significant differential expression (STZ vs. control) across all organ/cell types (for those with >150 total cells). Significantly differentially expressed genes (adjusted p < .05) are colored, with color representing log2FC (trimmed to ±1 for visualization). (B) Association of eQTLs for decorin with human type 1 diabetes traits was assessed by two‐sample Mendelian randomization. Odds ratio is plotted with bars representing lower and upper confidence intervals. DCN, decorin; Dend, myeloid dendritic cell; Endo, endothelial cell; Epi, epithelial cell; Fib, fibroblast; Mac, macrophage; Mono, monocyte; Neut, neutrophil.
FIGURE 6
FIGURE 6
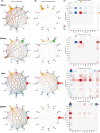
Cellular communication indicates fibroblast activation. Signaling interaction scores were evaluated by expression of ligand/receptor pairs in cells within each organ using CellChat and circle diagrams represent (A) interaction number and (B) interaction strength (adjusted according to cell number in the STZ condition). (C) The predicted strength of interactions between cell types per organ was then compared between STZ and control mice and summarized as a heatmap, with colors representing differential interaction strength. Dend, myeloid dendritic cell; Endo, endothelial cell; Epi, epithelial cell; Fib, fibroblast; Mac, macrophage; Mono, monocyte; Neut, neutrophil; PD, plasmacytoid dendritic cell.

References

    1. Stirban A, Gawlowski T, Roden M. Vascular effects of advanced glycation endproducts: clinical effects and molecular mechanisms. Mol Metab. 2013;3:94‐108. - PMC - PubMed
    1. Giacco F, Brownlee M. Oxidative stress and diabetic complications. Circ Res. 2010;107:1058‐1070. - PMC - PubMed
    1. Tsalamandris S, Antonopoulos AS, Oikonomou E, et al. The role of inflammation in diabetes: current concepts and future perspectives. Eur Cardiol Rev. 2019;14:50‐59. - PMC - PubMed
    1. Abebe W, Mozaffari M. Endothelial dysfunction in diabetes: potential application of circulating markers as advanced diagnostic and prognostic tools. EPMA J. 2010;1:32‐45. - PMC - PubMed
    1. Ban CR, Twigg SM. Fibrosis in diabetes complications: pathogenic mechanisms and circulating and urinary markers. Vasc Health Risk Manag. 2008;4:575‐596. - PMC - PubMed

Publication types