. 2024 Feb 2;147(1):28.
doi: 10.1007/s00401-023-02675-w.

Neuroinflammatory disease signatures in SPG11-related hereditary spastic paraplegia patients

Affiliations

Neuroinflammatory disease signatures in SPG11-related hereditary spastic paraplegia patients

Laura Krumm et al. Acta Neuropathol. .

Abstract

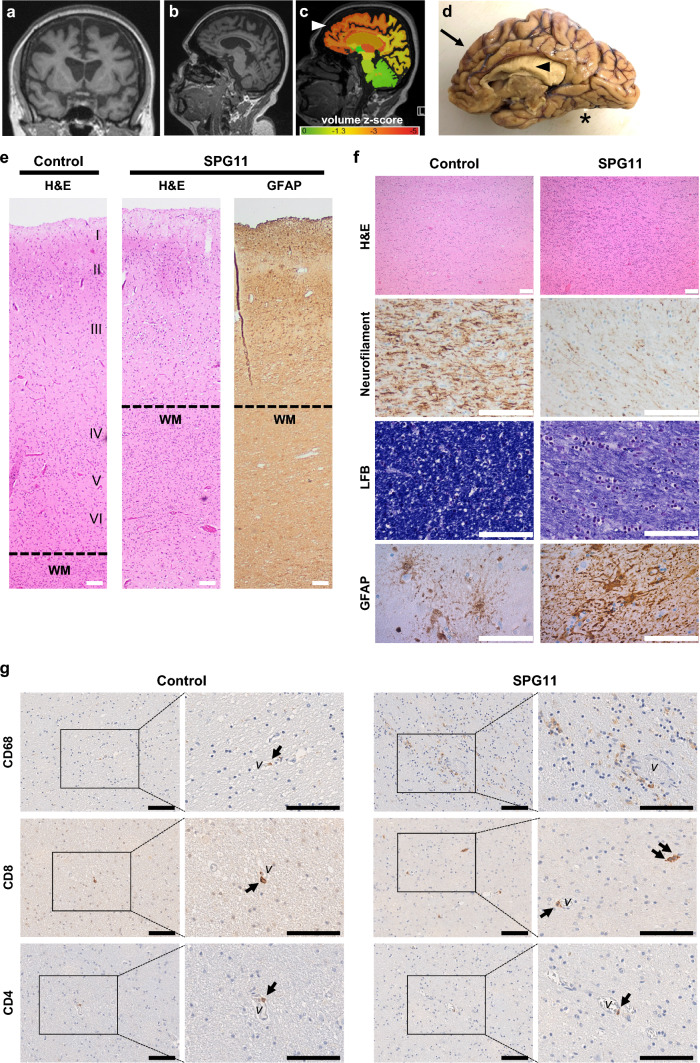
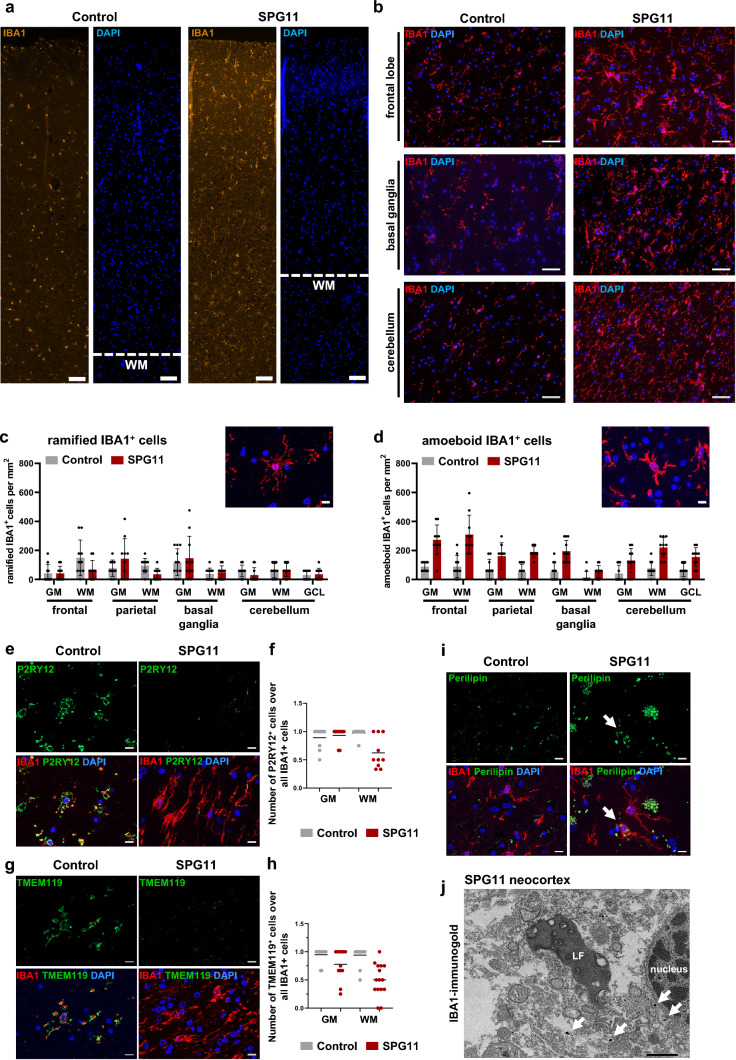
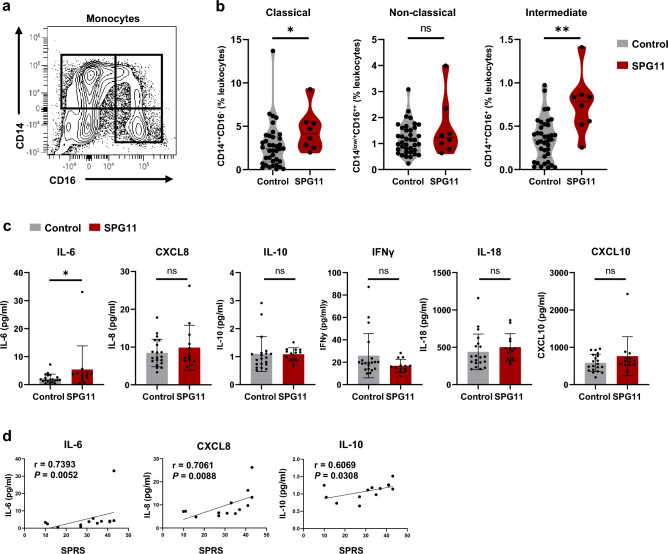
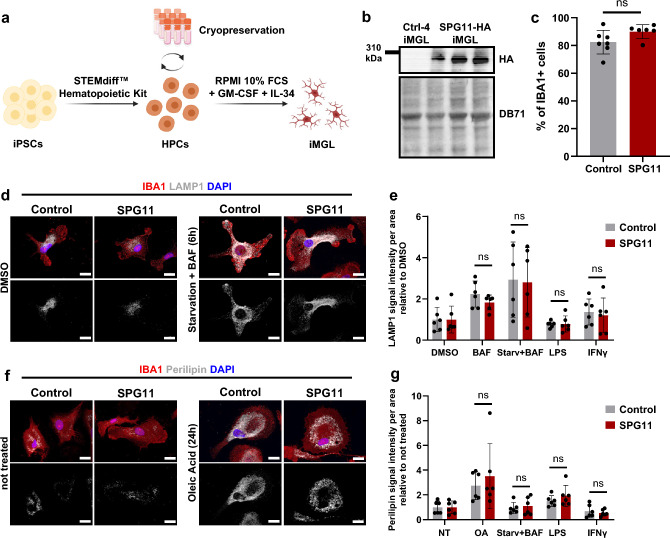
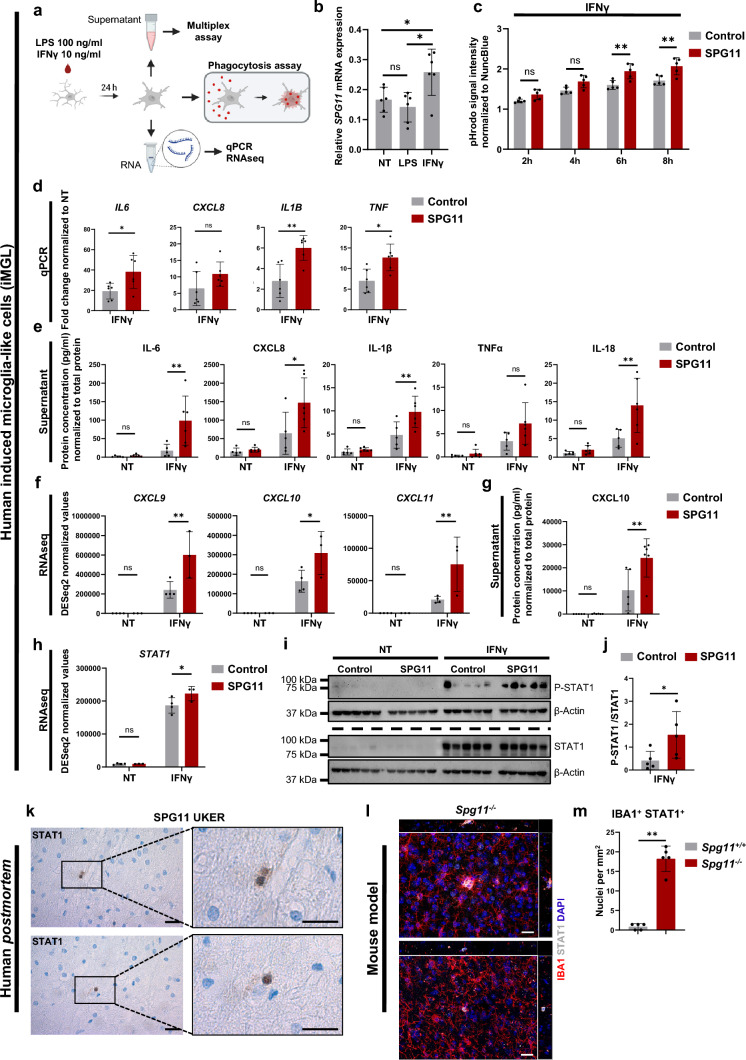
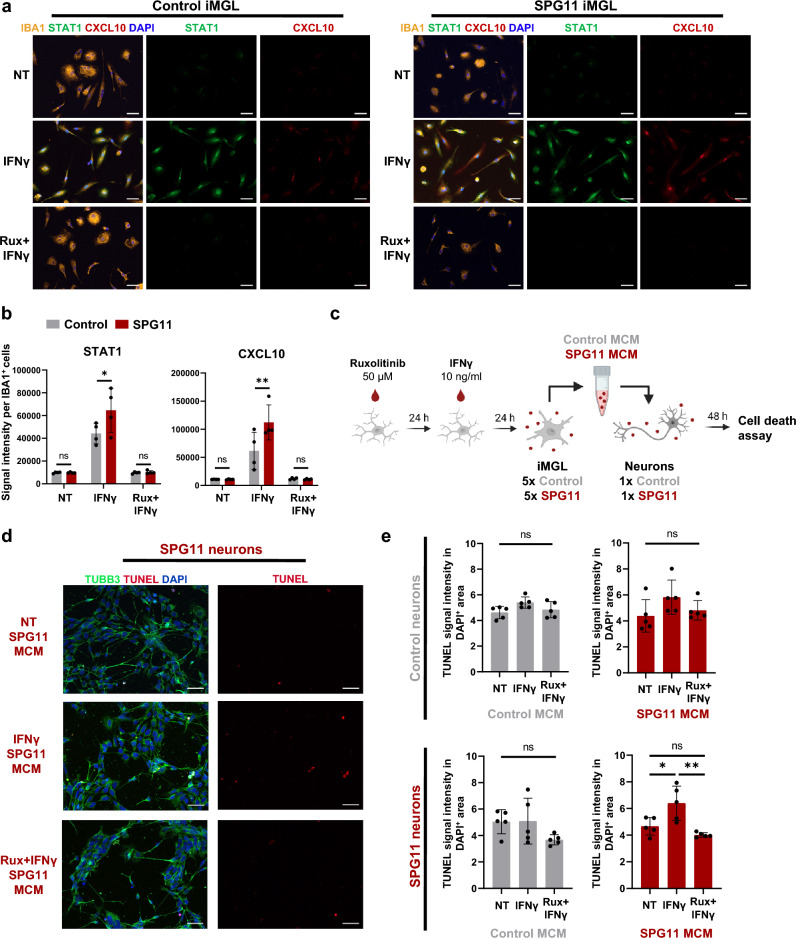
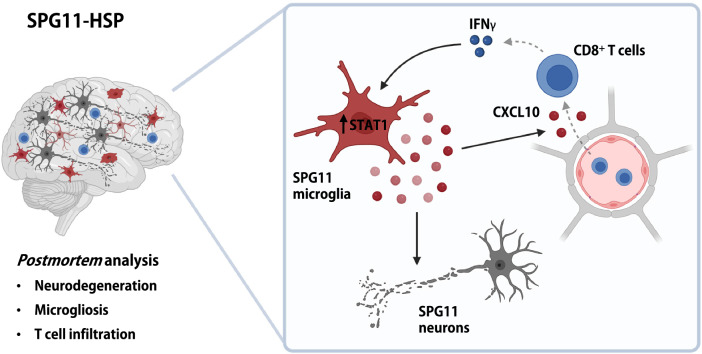
Biallelic loss of SPG11 function constitutes the most frequent cause of complicated autosomal recessive hereditary spastic paraplegia (HSP) with thin corpus callosum, resulting in progressive multisystem neurodegeneration. While the impact of neuroinflammation is an emerging and potentially treatable aspect in neurodegenerative diseases and leukodystrophies, the role of immune cells in SPG11-HSP patients is unknown. Here, we performed a comprehensive immunological characterization of SPG11-HSP, including examination of three human postmortem brain donations, immunophenotyping of patients' peripheral blood cells and patient-specific induced pluripotent stem cell-derived microglia-like cells (iMGL). We delineate a previously unknown role of innate immunity in SPG11-HSP. Neuropathological analysis of SPG11-HSP patient brain tissue revealed profound microgliosis in areas of neurodegeneration, downregulation of homeostatic microglial markers and cell-intrinsic accumulation of lipids and lipofuscin in IBA1+ cells. In a larger cohort of SPG11-HSP patients, the ratio of peripheral classical and intermediate monocytes was increased, along with increased serum levels of IL-6 that correlated with disease severity. Stimulation of patient-specific iMGLs with IFNγ led to increased phagocytic activity compared to control iMGL as well as increased upregulation and release of proinflammatory cytokines and chemokines, such as CXCL10. On a molecular basis, we identified increased STAT1 phosphorylation as mechanism connecting IFNγ-mediated immune hyperactivation and SPG11 loss of function. STAT1 expression was increased both in human postmortem brain tissue and in an Spg11-/- mouse model. Application of an STAT1 inhibitor decreased CXCL10 production in SPG11 iMGL and rescued their toxic effect on SPG11 neurons. Our data establish neuroinflammation as a novel disease mechanism in SPG11-HSP patients and constitute the first description of myeloid cell/ microglia activation in human SPG11-HSP. IFNγ/ STAT1-mediated neurotoxic effects of hyperreactive microglia upon SPG11 loss of function indicate that immunomodulation strategies may slow down disease progression.

Keywords: Autosomal-recessive hereditary spastic paraplegia; Disease-associated microglia; IFNγ/ STAT1 signaling; Induced microglia-like cells; Inflammation; Multisystem neurodegeneration.


Conflict of interest statement

The authors report no competing interests.

Figures

Fig. 1
Fig. 1
Neurodegeneration and immune cell activation in SPG11 postmortem brain tissue. a–c MRI of SPG11 (UKER) patient acquired 5 years before death, demonstrating a severe frontoparietal and callosal atrophy on a coronal, b parasagittal and c morphometric analysis, with red indicating lower brain volume (arrowhead). d Macroscopic medial view of the postmortem brain of the UKER patient with an arrow indicating frontal and parietal atrophy and arrowhead indicating thinning of the corpus callosum. *cerebellum was removed. e Neuropathological characterization showing profound atrophy of the parietal cortex on H&E predominantly involving layers III–VI along with reactive astrogliosis (GFAP) compared to a representative control tissue derived from an age- and sex-matched individual deceased without neurological disorder. Scale bar: 100 µm. f Internal capsule of SPG11 brain displaying increased cell numbers (H&E) and loss of neurofilament protein and myelin (LFB), as compared to the matched control. Astrogliosis (GFAP) is present within the putamen. Scale bar 100 µm. g Increase in CD68+ myeloid cells and CD8+ cells in SPG11, whereas CD4+ cells were exclusively observed in proximity to the vasculature (v) in the capsula interna of the SPG11 tissue. Scale bar 100 µm. WM white matter; LFB luxol fast blue
Fig. 2
Fig. 2
Activation of myeloid cells and cell-intrinsic SPG11 pathology. a Representative immunofluorescence for IBA1 and DAPI of the cortex of one control without neurological disease and the SPG11 (UKER) patient. Scale bar 100 µm. b Representative immunofluorescence for IBA1 and DAPI in different postmortem brain regions. Scale bar 50 µm. c + d Density of IBA1+ cells with ramified c or amoeboid d morphology comparing control and SPG11 in different brain regions, manually quantified per mm2 from two sections per condition according to depicted example images. Each dot represents one randomly selected field of view, analyzed blinded for genotype. Data presented as mean ± SD. Scale bars 10 µm. e Representative immunofluorescence images of the frontal lobe white matter (WM), stained for P2RY12 and IBA1 demonstrating fewer P2RY12+ cells in SPG11 compared to the control. Scale bar 10 µm. f Ratio of P2RY12+ over all IBA1+ myeloid cells in WM and grey matter (GM). Each dot represents cell counts from one field of view (0.014 mm2). Data presented as mean. n = 10. g Representative immunofluorescence images of frontal lobe WM, stained for TMEM119 and IBA1 demonstrating fewer TMEM119+ cells in SPG11 compared to control. Scale bar 10 µm. h Ratio of TMEM119+ over all IBA1+ myeloid cells in GM and WM. Each dot represents cell counts from one field of view (0.014 mm2). Data presented as mean. n = 10. i Representative immunofluorescence for IBA1 and perilipin in control and SPG11 cortex, demonstrating perilipin accumulation within an SPG11 IBA1+ myeloid cell (arrow). Scale bar 10 µm. j Ultrastructural evaluation of SPG11 frontal cortex showing abundant lipofuscin (LF) granules within a myeloid cell labeled with IBA1-immunogold (arrows). Scale bar 2 µm. GM grey matter; WM white matter; GCL granular cell layer; LF lipofuscin
Fig. 3
Fig. 3
Evaluation of peripheral inflammation in additional SPG11–HSP patients. a Flow cytometric (FC) gating strategy to divide monocytes into classical CD14++CD16 (upper left), non-classical CD14low/+CD16++ (bottom right) and intermediate CD14++CD16+ (upper right) subpopulations. b Quantification of classical (CD14++CD16), non-classical (CD14low/+CD16++) and intermediate (CD14++CD16+) monocytes in the peripheral blood as a percentage of total leukocytes, obtained by FC analysis of PBMCs derived from SPG11 patients and controls. n(SPG11) = 8, n(control) = 38. ns P > 0.05, *P < 0.05, **P < 0.01, according to a non-parametric Mann–Whitney U test. c Cytokine concentrations in the serum of controls (grey) and SPG11–HSP patients (red) measured by MSD multiplex immunoassay. ns P > 0.05, * P < 0.05, according to a non-parametric Mann–Whitney U test. Data presented as mean ± SD. n(SPG11) = 13, n(control) = 20. d Correlation of serum cytokine concentrations in SPG11–HSP patients with clinical SPRS values. Correlation coefficients r and P value according to a Spearman correlation. FC Flow cytometry, SPRS spastic paraplegia rating scale, ns not significant
Fig. 4
Fig. 4
SPG11 iPSCs efficiently differentiate into induced microglia-like cells (iMGL) without excessive lysosome or lipid accumulation. a Schematic representation of iPSC differentiation into iMGL via the HPC state. HPCs were generated using STEMdiff™ Hematopoietic Kit and cryopreserved. Further differentiation into iMGL was performed for 2 weeks in RPMI containing 10% FCS, 10 ng/mL GM–CSF and 50 ng/ml IL-34. b Immunoblotting of a bi-allelic HA-tagged SPG11 iPSC line that was differentiated into iMGL (SPG11-HA iMGL) using an antibody against HA. Three biological replicates of SPG11–HA are depicted. The HA-tag was detected at the size of spatacsin (~ 280 kDa) and was absent in the parental non-tagged iMGL control line (Ctrl-4). Total protein was stained by DB71 as a loading control. c Percentage of IBA1+ cells determined by FC analysis. Each dot represents one cell line. Data are presented as mean ± SD. n(SPG11) = 6, n(control) = 7. ns P > 0.05, according to a non-parametric Mann–Whitney U test. d Representative immunofluorescence of control and SPG11 iMGL for IBA1 and LAMP1. Left: vehicle-treated control and SPG11 iMGL. Right: iMGL were starved by serum depletion for 24 h in addition to BafilomycinA1 treatment (100 nM for 6 h). Scale bar: 10 µm. e LAMP1 fluorescence signal intensity, normalized to DMSO control. LPS: 100 ng/µl for 24 h. IFNγ: 10 ng/µl for 24 h. Each dot represents the mean normalized signal intensity per cell line (derived from ten images per line); bars represent mean ± SD. n = 6. ns P > 0.05, according to a two-way ANOVA with Bonferroni’s multiple comparison test. f Representative immunofluorescence of control and SPG11 iMGL for IBA1 and perilipin, both unstimulated and after exposure with Oleic acid (200 µM for 24 h). Scale bar: 10 µm. g Perilipin fluorescence signal intensity, normalized to untreated controls. Control iMGL are depicted in grey and SPG11 iMGL in red. Each dot represents the mean perilipin signal intensity per cell line (derived from ten images per line); bars represent mean ± SD. n = 6. ns P > 0.05, according to a two-way ANOVA with Bonferroni’s multiple comparison test. iPSC induced pluripotent stem cells; iMGL induced microglia-like cells; HPC hematopoietic stem cells; FCS fetal calf serum; FC Flow cytometry; ns not significant; BAF BafilomycinA1; LPS Lipopolysaccharide; OA Oleic Acid; Starv Starvation; NT non-treated
Fig. 5
Fig. 5
Increased STAT1-dependent IFNγ signaling in SPG11 microglia results in excessive upregulation of proinflammatory cytokines and chemokines. a Schematic representation of the experimental paradigm. iMGL were treated with LPS (100 ng/ml) or IFNγ (10 ng/ml) for 24 h before supernatants, RNA expression or phagocytosis were analyzed. b In control iMGL, relative expression of SPG11 mRNA is upregulated upon IFNγ but not LPS stimulation. n = 6. Data are presented as mean ± SD. P value according to one-way ANOVA with Bonferroni’s multiple comparison test. c Signal intensity of bacterial pHrodo particles in IFNγ treated control (grey) and SPG11 (red) iMGL, normalized to cell density measured by NuncBlue. Fluorescence signal was measured at 2 h, 4 h, 6 h and 8 h after incubation with bacterial particles. n = 5. P value according to a two-way ANOVA with Bonferroni’s multiple comparison test. d Relative gene expression of IFNγ treated control (grey) and SPG11 (red) iMGL normalized to the expression of the untreated condition for each line. n = 6. Each data point represents the mean derived from two independent technical replicates. Each bar indicates the mean ± SD for each condition. P value according to a non-parametric Mann–Whitney U test. e + g Cytokine concentrations in the supernatant of untreated vs. IFNγ treated control and SPG11 iMGL normalized to total protein. n(control) = 5; n(SPG11) = 6. Data are presented as mean ± SD. P value according to a two-way ANOVA with Bonferroni’s multiple comparison test. f + h DESeq2 normalized gene expression values of untreated and IFNγ treated iMGL (control in grey and SPG11 in red). n(control) = 4; n(SPG11) = 3. Data presented as mean ± SD. P value according to a two-way ANOVA with Bonferroni’s multiple comparison test. i Immunoblotting of control and SPG11 iMGL, untreated or treated with IFNγ: 10 ng/µl for 24 h, using antibodies against phosphorylated STAT1 (P-STAT1) and total STAT1. β-actin was used as a loading control. Different membranes are separated by a dashed line. Samples on both membranes were derived from the same experiment and gels as well as blots were processed in parallel. j Relative P-STAT1 expression normalized to total STAT1 in control (grey) and SPG11 (red) iMGL upon IFNγ stimulation. P-STAT1 and STAT1 signals were first normalized to respective β-actin signals. n = 5. Data presented as mean ± SD. P value according to a non-parametric Mann–Whitney U test. k Two representative STAT1 DAB stainings of the SPG11 UKER postmortem parietal lobe. Scale bar 20 µm. l Two representative microscopic z-stack images of Spg11−/− frontal lobe stained for IBA1, STAT1 and DAPI. Scale bar: 20 µm. m Quantification of IBA1+ cells that show a nuclear STAT1 signal. n(Spg11+/+) = 5; n(Spg11−/−) = 5. Each dot represents the mean of cells within five random fields of view (0.15 mm2). Data presented as mean ± SD. P value according to a non-parametric Mann–Whitney U test. ns P > 0.05; * P < 0.05; ** P < 0.01; NT non-treated; STAT1 Signal Transducer and Activator of Transcription 1
Fig. 6
Fig. 6
Ruxolitinib inhibits SPG11 iMGL hyperactivation and rescues toxicity induced in SPG11 neurons. a Representative immunofluorescence of control and SPG11 iMGL (IFNγ: 10 ng/µl for 24 h, Ruxolitinib: 50 µM for 24 h before IFNγ treatment) stained for IBA1, STAT1 and CXCL10. Scale bar 50 µm. b Quantification of mean fluorescence intensity of STAT1 and CXCL10 within IBA1+ control (n = 4) and SPG11 (n = 4) iMGL. Each dot represents the mean of cells within five random fields of view (0.15 mm2). Bars represent means ± SD. P value according to two-way ANOVA with Bonferroni’s multiple comparison test. c Schematic representation of the experimental paradigm. Control and SPG11 iMGL were either treated with Ruxolitinib and IFNγ, with IFNγ only or remained untreated. Microglia-conditioned media (MCM) was collected, diluted 1:1 with neuronal media and added to control and SPG11 neurons that were differentiated for 2 weeks from NPCs. After 48 h, cell death was measured by ICC. d Representative images of TUBB3 and DAPI staining in SPG11 neurons treated with MCM derived from non-treated (NT), IFNγ treated, and Ruxolitinib (Rux) and IFNγ treated SPG11 iMGL. Apoptotic cells were visualized by TUNEL assay. Scale bar: 50 µm. e Quantification of apoptotic cells by TUNEL signal intensity within the DAPI+ nuclei of TUBB3+ control (n = 1) and SPG11 (n = 1) neurons treated with MCM derived from control (n = 5) and SPG11 (n = 5) iMGL. Each dot represents the mean of cells within five random fields of view (0.15 mm2). Bars represent means ± SD. P value according to one-way ANOVA with Bonferroni’s multiple comparison test. ns P > 0.05; * P < 0.05; ** P < 0.01; NT non-treated; Rux Ruxolitinib; MCM microglia-conditioned media
Fig. 7
Fig. 7
Paradigm of the proposed mechanism underlying neuroinflammation in SPG11–HSP. The postmortem analysis indicates that SPG11–HSP patients not only present neurodegenerative phenotypes but also neuroinflammatory characteristics, including microgliosis and infiltration of CD8+ T cells. Our in vitro data revealed that SPG11 iMGL are hyperreactive to IFNγ and produce STAT1-mediated increased levels of proinflammatory cytokines and chemokines that induced increased cell death in SPG11 neurons. In addition, SPG11 iMGL secrete more CXCL10, which is known to mediate infiltration of T cells into the CNS. As T cells are a major source of IFNγ in the brain, we hypothesize an IFNγ- and CXCL10-dependent, reinforcing vicious circle involving microglia and T-cell activation that may also contribute to neurodegeneration

References

    1. Asano N, Hampel U, Garreis F, Schröder A, Schicht M, Hammer CM, Paulsen F. Differentiation patterns of immortalized human meibomian gland epithelial cells in three-dimensional culture. Invest Ophthalmol Vis Sci. 2018;59:1343–1353. doi: 10.1167/IOVS.17-23266. - DOI - PubMed
    1. Badanjak K, Mulica P, Smajic S, Delcambre S, Tranchevent LC, Diederich N, Rauen T, Schwamborn JC, Glaab E, Cowley SA, Antony PMA, Pereira SL, Venegas C, Grünewald A. iPSC-derived microglia as a model to study inflammation in idiopathic Parkinson’s disease. Front Cell Dev Biol. 2021 doi: 10.3389/FCELL.2021.740758. - DOI - PMC - PubMed
    1. Balashov KE, Rottman JB, Weiner HL, Hancock WW. CCR5(+) and CXCR3(+) T cells are increased in multiple sclerosis and their ligands MIP-1alpha and IP-10 are expressed in demyelinating brain lesions. Proc Natl Acad Sci USA. 1999;96:6873–6878. doi: 10.1073/PNAS.96.12.6873. - DOI - PMC - PubMed
    1. Banerjee P, Mehta AR, Nirujogi RS, Cooper J, James OG, Nanda J, Longden J, Burr K, McDade K, Salzinger A, Paza E, Newton J, Story D, Pal S, Smith C, Alessi DR, Selvaraj BT, Priller J, Chandran S. Cell-autonomous immune dysfunction driven by disrupted autophagy in C9orf72-ALS iPSC-derived microglia contributes to neurodegeneration. Sci Adv. 2023 doi: 10.1126/SCIADV.ABQ0651. - DOI - PMC - PubMed
    1. Bauer P, Winner B, Schüle R, Bauer C, Häfele V, Hehr U, Bonin M, Walter M, Karle K, Ringer TM, Rieß O, Winkler J, Schöls L. Identification of a heterozygous genomic deletion in the spatacsin gene in SPG11 patients using high-resolution comparative genomic hybridization. Neurogenetics. 2009;10:43–48. doi: 10.1007/S10048-008-0144-2. - DOI - PubMed

Publication types

Supplementary concepts