. 2024 Feb 1;65(2):4.
doi: 10.1167/iovs.65.2.4.

Transsynaptic Degeneration of Retinal Ganglion Cells Following Lesions to Primary Visual Cortex in Marmosets

Affiliations

Transsynaptic Degeneration of Retinal Ganglion Cells Following Lesions to Primary Visual Cortex in Marmosets

Tanin Sepehrisadr et al. Invest Ophthalmol Vis Sci. .

Abstract

Purpose: A lesion to primary visual cortex (V1) in primates can produce retrograde transneuronal degeneration in the dorsal lateral geniculate nucleus (LGN) and retina. We investigated the effect of age at time of lesion on LGN volume and retinal ganglion cell (RGC) density in marmoset monkeys.

Methods: Retinas and LGNs were obtained about 2 years after a unilateral left-sided V1 lesion as infants (n = 7) or young adult (n = 1). Antibodies against RBPMS were used to label all RGCs, and antibodies against CaMKII or GABAA receptors were used to label nonmidget RGCs. Cell densities were compared in the left and right hemiretina of each eye. The LGNs were stained with the nuclear marker NeuN or for Nissl substance.

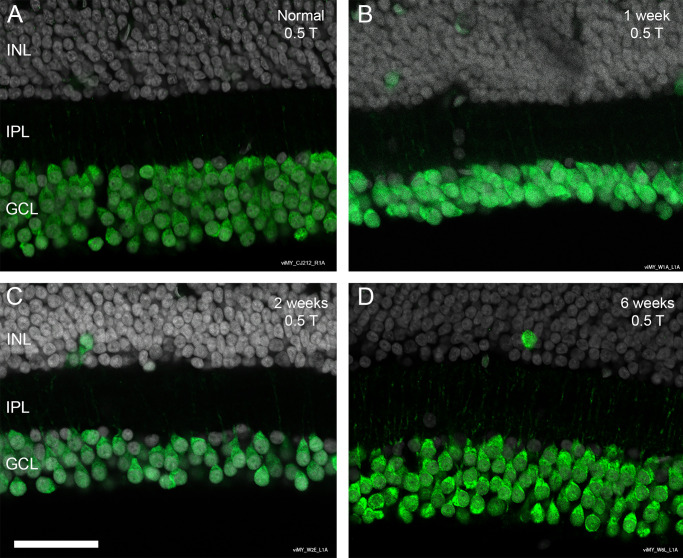
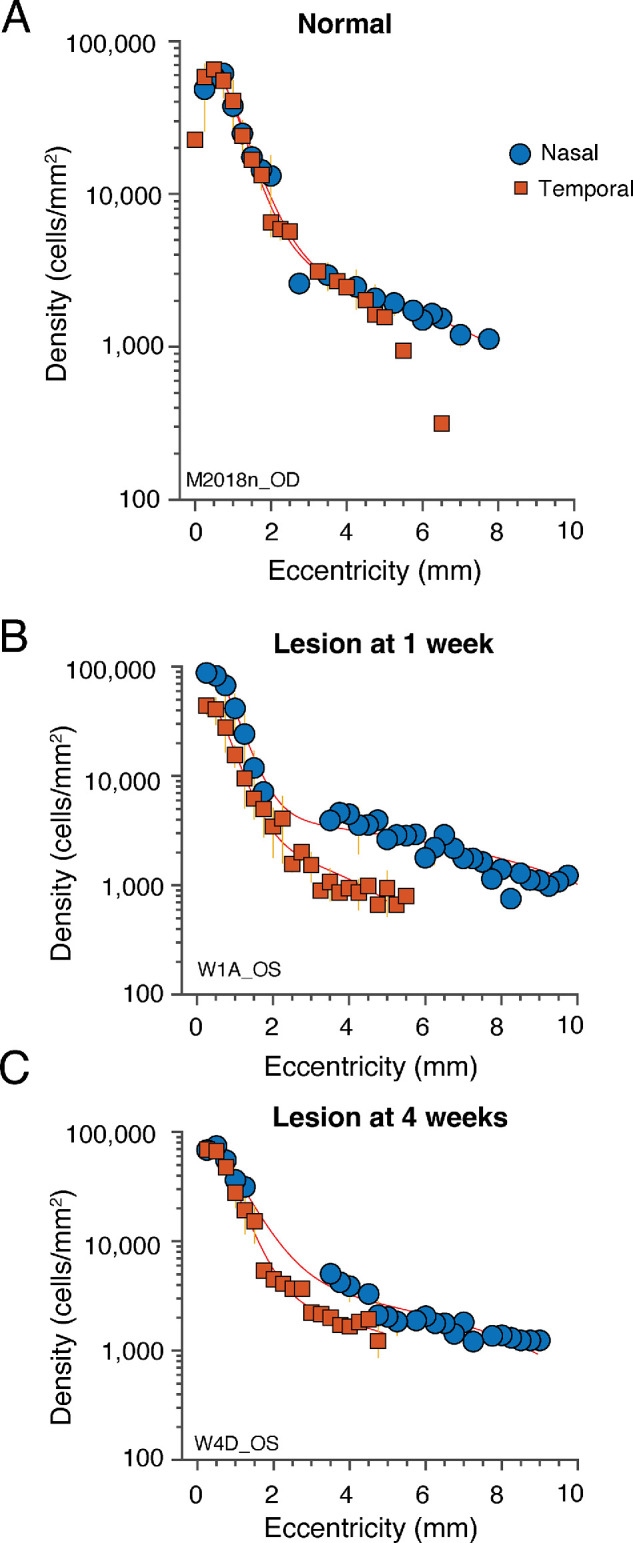
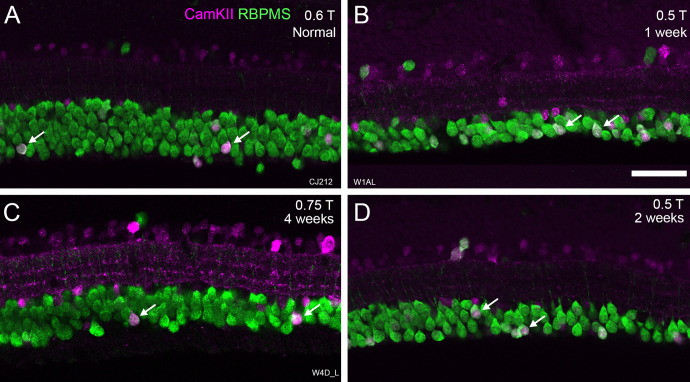
Results: In three animals lesioned within the first 2 postnatal weeks, the proportion of RGCs lost within 5 mm of the fovea was ∼twofold higher than after lesions at 4 or 6 weeks. There was negligible loss in the animal lesioned at 2 years of age. A positive correlation between RGC loss and LGN volume reduction was evident. No loss of CaMKII-positive or GABAA receptor-positive RGCs was apparent within 2 mm of the fovea in any of the retinas investigated.

Conclusions: Susceptibility of marmoset RGCs to transneuronal degeneration is high at birth and declines over the first 6 postnatal weeks. High survival rates of CaMKII and GABAA receptor-positive RGCs implies that widefield and parasol cells are less affected by neonatal cortical lesions than are midget-pathway cells.


Conflict of interest statement

Disclosure: T. Sepehrisadr, None; N. Atapour, None; A.K. Baldicano, None; M.G.P. Rosa, None; U. Grünert, None; P.R. Martin, None

Figures

Figure 1.
Figure 1.
Retinal ganglion cells in normal marmoset. Confocal images of a vertical section through the fovea of an adult marmoset. The layers of the retina are visible with Nomarski optics and DAPI nuclear stain (blue). The section was processed with antibodies against RBPMS to reveal retinal ganglion cells (green). (A) Overview image of the entire section. The scale shown at the bottom of the image indicates retinal eccentricities in millimeters. (B–E) Regions of interest taken at different eccentricities (indicated at the lower right corner). GCL, ganglion cell layer; INL, inner nuclear layer; N, nasal; ONL, outer nuclear layer; IPL, inner plexiform layer; T, temporal. Scale bar shown in B = 50 µm, applies to B–E.
Figure 2.
Figure 2.
Retinal ganglion cell density is reduced in temporal retina ipsilateral to V1 lesions. Confocal images are shown of sections that were processed with antibodies against RBPMS to reveal retinal ganglion cells (green). The layers of the retina are visible with DAPI nuclear stain (white), revealing the nuclei of cell bodies. (A–E) Confocal images of a vertical vibratome section through the left central retina of an adult marmoset (case W2E, 2 years age), which received a left-sided lesion to V1 at 2 weeks of age. (A) Overview image of the entire section. (BE) Regions of interest taken at different eccentricities (in millimeters) as indicated in the lower right corner. (F, G) Confocal images of sections through the temporal hemiretinas of an adult marmoset (case W6L), which received a left-sided lesion to V1 at 6 weeks of age. (F) Normal cell density in the right (contralesion) temporal retina. (G) Thinning of the ganglion cell layer in the left (ipsilesion) temporal retina. Scale bar shown in A = 500 µm, scale bar shown in D = 50 µm, applies to BE; scale bar shown in F = 50 µm, applies to F and G.
Figure 3.
Figure 3.
Retinal ganglion cell density is reduced in temporal retina of marmosets that received a left-sided lesion to V1 at different postnatal ages. Confocal images show vertical sections through left retina of animals that received V1 lesions at different postnatal ages (indicated in the upper right corner) in comparison to the retina of a normal animal. All images are taken at 0.5 mm (4 degrees) eccentricity (temporal; i.e., ipsilesion hemiretina). The sections were processed with antibodies against RBPMS to reveal retinal ganglion cells (green). The layers of the retina are visible with DAPI nuclear stain (white), revealing the nuclei of cell bodies. Scale bar shown in C = 50 µm, applies to all.
Figure 4.
Figure 4.
Degeneration in the left LGN following a lesion of the left V1 at 2 weeks postnatal and 2-year survival period. Case W2D. (A) Nissl-stained 40-µm coronal section through left LGN. The lesion projection zone (lpz) is visible as a wedge-shaped zone of degeneration extending through all LGN layers. (B) Section through the right LGN showing that the normal layering pattern is preserved on the nonlesioned side of the brain. (C, D) Schematic drawings of these sections showing, in the left LGN, the borders of the lpz and the remnants of the parvocellular (P) and magnocellular (M) layers.
Figure 5.
Figure 5.
Spatial density of RBPMS-positive ganglion cells in the central marmoset retina. Density is plotted against eccentricity. (A) Normal (nonlesioned) animal, case M2018. Note near-to-identical distribution of ganglion cells in nasal versus temporal retina. (B) Left retina following left-sided V1 lesion at 1 week postnatal, case W1A. Note asymmetric ganglion cell distribution indicating degeneration in the temporal (left) hemiretina. (C) Left retina following left-sided V1 lesion at 2 weeks postnatal, case W2E; note similar degree of degeneration as in B. (D) Left retina following left-sided V1 lesion at 6 weeks postnatal; note reduced degree of degeneration compared to animals lesioned at earlier postnatal ages. Points show means of pooled data taken in 0.25-mm eccentricity bins from at least three vibratome sections from one retina in each case. Error bars (in some cases smaller than the data symbols) show standard deviations. (E) Cell loss estimated at matching eccentricities within the first 2 mm. *P < 0.05, Wilcoxon nonparametric rank test for paired samples; A, animal lesioned at 2.3 years postnatal; N, case M2018, normal (nonlesioned) animal. (F) Cell loss estimates for all available eccentricities for these cases. Cumulative cell loss between the fovea and indicated eccentricity is shown. Negative values in cases W6F and M2018 are set to zero.
Figure 6.
Figure 6.
Spatial density of RBPMS-positive ganglion cells in one normal and two lesioned animals. Density data are plotted on a logarithmic scale to facilitate comparison of peripheral eccentricities. (A) Case M2018, normal (nonlesioned) animal. Note symmetric distribution of cell density at eccentricities below 5 mm (∼40 degrees). (B) Case W1A, lesioned at 1 week postnatal. Note extensive cell loss in temporal (ipsilesion) hemiretina. (C) Case W4D, lesioned at 4 weeks postnatal. Note moderate cell loss at eccentricities below 5 mm (∼40 degrees) in temporal (ipsilesion) hemiretina. Error bars (in some cases smaller than the data symbols) show SEM.
Figure 7.
Figure 7.
Parasol ganglion cell density is comparable in temporal and nasal retina of lesioned animals. (A–E) Confocal images of vertical sections through the fovea of marmosets. The sections were processed with antibodies against RBPMS to reveal retinal ganglion cells (green) and antibodies against GABAA receptors (magenta) to label parasol cells. DAPI labeling revealing nuclei is shown in white. (A, B) Images of sections from a normal animal. In A, the GABAA receptor labeling is shown together with differential contrast optics to reveal retina layers. (C–E) Images of sections from a marmoset that received a lesion of the left V1 at the age of 2 weeks. (C) Overview image of the foveal region. The rectangles indicate the regions shown in D and E taken at 0.5 mm in contralesion nasal (N) and ipsilesion temporal (T) retina, respectively. There is a reduction in the thickness of the GCL in temporal retina, but the density of presumed parasol cells is comparable to that in nasal retina. (F) DiI-injected GABAA receptor-positive inner stratifying parasol ganglion cell in a nonlesioned animal at 5.35 mm eccentricity. The inset on the right shows the GABAA receptor-positive soma (green); DiI labeling in the soma is shown in magenta. Scale bar shown in C = 100 µm, applies for A and C; scale bar shown in D = 50 µm, applies to BD; scale bar shown in F = 50 µm.
Figure 8.
Figure 8.
Parasol ganglion cell density in normal and lesioned animals is comparable. Confocal images of sections through temporal (T) left retina of a normal (A) and two lesioned animals (B, C) taken at comparable eccentricities (indicated in millimeters in the upper right corner). The sections were processed with antibodies against RBPMS to reveal retinal ganglion cells (green) and antibodies against GABAA receptors (magenta) to label parasol cells. Scale bar shown in A = 50 µm, applies to all.
Figure 9.
Figure 9.
Widefield ganglion cell density in normal and lesioned animals is comparable. Confocal images of sections through temporal (T) left retina of a normal (A) and three lesioned animals (BD) taken at comparable eccentricities (indicated in millimeters in the upper right corner). The sections were processed with antibodies against RBPMS to reveal retinal ganglion cells (green) and antibodies against CaMKII to label widefield ganglion cells. Scale bar shown in B = 50 µm, applies to all.
Figure 10.
Figure 10.
Preservation of parasol and widefield cells in foveal retina following V1 lesions. (A) Case W2E. Density of parasol cells labeled with GABAA receptor antibodies in left eye following a left-sided V1 lesion at 2 weeks postnatal age. Note comparable density in nasal (contralesion) and temporal (ipsilesion) retina. (B) Case W2E. Density of widefield cells labeled with CaMKII antibodies in left eye following a left-sided V1 lesion at 2 weeks postnatal age. Note comparable density in nasal (contralesion) and temporal (ipsilesion) retina. (C) Density of widefield cells labeled with CaMKII antibodies in the right eye of a normal (nonlesioned) animal. (D) Comparison of overall ganglion cell loss (blue bars, data from Figure 5) with loss of parasol cells labeled with GABAA receptor antibodies (red bars) and widefield cells labeled with CaMKII antibodies (yellow bars) following lesions at 1 week postnatal age (case W1A), 2 weeks postnatal age (case W2E), and 6 weeks postnatal age (cases W6F, W6L; mean values are shown). Error bars (in some cases smaller than the data symbols) in A–C show SEM.
Figure 11.
Figure 11.
Relation of ganglion cell loss to geniculate volume loss following cortical area V1 lesions. Solid lines show linear regression. Dashed lines show 95% confidence intervals. (A) Scatterplot of age at lesion against retinal ganglion cell (RGC) loss. (B) Scatterplot of age at lesion against dorsal LGN volume loss. (C) Scatterplot of RGC loss against LGN volume loss. A, case WA13, animal lesioned at 2.3 years postnatal; N, nonlesioned (normal) animal.

Similar articles

Cited by

References

    1. Van Buren JM. Trans-synaptic retrograde degeneration in the visual system of primates. J Neurol Neurosurg Psychiatry . 1963; 26: 402–409. - PMC - PubMed
    1. Cowey A. Atrophy of retinal ganglion cells after removal of striate cortex in a rhesus monkey. Perception . 1974; 3: 257–260. - PubMed
    1. Weller RE, Kaas JH, Wetzel AB.. Evidence for the loss of X-cells of the retina after long-term ablation of visual cortex in monkeys. Brain Res . 1979; 160: 134–138. - PubMed
    1. Cowey A, Stoerig P, Perry VH.. Transneuronal retrograde degeneration of retinal ganglion cells after damage to striate cortex in macaque monkeys: selective loss of P beta cells. Neuroscience . 1989; 29: 65–80. - PubMed
    1. Ptito M, Herbin M, Boire D, Ptito A.. Neural bases of residual vision in hemicorticectomized monkeys. Prog Brain Res . 1996; 112: 385–404. - PubMed

Substances