. 2024 Feb 1;24(2):3.
doi: 10.1167/jov.24.2.3.

Perceptual transitions between object rigidity and non-rigidity: Competition and cooperation among motion energy, feature tracking, and shape-based priors

Affiliations

Perceptual transitions between object rigidity and non-rigidity: Competition and cooperation among motion energy, feature tracking, and shape-based priors

Akihito Maruya et al. J Vis. .

Abstract

Why do moving objects appear rigid when projected retinal images are deformed non-rigidly? We used rotating rigid objects that can appear rigid or non-rigid to test whether shape features contribute to rigidity perception. When two circular rings were rigidly linked at an angle and jointly rotated at moderate speeds, observers reported that the rings wobbled and were not linked rigidly, but rigid rotation was reported at slow speeds. When gaps, paint, or vertices were added, the rings appeared rigidly rotating even at moderate speeds. At high speeds, all configurations appeared non-rigid. Salient features thus contribute to rigidity at slow and moderate speeds but not at high speeds. Simulated responses of arrays of motion-energy cells showed that motion flow vectors are predominantly orthogonal to the contours of the rings, not parallel to the rotation direction. A convolutional neural network trained to distinguish flow patterns for wobbling versus rotation gave a high probability of wobbling for the motion-energy flows. However, the convolutional neural network gave high probabilities of rotation for motion flows generated by tracking features with arrays of MT pattern-motion cells and corner detectors. In addition, circular rings can appear to spin and roll despite the absence of any sensory evidence, and this illusion is prevented by vertices, gaps, and painted segments, showing the effects of rotational symmetry and shape. Combining convolutional neural network outputs that give greater weight to motion energy at fast speeds and to feature tracking at slow speeds, with the shape-based priors for wobbling and rolling, explained rigid and non-rigid percepts across shapes and speeds (R2 = 0.95). The results demonstrate how cooperation and competition between different neuronal classes lead to specific states of visual perception and to transitions between the states.


Figures

Figure 4.
Figure 4.
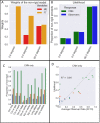
Non-rigid percepts. Average proportions of reports of non-rigidity for each of 10 observers for each shape at three speeds (0.6°/s, 6.0°/s, and 60.0°/s) for diameters of 3 dva (A) and 6 dva (B). Different colored circles indicate different observers, and the average of all of the observers is shown by the black cross. (C) Histograms of non-rigid percepts averaged over the 10 observers. The error bar indicates 95% confidence intervals after 1000 bootstrap resamples. (D) Average proportion of non-rigid percepts for the rotating and wobbling circular rings for 10 observers and three speeds. Similarity is shown by closeness to the unit diagonal and R2 = 0.97. (E) Average proportion of non-rigid percepts for 0° elevation versus 15° elevation. Proportions are similar (R2 = 0.90) but slightly higher for the 15° elevation.
Figure 5A-C.
Figure 5A-C.
Figure 6B.
Figure 6B.
Figure 7.
Figure 7.
CNN output. (A) Proportion of non-rigid percepts for CNN output from motion-energy units for each shape. Symbol shape and color indicate ring-pair shape. For all ring shapes, the proportion of non-rigid classifications was 0.996. (B) The average CNN output based on the feature-tracking vector fields being the inputs for different stimulus shapes shows the higher probabilities of rigid percepts.
Figure 8A.
Figure 8A.
Figure 9.
Figure 9.
Combining motion-energy and feature-tracking outputs. (A) Estimated optimal weights of inputs from the motion-energy mechanism (red) and the feature-tracking mechanism (yellow) as a function of rotation speed over all shapes. (B) CNN rigidity versus non-rigidity classifications as a function of rotation speed. The trained CNN output from the linear combination of two vector fields is the likelihood, which is denoted by the green bar, whereas the blue bar indicates the average of the 10 observers’ responses. (C) Proportion of non-rigid percepts from the likelihood function of the CNN as a function of the speed of the stimulus for different shapes. Different colors show different speeds of stimulus (blue, 0.6°/s; orange, 6.0°/s; green, 60.0°/s). (D) Likelihood of non-rigidity output plotted against the average of 10 observers’ reports. Although R2 = 0.65, at the fast speed, the model predicts similar probability of non-rigidity for shapes where the observers’ percepts vary. Thus, the model does not capture some important properties of observers’ percepts as a function of the shape of the object.
Figure 10.
Figure 10.
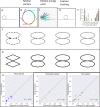
Rolling illusion. (A) A 2D circle on a line, translating from left to right but perceived as rolling clockwise. (B) To perceive rolling, local units that detect motion tangential to the contour are required. (C, D) Local motion signals from motion energy and feature tracking, respectively. In both cases, the vectors are inconsistent with the required tangential vectors. (E) Average proportion of rolling percepts (eight observers). The color of the bar indicates the speed of the stimulus (blue, 0.6°/s; orange, 6.0°/s; green, 60.0°/s). The shape of the stimulus is indicated on the X-axis. The proportion of rolling percepts increased with speed and decreased when salient features were added to the rings. (F) Rolling illusion and rotational symmetry. The non-rigidity (rolling) percepts increase with the order of rotational symmetry from left to right. (G) The relationship between rolling illusion and the strength of feature. As the number of corners increase from left to right, they become less salient as the increasingly obtuse angles become more difficult to extract, and accordingly the percept of rolling increases. (H) Model prediction with rotational symmetry and average strength of features versus average proportion of rolling percepts for slow (left), moderate (middle), and fast (right) speeds (R2 = 0.90, 0.94, and 0.79, respectively). Movie is available on the journal website.
Figure 11.
Figure 11.
Final model. (A) The proportion of non-rigid percept classifications as a function of the speed and shape of the stimulus from the final model (combining shape-based rolling and wobbling priors with the CNN likelihoods). Different colors indicate different speeds of the stimulus (blue, 0.6°/s; orange, 6.0°/s; green, 60.0°/s). (B) The predictions of the final model are plotted against the average observer percepts. The model explains the observer's percepts (R2 = 0.95).
Figure A1.
Figure A1.
Feature selection and change in the image intensity across different regions. The red square shows a receptive field at a flat region (left), at an edge (middle), and at a corner (right). For the flat region, a small change in the receptive field location does not change the image intensity (shown in green arrows). At the edge, moving along the edge direction does not change the overall image intensity, but, except for that direction, the image intensity shifts, especially along the direction perpendicular to the edge. At the corner, the overall image intensity changes in every direction.

Update of

References

    1. Abadi, M., Agarwal, A., Barham, P., Brevdo, E., Chen, Z., Citro, C., & Zheng, X. (2016). Tensorflow: Large-scale machine learning on heterogeneous distributed systems. arXiv, 10.48550/arXiv.1603.04467. - DOI
    1. Adelson, E. H., & Bergen, J. R. (1985). Spatiotemporal energy models for the perception of motion. Journal of the Optical Society of America A, 2(2), 284–299. - PubMed
    1. Adelson, E. H., & Movshon, J. A. (1982). Phenomenal coherence of moving visual patterns. Nature, 300(5892), 523–525. - PubMed
    1. Aggarwal, J. K., Cai, Q., Liao, W., & Sabata, B. (1998). Nonrigid motion analysis: Articulated and elastic motion. Computer Vision and Image Understanding, 70(2), 142–156.
    1. Akhter, I., Sheikh, Y., Khan, S., & Kanade, T. (2010). Trajectory space: A dual representation for nonrigid structure from motion. IEEE Transactions on Pattern Analysis and Machine Intelligence, 33(7), 1442–1456. - PubMed

Publication types