. 2023 May 8;4(1):213-228.
doi: 10.1016/j.bpsgos.2023.04.007. eCollection 2024 Jan.

Chronic Stress Exposure Alters the Gut Barrier: Sex-Specific Effects on Microbiota and Jejunum Tight Junctions

Collaborators, Affiliations

Chronic Stress Exposure Alters the Gut Barrier: Sex-Specific Effects on Microbiota and Jejunum Tight Junctions

Ellen Doney et al. Biol Psychiatry Glob Open Sci. .

Abstract

Background: Major depressive disorder (MDD) is the leading cause of disability worldwide. Of individuals with MDD, 30% to 50% are unresponsive to common antidepressants, highlighting untapped causal biological mechanisms. Dysfunction in the microbiota-gut-brain axis has been implicated in MDD pathogenesis. Exposure to chronic stress disrupts blood-brain barrier integrity; still, little is known about intestinal barrier function in these conditions, particularly for the small intestine, where absorption of most foods and drugs takes place.

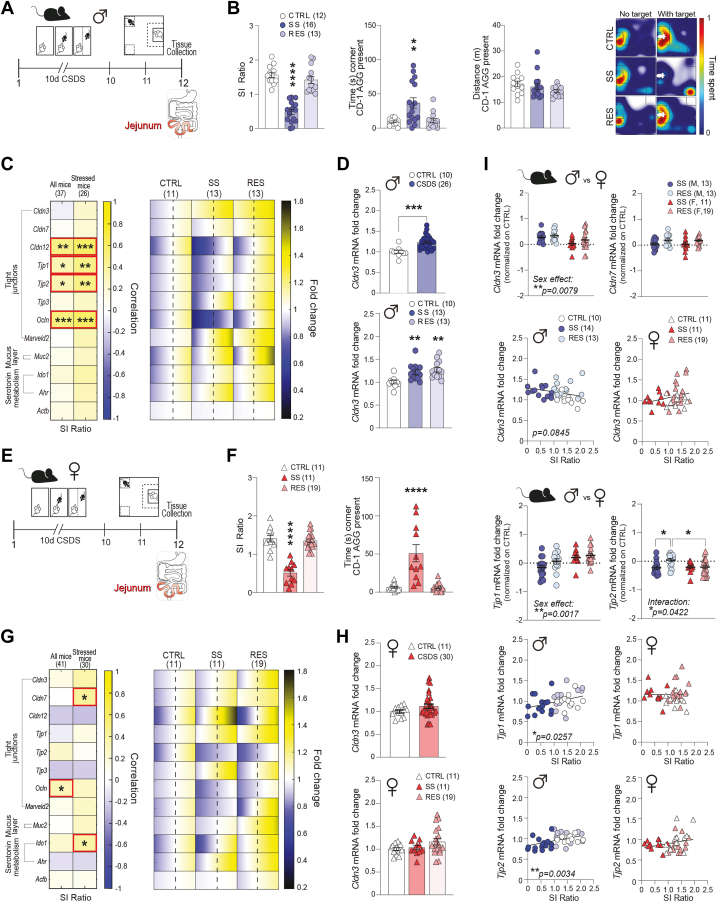
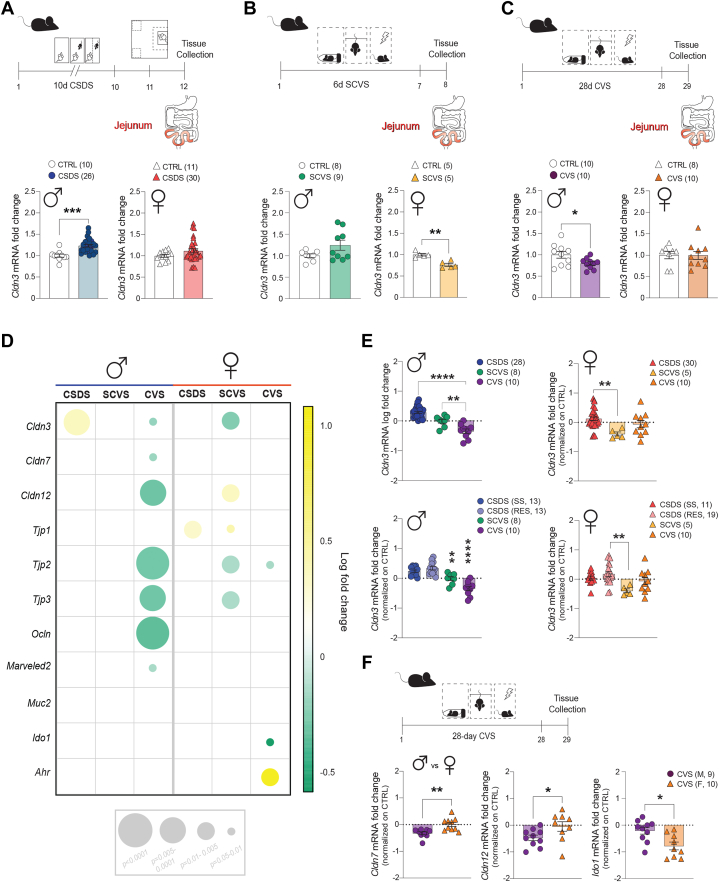
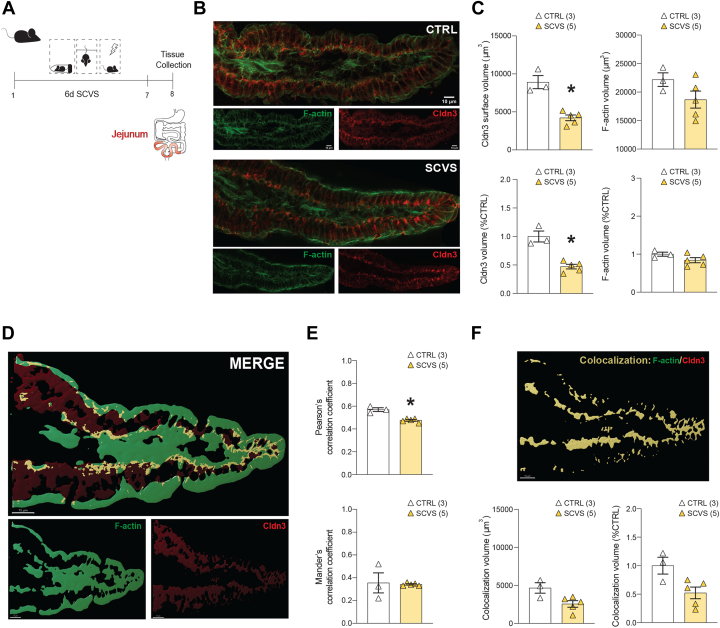
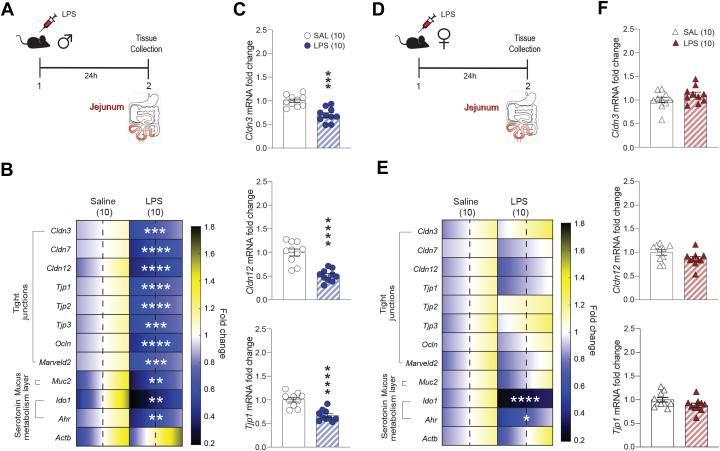
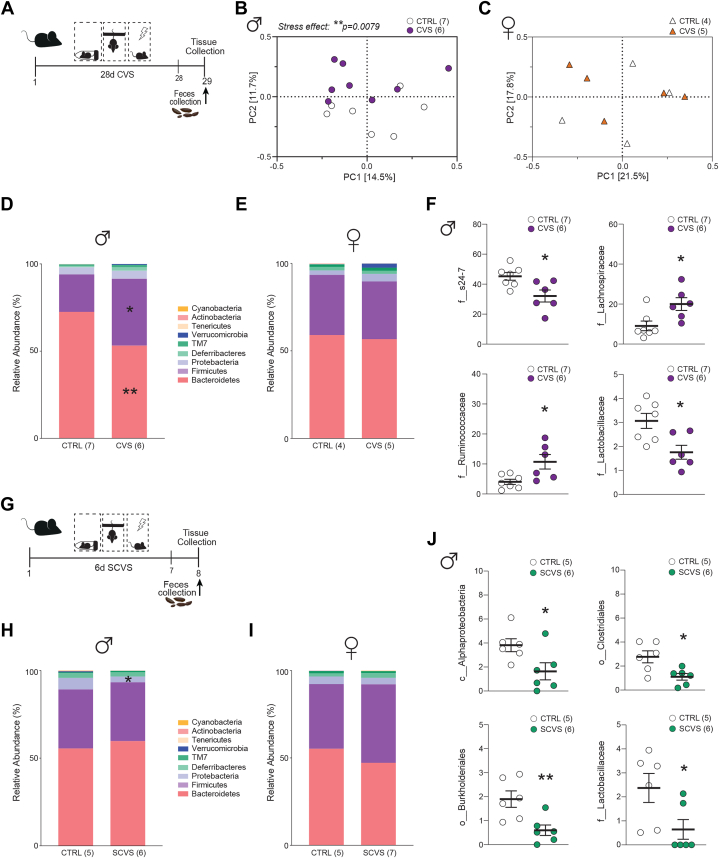
Methods: We investigated how chronic social or variable stress, two mouse models of depression, impact the jejunum intestinal barrier in males and females. Mice were subjected to stress paradigms followed by analysis of gene expression profiles of intestinal barrier-related targets, fecal microbial composition, and blood-based markers.

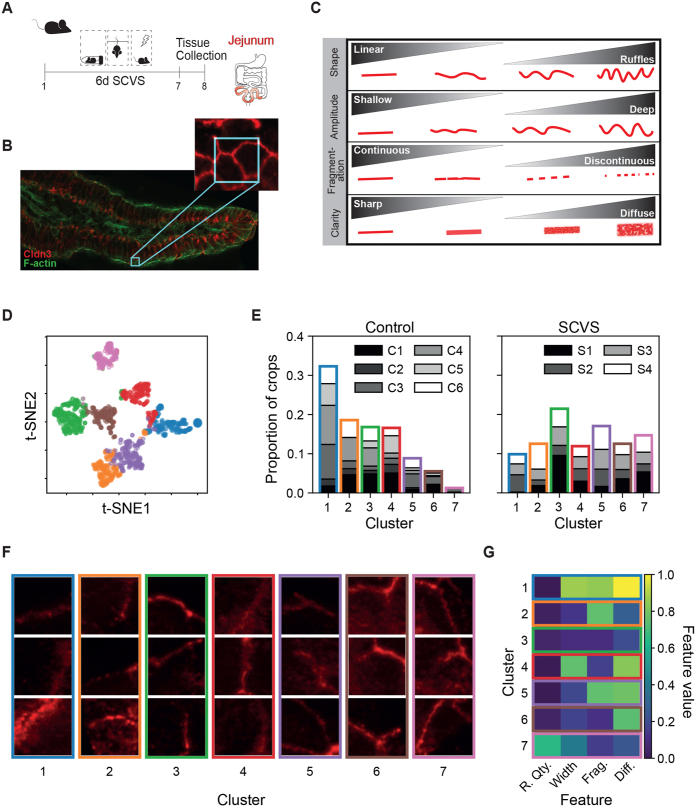
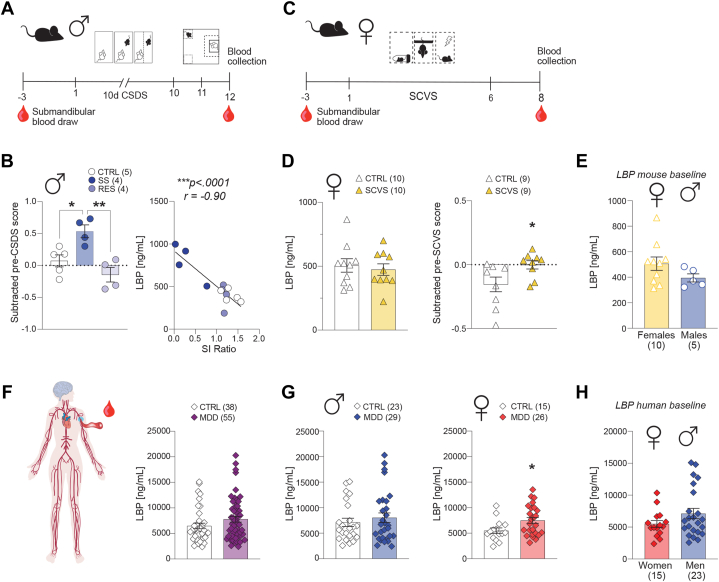
Results: Altered microbial populations and changes in gene expression of jejunum tight junctions were observed depending on the type and duration of stress, with sex-specific effects. We used machine learning to characterize in detail morphological tight junction properties, identifying a cluster of ruffled junctions in stressed animals. Junctional ruffling is associated with inflammation, so we evaluated whether lipopolysaccharide injection recapitulates stress-induced changes in the jejunum and observed profound sex differences. Finally, lipopolysaccharide-binding protein, a marker of gut barrier leakiness, was associated with stress vulnerability in mice, and translational value was confirmed on blood samples from women with MDD.

Conclusions: Our results provide evidence that chronic stress disrupts intestinal barrier homeostasis in conjunction with the manifestation of depressive-like behaviors in a sex-specific manner in mice and, possibly, in human depression.

Keywords: Claudins; Cytokines; Sex differences; Social stress; Variable stress.


Figures

Figure 1
Figure 1
Chronic social stress alters jejunum tight junction expression with sex-specific effects. (A) Timeline of the male CSDS paradigm. (B) (Left panel) Ratio of time spent interacting with novel social target decreased in SS vs. unstressed CTRL and RES male mice (SI ratio: p < .0001). (Middle panels) Cumulative time (in seconds) spent in corners with social target present was increased in SS males (p = .0004) and cumulative distance traveled (meters) in arena with social target present was unchanged between groups. (Right panel) Representative heatmaps of normalized time spent in the arena during SI test in males. (C) (Left panel) Effects of social stress on mRNA expression of tight junction proteins in the jejunum of male mice as a function of group condition. Red boxes highlight genes with significant correlation with social avoidance: Cldn12 (p = .006, r = 0.44), Tjp1 (p = .03, r = 0.36), Tjp2 (p = .004, r = .46), and Ocln (p < .001, r = 0.55). (Right panel) Quantitative polymerase chain reaction revealed significant changes in jejunum of SS and RES mice compared with CTRL mice for gene expression of targets related to tight junctions. The range of color indicates individual differences within a group. SEM from the average represented by dashed line. (D) Significant increase in Cldn3 for male mice was independent of phenotype group (p = .0002). (E) Time line of the female CSDS paradigm. (F) Ratio of time spent interacting with novel social target is decreased in SS female mice (p < .0001). Cumulative time (in seconds) spent in corners with social target present was increased in SS females (p < .0001). (G) (Left panel) Ocln (p = .04, r = 0.31), Cldn7 (p = .02, r = 0.41), and Ido1 (p = .04, r = 0.24) expression correlated with social avoidance behaviors. Red boxes highlight genes with significant correlation with social avoidance. (Right panel) Tight junction changes as a function of phenotype in female mice. (H)Cldn3 expression is unchanged in female mice following social stress. (I) There is an effect of sex as a factor on Cldn3 (p = .008) and Tjp1 (p = .002) gene expression. Post hoc tests confirmed that stressed female mice had lower Cldn3 expression than males in both SS and RES groups (p = .0499). Similarly, SS males had lower Tjp1 expression than SS females (p = .01), and an interaction between sex and behavioral phenotype was present for Tjp2 expression (p = .04). Data assessed by t tests and one-way analysis of variance followed by Bonferroni’s multiple comparison test for changes between groups and two-way analysis of variance followed by Bonferroni’s multiple comparison test for comparison between sexes; correlations were evaluated with Pearson’s correlation coefficient; ∗p < .05, ∗∗p < .01, ∗∗∗p < .001, ∗∗∗∗p < .0001. AGG, aggressor; CSDS, chronic social defeat stress; CTRL, control; F, female; M, male; mRNA, messenger RNA; RES, resilient; SI, social interaction; SS, stress-susceptible.
Figure 2
Figure 2
Changes in jejunum tight junction expression are dependent on stress type and duration. (A) Experimental time line of the CSDS paradigm with graphs of Cldn3 gene expression comparing CTRL and stressed groups of male (p = .0002) and female mice. (B) SCVS experimental time line with comparison of Cldn3 gene expression results of male and female mice (p = .008). (C) Experimental time line of CVS with Cldn3 gene expression results between CTRL and stressed groups of male (p = .03) and female mice from this paradigm. (D) Representation of gene expression changes in the jejunum of stressed mice across stress models in both males and females. Circle diameter represents statistical significance of the gene expression change. Circle color represents directionality of change vs. unstressed CTRL with green as a downregulated gene and yellow as an upregulated gene. (E) Direct comparison of Cldn3 gene expression changes in (left panels) male (p < .01; p < .0001) and (right panels) female (p = .0071; p = .0118) stressed mice exposed to different stress types, (top panels) CSDS, SCVS, and CVS, and (bottom panels) with CSDS phenotypes separated to SS and RES. (F) Direct sex comparison of Cldn7 (p = .002), Cldn12 (p = .035), and Ido1 (p = .013) gene expression changes in mice exposed to 28-day CVS. Data assessed by t tests and one-way analysis of variance followed by Bonferroni’s multiple comparison test for changes between groups; ∗p < .05, ∗∗p < .01, ∗∗∗p < .001, ∗∗∗∗p < .0001. CSDS, chronic social defeat stress; CTRL, control; CVS, chronic variable stress; F, female; M, male; mRNA, messenger RNA; RES, resilient; SCVS, subchronic chronic variable stress; SS, stress-susceptible.
Figure 3
Figure 3
Morphological assessments of stress-induced changes in jejunum CLDN3 expression. (A) Experimental time line of female SCVS paradigm and tissue collection. (B, C) CLDN3 protein level was lower in SCVS-exposed mice, while no difference was measured for F-actin (p = .0357). (D) Representative image of Imaris volume rendering for surface volume determination. (E) Pearson’s correlation coefficient revealed decreased colocalization of F-actin and CLDN3 signal intensities. However, no significant differences in co-occurrence of F-actin and CLDN3 were detected with Manders’ colocalization coefficient. (F) Surface volume of colocalized regions of F-actin and CLDN3 extracted from the image in panel (D) was lower in SCVS mice without reaching significance (p = .0714). ∗p < .05. CTRL, control; SCVS, subchronic chronic variable stress.
Figure 4
Figure 4
Detailed morphological assessments and k-means clustering analysis of stress-induced changes in jejunum CLDN3 protein expression. (A) Experimental time line of female SCVS paradigm. (B) Representative immunofluorescent image of CLDN3 and F-actin. (C) Chart describing the jejunum tight junction features and parameters analyzed. (D)t-SNE visualization of the k-means clustering. The 4 features (ruffle quantity, width, fragmentation, and diffusion) are projected in 2 dimensions using the t-SNE algorithm. Each color corresponds to a different cluster identified with k-means clustering. Tight junction crops (5.52 × 5.52 μm) with similar feature values are clustered together and are closer together in the t-SNE projection. (E) Proportion of tight junction crops from each image in each cluster for control and stressed animals. The different shades of gray correspond to different images to show that the distribution was not skewed by the overwhelming presence of a cluster in a single image. In the control condition, cluster 1 contains more than half of the tight junction crops, while very few are in cluster 7. For the chronic stress condition, there is an increase in crops belonging to clusters 5, 6, and 7. (F) Examples of CLDN3 tight junction crops associated with each cluster. These were selected from the 20 crops with features closest to the median point of each cluster using cosine distance. (G) Feature “barcode” of the clusters identified with k-means clustering. Each entry corresponds to the median value of a feature in the given cluster. Diff., diffusion; Frag., fragmentation; R. Qty., ruffle quantity; SCVS, subchronic chronic variable stress; t-SNE, t-distributed stochastic neighbor embedding.
Figure 5
Figure 5
LPS-induced inflammation promotes loss of jejunum tight junction expression in males only. (A) Experimental time line of LPS injection and tissue collection in males. (B) Quantitative polymerase chain reaction revealed significant changes in jejunum of LPS-treated mice compared with control mice (saline) for gene expression of targets related to tight junctions, the mucus layer, or serotonin metabolism. The range of color indicates individual differences within a group; SEM from the average represented by the dashed line. Cldn3 (p = .0001), Cldn7 (p < .0001), Cldn12 (p < .0001), Ocln (p < .0001), Marveld2 (p < .0001), Tjp1 (p < .0001), Tjp2 (p < .0001), Tjp3 (p = .0001), Muc2 (p = .0076), Ido1 (p = .0052), and Ahr (p = .0016) expression was reduced in males after LPS. (C) Graphs are provided for Cldn3, Cldn12, and Tjp1. (D) Experimental time line of LPS injection and tissue collection in females. (E) Quantitative polymerase chain reaction revealed no significant changes in jejunum of LPS-treated female mice compared with control mice (saline injection) for gene expression of targets related to tight junctions. (F) Graphs are provided for Cldn3, Cldn12, and Tjp1. However, a significant loss was noted for serotonin-related Ido1 (p < .0001) and Ahr (p = .0115). Data assessed with Mann-Whitney U test; ∗p < .05, ∗∗p < .01, ∗∗∗p < .001, ∗∗∗∗p < .0001. LPS, lipopolysaccharide; mRNA, messenger RNA; SAL, saline.
Figure 6
Figure 6
Sex-specific effects of stress exposure on fecal microbiota of male and female mice. (A) Experimental time line of 28-day CVS exposure and feces collection. (B) Analysis of beta-diversity revealed that CVS males significantly differed from unstressed CTRL mice (p = .042). (C) No difference was noted for females. (D) Relative abundance of phylum communities showed decreased Bacteroidetes (p = .013) and increased Firmicutes (p = .033) following CVS in males. (E) Again no change was noted for females. (F) At the family level, CVS-exposed males had significant changes in the S24-7 (p = .016), Lachnospiraceae (p = .022), Ruminococcaceae (p = .039), and Lactobacillaceae (p = .011) families. (G) Experimental time line of 6-day SCVS exposure and feces collection. (H) A reduction in the Proteobacteria phylum was observed in males after 6-day SCVS compared with unstressed CTRL mice (p = .041). (I) No significant change was noted for females despite exposure to the same stress paradigm. (J) Alphaproteobacteria (unassigned; p = .035), Clostridiales (unassigned; p = .015), Burkholderiales (p = .009), and Lactobacillaceae (p = .026) abundances all were decreased in 6-day SCVS males. Unpaired t tests were used for 2-group comparisons; ∗p < .05, ∗∗p < .01. CTRL, control; CVS, chronic variable stress; PC, principal component; SCVS, subchronic chronic variable stress.
Figure 7
Figure 7
Blood biomarkers are associated with loss of gut barrier integrity in stressed mice and individuals with MDD. (A) Experimental time line of 10-day CSDS and blood collection before and after stress exposure. (B) LBP is increased in SS, but not RES, male mice compared with unstressed CTRL mice after CSDS (p = .0033) and negatively correlated with SI ratio (p < .0001). (C) Experimental time line of 6-day SCVS and blood collection before and after stress exposure. (D) Circulating LBP appears similar between unstressed and stressed groups of female mice, but is in fact increased after 6-day SCVS when LBP level is compared after vs. before stress (p = .0188). (E) Baseline blood LBP is higher in unstressed CTRL female mice compared with males of the same group without reaching significance. (F) Circulating LBP is upregulated in individuals with MDD. (G) The effect is driven by women (p = .0434). (H) Baseline blood LBP in healthy CTRL women and men is similar. Data assessed by t tests and one-way analysis of variance followed by Bonferroni’s multiple comparison test for changes between groups. Human data assessed with two-tailed Mann-Whitney U test; ∗p < .05, ∗∗p < .01, ∗∗∗p < .001. CSDS, chronic social defeat stress; CTRL, control; LBP, lipopolysaccharide-binding protein; MDD, major depressive disorder; RES, resilient; SCVS, subchronic variable stress; SI, social interaction; SS, stress-susceptible.

Similar articles

Cited by

References

    1. Doney E., Cadoret A., Dion-Albert L., Lebel M., Menard C. Inflammation-driven brain and gut barrier dysfunction in stress and mood disorders. Eur J Neurosci. 2022;55:2851–2894. - PMC - PubMed
    1. Kessler R.C., Chiu W.T., Demler O., Merikangas K.R., Walters E.E. Prevalence, severity, and comorbidity of 12-month DSM-IV disorders in the National Comorbidity Survey Replication. Arch Gen Psychiatry. 2005;62:617–627. - PMC - PubMed
    1. Menard C., Pfau M.L., Hodes G.E., Russo S.J. Immune and neuroendocrine mechanisms of stress vulnerability and resilience. Neuropsychopharmacology. 2017;42:62–80. - PMC - PubMed
    1. Hodes G.E., Kana V., Menard C., Merad M., Russo S.J. Neuroimmune mechanisms of depression. Nat Neurosci. 2015;18:1386–1393. - PMC - PubMed
    1. Miller A.H., Raison C.L. The role of inflammation in depression: From evolutionary imperative to modern treatment target. Nat Rev Immunol. 2016;16:22–34. - PMC - PubMed

LinkOut - more resources