. 2024 Feb 27;43(2):113707.
doi: 10.1016/j.celrep.2024.113707. Epub 2024 Feb 1.

H2A.Z histone variants facilitate HDACi-dependent removal of H3.3K27M mutant protein in pediatric high-grade glioma cells

Affiliations

H2A.Z histone variants facilitate HDACi-dependent removal of H3.3K27M mutant protein in pediatric high-grade glioma cells

Katarzyna B Leszczynska et al. Cell Rep. .

Abstract

Diffuse intrinsic pontine gliomas (DIPGs) are deadly pediatric brain tumors, non-resectable due to brainstem localization and diffusive growth. Over 80% of DIPGs harbor a mutation in histone 3 (H3.3 or H3.1) resulting in a lysine-to-methionine substitution (H3K27M). Patients with DIPG have a dismal prognosis with no effective therapy. We show that histone deacetylase (HDAC) inhibitors lead to a significant reduction in the H3.3K27M protein (up to 80%) in multiple glioma cell lines. We discover that the SB939-mediated H3.3K27M loss is partially blocked by a lysosomal inhibitor, chloroquine. The H3.3K27M loss is facilitated by co-occurrence of H2A.Z, as evidenced by the knockdown of H2A.Z isoforms. Chromatin immunoprecipitation sequencing (ChIP-seq) analysis confirms the occupancy of H3.3K27M and H2A.Z at the same SB939-inducible genes. We discover a mechanism showing that HDAC inhibition in DIPG leads to pharmacological modulation of the oncogenic H3.3K27M protein levels. These findings show the possibility of directly targeting the H3.3K27M oncohistone.

Keywords: CP: Cancer; DIPG; H2A.Z; H3.3; H3.3K27M; HDAC inhibitors; SB939; histone variants; multiomics; pediatric high-grade gliomas.


Conflict of interest statement

Declaration of interests J. Mieczkowski is a co-founder of and shareholder in Genegoggle.

Figures
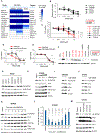
Figure 1.
Figure 1.. Epigenetic inhibitor screening in H3K27M-expressing paediatric high-grade glioma cells revealed HDACi-dependent decrease of the H3.3K27M oncohistone
A. SF8628, SF7761 and WG27 cells were treated for 72 hours with the indicated drugs (10 μM) and subjected to cell viability assay (MTT metabolism). Darker blue colours (legend closer to 0) show stronger cell killing by a particular drug. GSK-J4 and Panobinostat are shown as positive controls. B. SF7761, SF8628, WG27, WG30, WG32 cell lines expressing H3.3K27M were treated with serial dilutions of SB939, as indicated, and their cell viability was assessed after 72 hours by MTT assay. Mean cell viability and standard deviation (SD) is plotted from three independent experiments. C. Patient-derived pHGG neurospheres expressing either H3.3K27M (red) or wild-type (WT) H3.3 (black) were treated with SB939 at increasing cell concentrations. Cell viability was assessed; mean cell viability and s.d. is plotted from three independent experiments. Two-way ANOVA test showed statistically significant difference between the H3.3K27M and H3.3 WT groups of cells (P=0.019). Multiple comparison showed significant differences at 1 and 10 μM treatments (adjusted P value of 0.002 and 0.003, respectively). D–E. HSJ019 and DIPGXIII pHGG-derived cells expressing H3.3K27M and their isogenic pairs with the deleted H3F3A mutated allele (K27M-KO) were treated with SB939 at dilutions shown and assessed for cell viability. Data is shown as mean cell viability and s.d. from three independent experiments. Two-way ANOVA test between parental (H3.3K27M+) and K27M-KO cells shows statistically significant difference only for HSJ019 cell line in D (adjusted P = 0.005). F. Presence of the histone H3.3 mutation resulting in pH3.3K27M substitution was verified by Western blotting of cell lysates. 24-hour treatment with 1 μM SB939 was included as indicated. G. SB939-dependent decrease in H3.3K27M protein levels in WG30 cells treated with selected drugs from A as demonstrated by Western blotting. H. A dose-dependent decrease of H3.3K27M protein after 48 hours of SB939 treatment shown by Western blotting. A representative experiment of three independent repeats is shown. I–J. The H3.3K27M protein levels 16 hours of SB939 treatment in DIPGXIII (I) and SF7761 (J) cells as shown by Western blotting. A representative experiment of three independent repeats is shown. K. Time-dependent decrease of H3.3K27M levels in response to SB939 treatment as shown by Western blotting. A representative experiment of three independent repeats is shown. L. Densitometry of H3.3K27M blots relative to β-actin from (K) shows mean and s.d. from three independent experiments. Statistically significant changes (P<0.0001) were calculated with one-way ANOVA. Dunnett’s multiple comparisons test shows differences for each time-point in relation to DMSO control (adjusted P values indicated on the graph). M. Histone protein expression levels in SF7761 spheres treated for 24 hours with HDAC inhibitors: SB939 (1 μM), panobinostat (0.05 μM), Vorinostat (1 μM), Entinostat (1 μM) or DMSO control. Total protein extracts were analysed by Western blotting with the antibodies indicated. A representative blot for 3 independent experiments is shown.
Figure 2.
Figure 2.. SB939 treatment leads to the loss of H3.3K27M occupancy at the chromatin and specific transcriptomic changes.
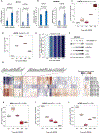
A-B. ChIP-seq results for H3.3 (top panel) and H3.3K37M (bottom panel) profiles around TSS (+/−1 kb) of all protein-coding genes in the SF7761 (A) and DIPGXIII (B) cells treated with DMSO (blue) or 1 μM SB9393 (red) for 16 hours. C. Average gene expression levels in the sets of up- or down-regulated genes in SF7761 and DIPGXIII cells at 16 hours after 1 μM SB939 treatment is shown (red). Gene expression in DMSO controls is shown in blue. D–E. Heatmaps showing the H3.3K27M occupancy at up-regulated (D) and down-regulated (E) genes in SF7761 cells. For each pair, the left and right heatmaps correspond to cells treated for 16 hours with DMSO or 1 μM SB939, respectively. Rows in all heatmaps were ordered by the gene expression level in control DMSO-treated cells (the lowest expression in DMSO at the top). F. The number of identified H3.3K27M peaks. The peaks were identified in both cell lines separately and only numbers of overlapped peaks are reported. The blue and the red bars correspond to cells treated for 16 hours with DMSO or SB939, respectively. The genomic distribution is reported for the peaks lost after the SB939 treatment. G. Heatmap showing normalised (z-scores) gene expression of 26 genes positively associated with the presence of the H3.3K27M oncohistone based on Bender et al. [12]. Treatment with SB939 shows decreased expression of these genes (blue). H. Example IGV profiles illustrating H3.3K27M loss in SF7761 cells after SB939 treatment at down-regulated genes are shown. Profiles of H3.3, H3.3K27M ChIP-seq and RNA-seq are shown for DMSO or SB939 treatment. Profiles were scaled for each gene locus individually.
Figure 3.
Figure 3.. SB939-dependent loss of H3.3K27M is irrespective of H3F3A mRNA expression
A–B. Expression of H3F3A and H3F3B mRNA after 16 hours of treatment with SB939 was tested with qPCR in SF7761 (A) and DIPGXIII (B) cells. GAPDH was used as a housekeeping gene. Mean expression and s.d. is shown from three independent experiments. Two-tailed student’s t-tests determined the statistical significance, as indicated with P values. C–D. RNAseq of DIPGXIII cells treated with SB939 (1 μM, 3–72 hours) was carried probing for expression of H3F3A (C) and H3F3B (D) transcripts. E. Fraction of RNAseq reads with ATG contig of all sequences aligned to H3.3 lysine 27 locus. Control (ctrl) stands for DMSO, and colours represent time points after SB939 treatment. The analysis was computed for three independent replicates. The fraction was computed as number of reads with mutated sequences (ATG) to number of total sequences aligned to H3.3 K27 locus. Bars and whiskers correspond to average and standard deviation respectively. P-value shown above the plot was computed with one-way anova test. The analysis was done for DIPGXIII cell line. F. Western blotting corresponding for the samples from DIPGXIII cells treated as in C-D shows expression of indicated histones and control β-actin. G. Heatmap showing gene expression changes (z-scores) of 143 genes previously reported as H3K27M-dependent [12] in the SB939 time course treatment analysis from Figure 3C–D. Conditions and replicates are indicated in the right-hand side. The profiles were clustered using hierarchical method. H–J. Expression of HIRA, DAXX and ATRX histone H3.3 chaperones is plotted for samples from Figure 3C–D.
Figure 4.
Figure 4.. SB939 leads to the specific loss of H3.3K27M protein, which is partially reversed via chloroquine treatment
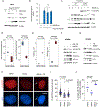
A. LN18 cells were transfected with Flag-H3.3K27M and 48 hours later exposed to 1 μM SB939 for the times indicated. Western blotting with anti-Flag and anti-H3.3K27M antibodies indicates downregulation of the H3.3K27M protein. B. Expression of Flag-H3.3K27M transgene in experiment shown in C was confirmed by qPCR with forward primer containing Flag sequence and reverse primer binding within H3F3A coding sequence. GAPDH was used as a housekeeping gene. C. LN18 cells were transfected either with Flag-H3.3K27M of Flag-H3.3WT (as indicated) and 48 hours later exposed to 1 μM SB939 for the indicated times. Western blotting with anti-Flag, anti-H3.3K27M And anti-H3.3 antibodies shows expression of transfected histones, accordingly. The top arrow at the H3.3 blot indicates the overexpressed flag-tagged protein and the lower arrow indicates the endogenous H3.3 protein. A representative experiment from 3 independent repeats is shown. D. Distribution of ratio of H3.3K27M (H3.3K27M_27–40) versus H3.3 wild type (H3.3K27WT_27–40) peptides analysed with mass spectrometry in SF7761 and DIPGXIII cell-lines treated for 16 hours with DMSO control or with SB939, as indicated. E. Distribution of H3K27ac_27–40 peptides analysed with mass spectrometry in SF7761 and DIPGXIII cell-lines treated for 16 hours with DMSO control or with SB939, as indicated. F. SF8628 cells were treated for 1h with 1 μM SB939 in the presence or absence of 1 μM MG-132 proteasome inhibitor. Western blotting was performed with the indicated antibodies. HIF-1α rescue with MG-132 was shown as a positive control for the proteasome inhibition. A representative experiment is shown for three independent repeats. G. SF8628 cells were treated for 1h with 1 μM SB939 in the presence or absence of 200 μM chloroquine (CQ). Western blotting was performed with the indicated antibodies. LC3 lipidation is shown as a positive control for CQ treatment. A representative experiment is shown for three independent repeats. H. Cells were seeded on coverslips and 24 hours later were exposed to SB939 and CQ treatment for 1 hour, as indicated. Immunofluorescent staining of H3.3K27M (red) and nuclei (DAPI, blue) was performed, as shown with the representative images. White arrows in the bottom panel indicate example vesicles quantified in J. Scale bar, 10 μm. I. Quantitation of nuclear fluorescence intensity of H3.3K27M staining from H was performed for three independent experiments and over 100 of cells were analysed in each condition. Mean intensity per cell (blue line) and standard deviation (black error bars) are overlayed on the top of all measured nuclei in each condition. Unpaired student’s t-test was used to determine statistical significance, as indicated with P values. J. A graph showing % of cells with extranuclear vesicles positive for DNA (DAPI, blue) and H3.3K27M (red) in each treatment condition (example vesicles indicated with white arrows in H). A mean % from three independent experiments (blue line) and standard deviation are shown. Paired student’s t-test was used to determine statistical significance, as indicated with P values.
Figure 5.
Figure 5.. Presence of H2A.Z predisposes pHGG cells to the loss of H3.3K27M during HDAC inhibition with SB939.
A. DIPGXIII, SF8628 and SF7761 cells were exposed to 1 μM SB939 treatment for one hour and samples were subjected to Western blotting with the indicated antibodies. A representative blots of at least three independent experiments are shown. B. Heatmaps showing the H2A.Z occupancy around transcriptional start sites (TSSs) in up-regulated genes in SF7761 cells. The left and right heatmap corresponds to DMSO and SB939 treatment, respectively. Rows in heatmaps were ordered by the gene expression level in control DMSO-treated cells (the lowest expression in DMSO at the top). C. The histone variant profiles around TSS in SF7761 cells treated with SB939 for 16 hours. The average H2A.Z (top panel), H3.3K27M (middle panel) and H3.3 (bottom panel) profiles around TSS (+/−2kb) of all protein-coding genes (black line), all up-regulated genes (red), and up-regulated genes with H3.3K27M loss after SB939 treatment (blue) are shown. The left and right plots correspond to control cells and cells after SB939 treatment, respectively. D. Examples illustrating H3.3K27M and H2A.Z loss in SF7761 cells after SB939 treatment at up-regulated genes. Profiles of H3.3, H3.3K27M, H2A.Z ChIP-seq and RNA-seq at the loci encompassing selected up-regulated genes. Profiles were scaled for each gene locus individually. E. SF8628 cells were double-transfected with siRNAs against H2AFZ and H2AFV transcripts, control siRNA (Scr-si) or Mock (no siRNA). Efficient knock-down of H2AFZ and H2AFV at 72 hours post-transfection was verified by qPCR with specific primers in relation to GAPDH housekeeping gene. F. SF8628 cells were transfected as in E and 48 hours post-transfection cells were treated with 1 μM SB939 or DMSO for 24 hours. Samples were then subjected to Western blotting with the indicated antibodies. A representative experiment from three independent repeats is shown. The bottom panel shows quantitation of H3.3K27M densitometry normalised to β-actin. G. A scheme showing SB939-dependent downregulation of H3.3K27M in DIPG cells. Upon treatment with SB939, histones present in the nucleosomes undergo rapid hyperacetylation, including the histone variant H2A.Z. Co-occurrence of H2A.Z predisposes cells to the SB939-mediated H3.3K27M loss. The loss of H3.3K27M by SB939 is blocked in the presence of chloroquine, a lysosomal inhibitor and DNA-intercalating agent.

References

    1. Kornberg RD (1974). Chromatin structure: A repeating unit of histones and DNA. Science (80-. ). 184, 868–871. - PubMed
    1. Buschbeck M, and Hake SB (2017). Variants of core histones and their roles in cell fate decisions, development and cancer. Nat. Rev. Mol. Cell Biol 18, 299–314. - PubMed
    1. Maze I, Noh KM, Soshnev AA, and Allis CD (2014). Every amino acid matters: Essential contributions of histone variants to mammalian development and disease. Nat. Rev. Genet 15, 259–71. - PMC - PubMed
    1. O’Donnell A, Yang SH, and Sharrocks AD (2013). PARP1 orchestrates variant histone exchange in signal-mediated transcriptional activation. EMBO Rep. 14, 1084–1091. - PMC - PubMed
    1. Coleman-Derr D, and Zilberman D (2012). Deposition of Histone Variant H2A.Z within Gene Bodies Regulates Responsive Genes. PLoS Genet. 8, e1002988. - PMC - PubMed

Publication types