

Say farewell to bland regression reporting: Three forest plot variations for visualizing linear models
- PMID: 38306346
- PMCID: PMC10836698
- DOI: 10.1371/journal.pone.0297033
Say farewell to bland regression reporting: Three forest plot variations for visualizing linear models
Abstract
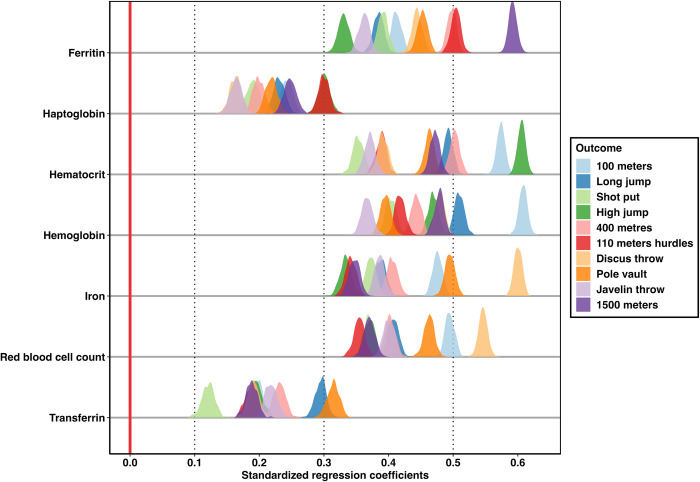
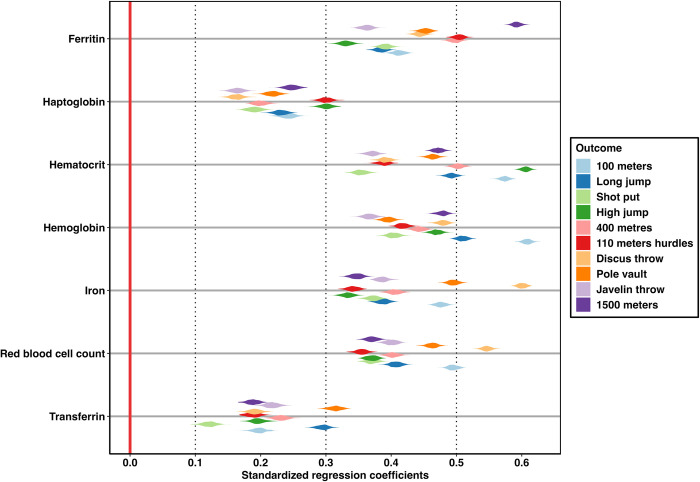
Regression ranks among the most popular statistical analysis methods across many research areas, including psychology. Typically, regression coefficients are displayed in tables. While this mode of presentation is information-dense, extensive tables can be cumbersome to read and difficult to interpret. Here, we introduce three novel visualizations for reporting regression results. Our methods allow researchers to arrange large numbers of regression models in a single plot. Using regression results from real-world as well as simulated data, we demonstrate the transformations which are necessary to produce the required data structure and how to subsequently plot the results. The proposed methods provide visually appealing ways to report regression results efficiently and intuitively. Potential applications range from visual screening in the model selection stage to formal reporting in research papers. The procedure is fully reproducible using the provided code and can be executed via free-of-charge, open-source software routines in R.
Copyright: © 2024 Fries et al. This is an open access article distributed under the terms of the Creative Commons Attribution License, which permits unrestricted use, distribution, and reproduction in any medium, provided the original author and source are credited.
Conflict of interest statement
The authors have declared that no competing interests exist.
Figures
Similar articles
-
Proceedings of the Second Workshop on Theory meets Industry (Erwin-Schrödinger-Institute (ESI), Vienna, Austria, 12-14 June 2007).J Phys Condens Matter. 2008 Feb 13;20(6):060301. doi: 10.1088/0953-8984/20/06/060301. Epub 2008 Jan 24. J Phys Condens Matter. 2008. PMID: 21693862
-
smplot: An R Package for Easy and Elegant Data Visualization.Front Genet. 2021 Dec 15;12:802894. doi: 10.3389/fgene.2021.802894. eCollection 2021. Front Genet. 2021. PMID: 34976028 Free PMC article.
-
tidyMicro: a pipeline for microbiome data analysis and visualization using the tidyverse in R.BMC Bioinformatics. 2021 Feb 1;22(1):41. doi: 10.1186/s12859-021-03967-2. BMC Bioinformatics. 2021. PMID: 33526006 Free PMC article.
-
Interventions to promote technology adoption in firms: A systematic review.Campbell Syst Rev. 2021 Nov 3;17(4):e1181. doi: 10.1002/cl2.1181. eCollection 2021 Dec. Campbell Syst Rev. 2021. PMID: 36950339 Free PMC article. Review.
-
On the application, reporting, and sharing of in silico simulations for genetic studies.Genet Epidemiol. 2021 Mar;45(2):131-141. doi: 10.1002/gepi.22362. Epub 2020 Oct 16. Genet Epidemiol. 2021. PMID: 33063887 Free PMC article. Review.
References
-
- Lindl A, Krauss S, Schilcher A, Hilbert S. Statistical Methods in Transdisciplinary Educational Research. Frontiers in Education. 2020;5.
-
- Leppink J. Statistical methods for experimental research in education and psychology: Springer; 2019.
MeSH terms
LinkOut - more resources
Full Text Sources
