

Dental complexity and diet in amniotes: A meta-analysis
- PMID: 38306370
- PMCID: PMC10836679
- DOI: 10.1371/journal.pone.0292358
Dental complexity and diet in amniotes: A meta-analysis
Abstract
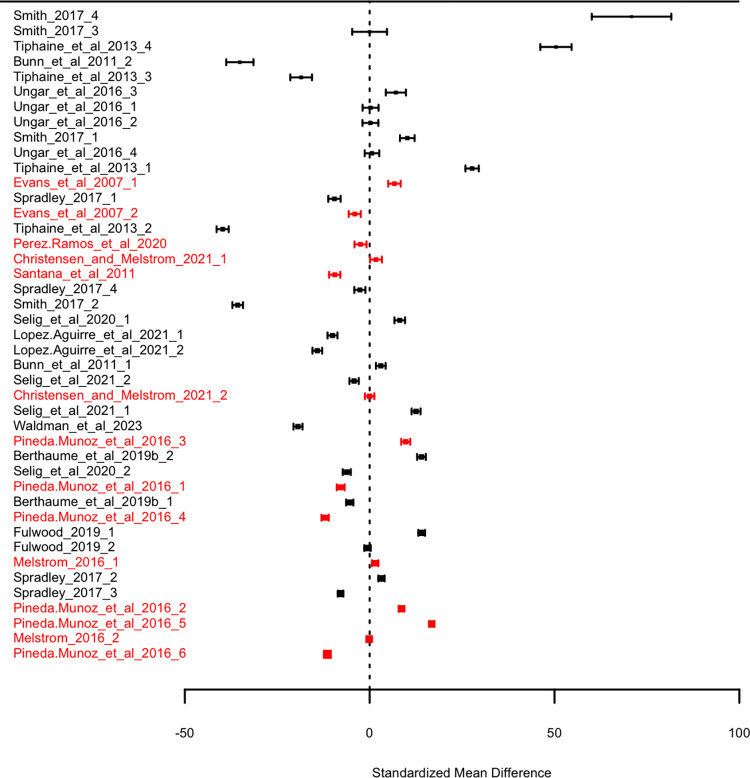
Tooth morphology is among the most well-studied indicators of ecology. For decades, researchers have examined the gross morphology and wear patterns of teeth as indicators of diet, and recent advances in scanning and computer analysis have allowed the development of new and more quantitative measures of tooth morphology. One of the most popular of these new methods is orientation patch count (OPC). OPC, a measure of surface complexity, was originally developed to distinguish the more complex tooth crowns of herbivores from the less complex tooth crowns of faunivores. OPC and a similar method derived from it, orientation patch count rotated (OPCR), have become commonplace in analyses of both modern and fossil amniote dietary ecology. The widespread use of these techniques makes it possible to now re-assess the utility of OPC and OPCR. Here, we undertake a comprehensive review of OPC(R) and diet and perform a meta-analysis to determine the overall difference in complexity between herbivores and faunivores. We find that the relationship between faunivore and herbivore OPC or OPCR values differs substantially across studies, and although some support the initial assessment of greater complexity in herbivores, others do not. Our meta-analysis does not support an overall pattern of greater complexity in herbivores than faunivores across terrestrial amniotes. It appears that the relationship of OPC or OPCR to diet is taxon-specific and dependent on the type of faunivory of the group in question, with insectivores often having values similar to herbivores. We suggest extreme caution in comparing OPC and OPCR values across studies and offer suggestions for how OPCR can constructively be used in future research.
Copyright: © 2024 DeMers, Hunter. This is an open access article distributed under the terms of the Creative Commons Attribution License, which permits unrestricted use, distribution, and reproduction in any medium, provided the original author and source are credited.
Conflict of interest statement
The authors have declared that no competing interests exist.
Figures


References
-
- Bunn JM, Boyer DM, Lipman Y, St. Clair EM, Jernvall J, Daubechies I. Comparing Dirichlet normal surface energy of tooth crowns, a new technique of molar shape quantification for dietary inference, with previous methods in isolation and in combination. American Journal of Physical Anthropology. 2011. Jun 1;145(2):247–61. doi: 10.1002/ajpa.21489 - DOI - PubMed
-
- Green JL, Croft DA. Using Dental Mesowear and Microwear for Dietary Inference: A Review of Current Techniques and Applications. In: Croft DA, Su DF, Simpson SW, editors. Methods in Paleoecology: Reconstructing Cenozoic Terrestrial Environments and Ecological Communities. Cham, Switzerland: Springer International Publishing; 2018. p. 53–73. (Vertebrate Paleobiology and Paleoanthropology).
-
- Pineda-Munoz S, Lazagabaster IA, Alroy J, Evans AR. Inferring diet from dental morphology in terrestrial mammals. Methods in Ecology and Evolution. 2017;8(4):481–91.
Publication types
MeSH terms
LinkOut - more resources
Full Text Sources
