Evaluation of ATNPD Framework and Biofluid Markers to Predict Cognitive Decline in Early Parkinson Disease
- PMID: 38306599
- PMCID: PMC11383879
- DOI: 10.1212/WNL.0000000000208033
Evaluation of ATNPD Framework and Biofluid Markers to Predict Cognitive Decline in Early Parkinson Disease
Erratum in
-
Corrections to Preprint Server Information.Neurology. 2024 Jul 9;103(1):e209573. doi: 10.1212/WNL.0000000000209573. Epub 2024 Jun 3. Neurology. 2024. PMID: 38830142 Free PMC article. No abstract available.
Abstract
Background and objectives: In Parkinson disease (PD), Alzheimer disease (AD) copathology is common and clinically relevant. However, the longitudinal progression of AD CSF biomarkers-β-amyloid 1-42 (Aβ42), phosphorylated tau 181 (p-tau181), and total tau (t-tau)-in PD is poorly understood and may be distinct from clinical AD. Moreover, it is unclear whether CSF p-tau181 and serum neurofilament light (NfL) have added prognostic utility in PD, when combined with CSF Aβ42. First, we describe longitudinal trajectories of biofluid markers in PD. Second, we modified the AD β-amyloid/tau/neurodegeneration (ATN) framework for application in PD (ATNPD) using CSF Aβ42 (A), p-tau181 (T), and serum NfL (N) and tested ATNPD prediction of longitudinal cognitive decline in PD.
Methods: Participants were selected from the Parkinson's Progression Markers Initiative cohort, clinically diagnosed with sporadic PD or as controls, and followed up annually for 5 years. Linear mixed-effects models (LMEMs) tested the interaction of diagnosis with longitudinal trajectories of analytes (log transformed, false discovery rate [FDR] corrected). In patients with PD, LMEMs tested how baseline ATNPD status (AD [A+T+N±] vs not) predicted clinical outcomes, including Montreal Cognitive Assessment (MoCA; rank transformed, FDR corrected).
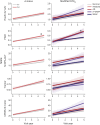
Results: Participants were 364 patients with PD and 168 controls, with comparable baseline mean (±SD) age (patients with PD = 62 ± 10 years; controls = 61 ± 11 years]; Mann-Whitney Wilcoxon: p = 0.4) and sex distribution (patients with PD = 231 male individuals [63%]; controls = 107 male individuals [64%]; χ2: p = 1). Patients with PD had overall lower CSF p-tau181 (β = -0.16, 95% CI -0.23 to -0.092, p = 2.2e-05) and t-tau than controls (β = -0.13, 95% CI -0.19 to -0.065, p = 4e-04), but not Aβ42 (p = 0.061) or NfL (p = 0.32). Over time, patients with PD had greater increases in serum NfL than controls (β = 0.035, 95% CI 0.022 to 0.048, p = 9.8e-07); slopes of patients with PD did not differ from those of controls for CSF Aβ42 (p = 0.18), p-tau181 (p = 1), or t-tau (p = 0.96). Using ATNPD, PD classified as A+T+N± (n = 32; 9%) had worse cognitive decline on global MoCA (β = -73, 95% CI -110 to -37, p = 0.00077) than all other ATNPD statuses including A+ alone (A+T-N-; n = 75; 21%).
Discussion: In patients with early PD, CSF p-tau181 and t-tau were low compared with those in controls and did not increase over 5 years of follow-up. Our study shows that classification using modified ATNPD (incorporating CSF Aβ42, CSF p-tau181, and serum NfL) can identify biologically relevant subgroups of PD to improve prediction of cognitive decline in early PD.
Conflict of interest statement
L.M. Shaw received support in an investigator-initiated grant from Roche for all immunoassay reagents and instrumentation for the analyses in CSF samples of Aβ42, t-tau, and ptau181. Authors report no conflicts of interest relevant to this study. Go to
Figures


References
MeSH terms
Substances
Grants and funding
LinkOut - more resources
Full Text Sources
Medical
