

Cell-type deconvolution of bulk-blood RNA-seq reveals biological insights into neuropsychiatric disorders
- PMID: 38306997
- PMCID: PMC10870131
- DOI: 10.1016/j.ajhg.2023.12.018
Cell-type deconvolution of bulk-blood RNA-seq reveals biological insights into neuropsychiatric disorders
Abstract
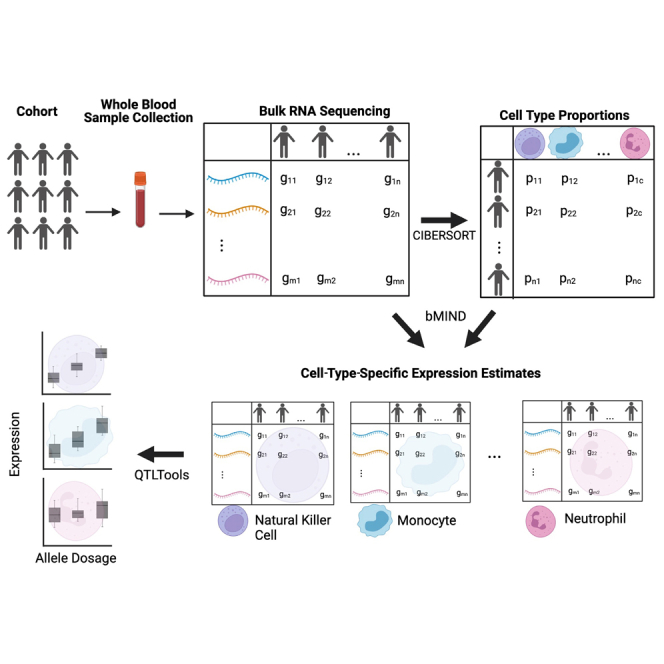
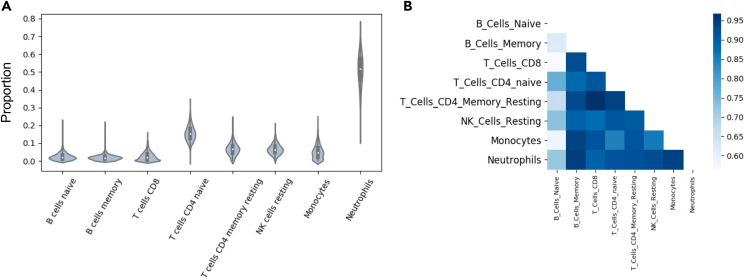
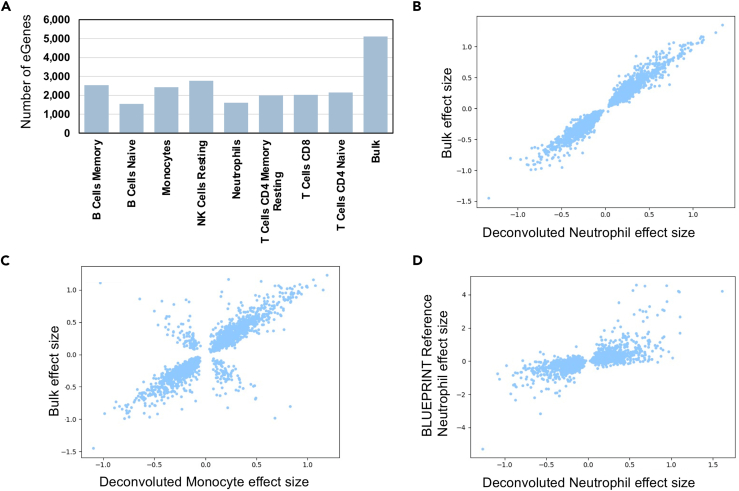
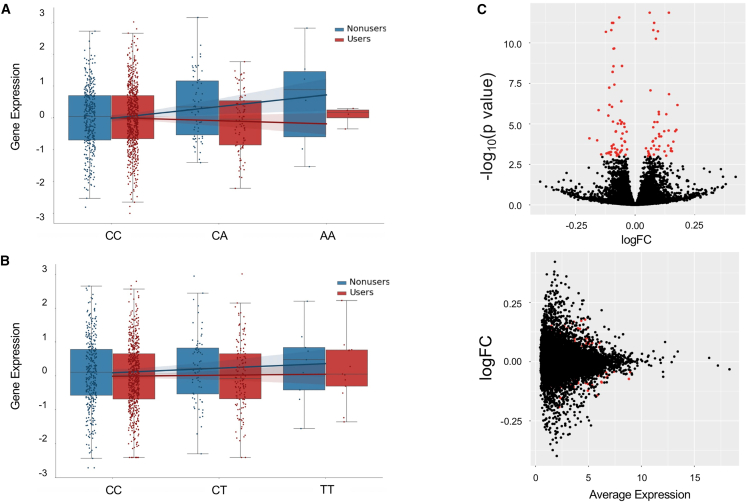
Genome-wide association studies (GWASs) have uncovered susceptibility loci associated with psychiatric disorders such as bipolar disorder (BP) and schizophrenia (SCZ). However, most of these loci are in non-coding regions of the genome, and the causal mechanisms of the link between genetic variation and disease risk is unknown. Expression quantitative trait locus (eQTL) analysis of bulk tissue is a common approach used for deciphering underlying mechanisms, although this can obscure cell-type-specific signals and thus mask trait-relevant mechanisms. Although single-cell sequencing can be prohibitively expensive in large cohorts, computationally inferred cell-type proportions and cell-type gene expression estimates have the potential to overcome these problems and advance mechanistic studies. Using bulk RNA-seq from 1,730 samples derived from whole blood in a cohort ascertained from individuals with BP and SCZ, this study estimated cell-type proportions and their relation with disease status and medication. For each cell type, we found between 2,875 and 4,629 eGenes (genes with an associated eQTL), including 1,211 that are not found on the basis of bulk expression alone. We performed a colocalization test between cell-type eQTLs and various traits and identified hundreds of associations that occur between cell-type eQTLs and GWASs but that are not detected in bulk eQTLs. Finally, we investigated the effects of lithium use on the regulation of cell-type expression loci and found examples of genes that are differentially regulated according to lithium use. Our study suggests that applying computational methods to large bulk RNA-seq datasets of non-brain tissue can identify disease-relevant, cell-type-specific biology of psychiatric disorders and psychiatric medication.
Keywords: cell type; deconvolution; eQTL; gene expression; neuropsychiatric.
Published by Elsevier Inc.
Conflict of interest statement
Declaration of interests Tommer Schwarz currently is employed at Cytoreason in Tel Aviv, Israel. The remaining authors declare no competing interests.
Figures

Update of
-
Cell type deconvolution of bulk blood RNA-Seq to reveal biological insights of neuropsychiatric disorders.bioRxiv [Preprint]. 2023 May 25:2023.05.24.542156. doi: 10.1101/2023.05.24.542156. bioRxiv. 2023. Update in: Am J Hum Genet. 2024 Feb 1;111(2):323-337. doi: 10.1016/j.ajhg.2023.12.018. PMID: 37293101 Free PMC article. Updated. Preprint.
Similar articles
-
Cell type deconvolution of bulk blood RNA-Seq to reveal biological insights of neuropsychiatric disorders.bioRxiv [Preprint]. 2023 May 25:2023.05.24.542156. doi: 10.1101/2023.05.24.542156. bioRxiv. 2023. Update in: Am J Hum Genet. 2024 Feb 1;111(2):323-337. doi: 10.1016/j.ajhg.2023.12.018. PMID: 37293101 Free PMC article. Updated. Preprint.
-
Deconvolution of bulk blood eQTL effects into immune cell subpopulations.BMC Bioinformatics. 2020 Jun 12;21(1):243. doi: 10.1186/s12859-020-03576-5. BMC Bioinformatics. 2020. PMID: 32532224 Free PMC article.
-
A computational method for cell type-specific expression quantitative trait loci mapping using bulk RNA-seq data.Nat Commun. 2023 May 25;14(1):3030. doi: 10.1038/s41467-023-38795-w. Nat Commun. 2023. PMID: 37231002 Free PMC article.
-
eQTL studies: from bulk tissues to single cells.J Genet Genomics. 2023 Dec;50(12):925-933. doi: 10.1016/j.jgg.2023.05.003. Epub 2023 May 18. J Genet Genomics. 2023. PMID: 37207929 Free PMC article. Review.
-
Research progress on single-cell expression quantitative trait loci.Yi Chuan. 2024 Oct;46(10):795-806. doi: 10.16288/j.yczz.24-162. Yi Chuan. 2024. PMID: 39443309 Review.
Cited by
-
A scoping review of statistical methods to investigate colocalization between genetic associations and microRNA expression in osteoarthritis.Osteoarthr Cartil Open. 2024 Nov 8;6(4):100540. doi: 10.1016/j.ocarto.2024.100540. eCollection 2024 Dec. Osteoarthr Cartil Open. 2024. PMID: 39640910 Free PMC article.
