. 2024 Mar:81:101890.
doi: 10.1016/j.molmet.2024.101890. Epub 2024 Feb 1.

Human ACVR1C missense variants that correlate with altered body fat distribution produce metabolic alterations of graded severity in knock-in mutant mice

Affiliations

Human ACVR1C missense variants that correlate with altered body fat distribution produce metabolic alterations of graded severity in knock-in mutant mice

Pawanrat Tangseefa et al. Mol Metab. 2024 Mar.

Abstract

Background & aims: Genome-wide studies have identified three missense variants in the human gene ACVR1C, encoding the TGF-β superfamily receptor ALK7, that correlate with altered waist-to-hip ratio adjusted for body mass index (WHR/BMI), a measure of body fat distribution.

Methods: To move from correlation to causation and understand the effects of these variants on fat accumulation and adipose tissue function, we introduced each of the variants in the mouse Acvr1c locus and investigated metabolic phenotypes in comparison with a null mutation.

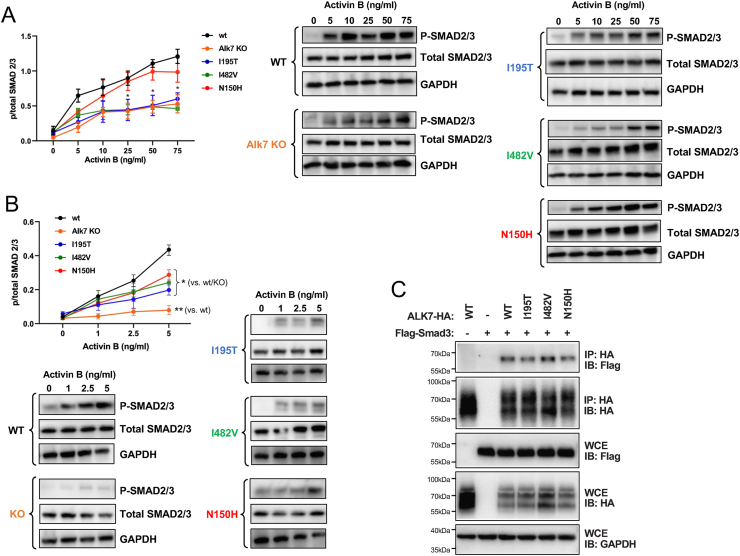
Results: Mice carrying the I195T variant showed resistance to high fat diet (HFD)-induced obesity, increased catecholamine-induced adipose tissue lipolysis and impaired ALK7 signaling, phenocopying the null mutants. Mice with the I482V variant displayed an intermediate phenotype, with partial resistance to HFD-induced obesity, reduction in subcutaneous, but not visceral, fat mass, decreased systemic lipolysis and reduced ALK7 signaling. Surprisingly, mice carrying the N150H variant were metabolically indistinguishable from wild type under HFD, although ALK7 signaling was reduced at low ligand concentrations.

Conclusion: Together, these results validate ALK7 as an attractive drug target in human obesity and suggest a lower threshold for ALK7 function in humans compared to mice.

Keywords: Adipose tissue; Lipolysis; Obesity; Single-nucleotide variant.


Conflict of interest statement

Declaration of competing interest The authors declare that they have no known competing financial interests or personal relationships that could have influenced the results reported in this paper.

Figures

Figure 1
Figure 1
Weight gain and energy consumption of knock-in mice carrying missense variants in Acvr1c. (A) mRNA levels assessed by quantitative RT-PCR for Acvr1c, encoding ALK7, in WAT of adult male mice. Data are presented as mean ± SEM of relative mRNA levels (normalized to wild type levels). ∗∗∗∗, p < 0.0001; N = 5 mice per genotype (one-way ANOVA with Tukey's post-hoc test). (B) Representative Western blot of ALK7 protein expression in mature adipocytes purified form inguinal WAT of wild type (WT), I195T, N150H, I482V and knock-out (KO) male mice. Blot with glyceraldehyde phosphate dehydrogenase (GAPDH) was used as loading control. (C) Weight gain of wild type mice (wt), Alk7 knock-out mice (KO) and mice carrying missense variants fed on a normal chow diet (NCD) or high-fat diet (HFD) from 8 weeks of age (arrow) and for an additional 12.5 weeks. Data are presented as mean ± SEM. ∗, p < 0.05; ∗∗∗∗, p < 0.0001 vs. wt at 20.5 weeks (end of study); N = 10 mice per genotype (two-way ANOVA with Tukey's post-hoc test). (D) Final body weight at 20.5 weeks of age. Data are presented as mean ± SEM. ∗, p < 0.05; ∗∗∗∗, p < 0.0001 vs. wild type (wt); N = 10 mice per genotype (one-way ANOVA with Tukey's post-hoc test). (E) Average oxygen consumption, CO2 production and energy expenditure in wild type (WT), I195T and I482V mice fed on HFD for 12.5 weeks. Data are presented as mean ± STDEV. N = 5 mice per genotype. ∗∗, p < 0.01 vs. wild type (ANOVA). (F) Respiratory exchange ratio in wild type (WT), I195T and I482V mice fed on HFD for 12.5 weeks. Data are presented as mean ± SEM. N = 5 mice per genotype. (G) Oxygen consumption, CO2 production and energy expenditure in wild type (WT), I195T and I482V mice after accounting for differences in body weight. Data are presented as average ± SEM. N = 5 mice per genotype. ∗∗∗, p < 0.001 vs. wild type (ANCOVA).
Figure 2
Figure 2
Fat accumulation in wild type and ALK7 mutant mice after exposure to high-fat diet. (A) Wet-weight of inguinal, epididymal, scapular and perirenal white adipose tissue (WAT) in wild type (wt), Alk7 knock-out (KO) and I195T, I482V and N150H mice after 12.5 week high fat diet (20.5 weeks of age). Data are presented as mean ± SEM. ∗∗, p < 0.01; ∗∗∗∗, p < 0.0001; N = 10 mice per genotype (one-way ANOVA with Tukey's post-hoc test). (B) Morphology of adipocytes in epididymal WAT of the indicated genotypes (H&E staining) after HFD. Scale bar, 50 μm. (C) Size distribution of adipocytes in epididymal WAT of the indicated genotypes after HFD. Data are presented as mean ± SEM. ns, not significant difference; ∗, p < 0.05; ∗∗, p < 0.01; ∗∗∗, p < 0.001; n = 5 sections per animal, N = 5 mice per genotype (two-way ANOVA with Tukey's post-hoc test). (D) Leptin levels in serum in the indicated genotypes after HFD. Data are presented as mean ± SEM. ns, not significant difference; ∗, p < 0.05; ∗∗, p < 0.01; N = 6 mice per genotype (one-way ANOVA with Tukey's post-hoc test).
Figure 3
Figure 3
Glucose and insulin responses in wild type and ALK7 mutant mice. (A, B) Plasma glucose levels after 6 h fasting in 20.5 week old wild type and ALK7 mutant mice kept in normal chow diet (A) or after 12 week in HFD (B). Data are presented as mean ± SEM. ∗, p < 0.05; N = 6 mice per genotype (one-way ANOVA with Tukey's post-hoc test). (C, D) Glucose tolerance test in 20.5 week old wild type and ALK7 mutant mice kept in normal chow diet (A) or after 12 week in HFD (B). Data are presented as mean ± SEM. AUC, area under the curve. ∗∗, p < 0.01; ∗∗∗, p < 0.001; N = 10 mice per genotype (one-way ANOVA with Tukey's post-hoc test). (E, F) Insulin tolerance test in 20.5 week old wild type and ALK7 mutant mice kept in normal chow diet (A) or after 12 week in HFD (B). Data are presented as mean ± SEM. AUC, area under the curve. ∗, p < 0.05; ∗∗, p < 0.01; N = 10 mice per genotype (one-way ANOVA with Tukey's post-hoc test).
Figure 4
Figure 4
Liver fat accumulation and adipose tissue lipolysis in wild type and ALK7 mutant mice. (A) Representative images of H&E staining of liver sections of wild type and I195T mice after chow or high-fat diet (HFD). Scale bar, 150 μm. (B) Triglyceride levels in liver of wild type and I195T mice after chow (left) or HFD (right). Data are presented as mean ± SEM. ns, not signifiant difference; ∗, p < 0.05; N = 8 mice per genotype (one-way ANOVA with Tukey's post-hoc test). (C) In vivo lipolysis induced by i.p. injection of agonist to adrenergic receptor Adrb3 CL-316,243 (CL) in 20.5 week old wild type (wt) and ALK7 mutant mice kept in normal chow diet or after 12 week in HFD. Data are presented as mean ± SEM. ∗, p < 0.05; ∗∗, p < 0.01 vs. wild type; N = 8 mice per genotype (two-way ANOVA with Tukey's post-hoc test). (D) Ex vivo lipolysis in explants of inguinal (left) and epididymal (right) WAT from wild type and ALK7 mutant mice after HFD feeding induced by treatment with CL-316,243 (CL). Data are presented as mean ± SEM. ∗∗∗, p < 0.001; ∗∗∗∗, p < 0.0001; N = 5 mice per genotype (two-way ANOVA with Tukey's post-hoc test).
Figure 5
Figure 5
Gene expression analysis in epididymal WAT of wild type and ALK7 mutant mice after high-fat diet feeding. (A–E) mRNA levels assessed by quantitative RT-PCR for adrenergic receptors (A), lipolysis genes (B), mitochondria biogenesis master regulator Pcg1a (C), beta-oxidation genes (D), and inflammation genes (E). Data are presented as mean ± SEM of relative mRNA levels (normalized to wt levels). ∗, p < 0.05; ∗∗, p < 0.01; ∗∗∗, p < 0.001; ∗∗∗∗, p < 0.0001; N = 5 mice per genotype (one-way ANOVA with Tukey's post-hoc test). (F) Protein expression of CD36, HSL and ATGL in whole tissue extracts of epididymal WAT from wild type and ALK7 mutant mice after high-fat diet feeding analyzed by Western blotting. Data are presented as mean ± SEM relative to GAPDH levels (normalized to WT levels). ∗, p < 0.05; N = 4 mice per genotype (one-way ANOVA with Tukey's post-hoc test).
Figure 6
Figure 6
Comparison of body weight, fat accumulation and lipolysis between homozygous and heterozygous I195T mice. (A) Weight gain of wild type mice (WT), I195 heterozygous and homozygous mice fed on a normal chow diet (NCD) or high-fat diet (HFD) from 8 weeks of age (arrow). Data are presented as mean ± SEM. ∗, p < 0.05 vs. wt at 16 weeks (end of study); N = 10 mice per genotype (two-way ANOVA with Tukey's post-hoc test). (B) Wet-weight of inguinal (iWAT), epididymal (eWAT), scapular (scaWAT) and perirenal (perWAT) adipose tissue in wild type (WT), I195 heterozygous and homozygous mice after HFD feeding. Data are presented as mean ± SEM. ∗, p < 0.05. N = 5 mice per genotype (one-way ANOVA with Tukey's post-hoc test). (C, D) Ex vivo lipolysis in explants of inguinal (C) and epididymal (D) WAT from wild type (black), I195 heterozygous (red) and homozygous (blue) mice after HFD feeding induced by treatment with CL-316,243 (CL). Data are presented as mean ± SEM. ∗, p < 0.05; N = 5 mice per genotype (two-way ANOVA with Tukey's post-hoc test).
Figure 7
Figure 7
ALK7 signaling to Smad2/3 proteins in cultured adipocytes from wild type and ALK7 mutant mice. (A) Representative Western blots and quantification of Smad2/3 phosphorylation in cultured adipocytes from inguinal WAT of the indicated genotypes following treatment with activin B (0–75 ng/ml). The antibody used that does not distinguish between the two phospho-Smads. Total Smad2/3 and GAPDH (glyceraldehyde phosphate dehydrogenase) were probed as loading controls. Quantifications are presented as mean ± SEM of relative Smad2/3 phosphorylation (phospho/total). ∗, p < 0.05 vs. wt; N = 3 experiments each performed in triplicate (two-way ANOVA with Tukey's post-hoc test). (B) Idem (A) but for lower concentrations of activin B (0–5 ng/ml). ∗, p < 0.05 vs. wt and/KO; ∗∗, p < 0.01 vs. wt; N = 3 experiments each performed in triplicate (two-way ANOVA with Tukey's post-hoc test). (C) Co-immunoprecipitation of HA-tagged wild type (WT) and ALK7 variants with Flag-tagged Smad3 in transfected HEK293 cells. IP, immunoprecipitation; IB, immunoblotting, WCE, whole cell lysate.
Figure 8
Figure 8
ALK7 signaling to downstream target genes Adrb2, Adrb3 and Hsl in cultured adipocytes from wild type and ALK7 mutant mice. (A) Results of mRNA levels assessed by quantitative RT-PCR for Adrb2, Adrb3 and Hsl in cultured adipocytes from inguinal WAT of the indicated genotypes following treatment with 25 ng/ml activin B. Data are presented as mean ± SEM of relative mRNA levels (normalized to wt levels). ∗, p < 0.05; ∗∗∗, p < 0.001; N = 3 experiments each performed in triplicate (two-way ANOVA with Tukey's post-hoc test). (B) Representative Western blots of HSL (hormone-sensitive lipase) phosphorylation in cultured adipocytes from inguinal WAT of the indicated genotypes following treatment with 25 ng/ml activin B and/or 10 μM CL-316,243 (CL). Total HSL and GAPDH were probed as loading controls. (C) Quantification of phosphorylation-HSL levels in cultured adipocytes treated with activin B and/or CL as indicated. Color codes for genotypes are as in panel (A). Data are presented as mean ± SEM of relative HSL phosphorylation (phospho/total). ∗, p < 0.05 vs. wt; N = 3 experiments each performed in triplicate (two-way ANOVA with Tukey's post-hoc test).

Similar articles

Cited by

References

    1. Rydén M., Imamura T., Jörnvall H., Belluardo N., Neveu I., Trupp M., et al. A novel type I receptor serine-threonine kinase predominantly expressed in the adult central nervous system. J Biol Chem. 1996;271(48):30603–30609. doi: 10.1074/jbc.271.48.30603. - DOI - PubMed
    1. Tsuchida K., Sawchenko P.E., Nishikawa S., Vale W.W. Molecular cloning of a novel type I receptor serine/threonine kinase for the TGF beta superfamily from rat brain. Mol Cell Neurosci. 1996;7(6):467–478. doi: 10.1006/mcne.1996.0034. - DOI - PubMed
    1. Kang Y., Reddi A.H. Identification and cloning of a novel type I serine/threonine kinase receptor of the TGF-beta/BMP superfamily in rat prostate. Biochem Mol Biol Int. 1996;40(5):993–1001. doi: 10.1080/15216549600201623. - DOI - PubMed
    1. Guo T., Marmol P., Moliner A., Björnholm M., Zhang C., Shokat K.M., et al. Adipocyte ALK7 links nutrient overload to catecholamine resistance in obesity. Elife. 2014;3 doi: 10.7554/elife.03245. - DOI - PMC - PubMed
    1. Srivastava R.K., Lee E., Sim E., Sheng N.C., Ibáñez C.F. Sustained anti-obesity effects of life-style change and anti-inflammatory interventions after conditional inactivation of the activin receptor ALK7. Faseb J. 2021;35(8) doi: 10.1096/fj.202002785rr. - DOI - PubMed

Substances