. 2024 Mar:81:101889.
doi: 10.1016/j.molmet.2024.101889. Epub 2024 Feb 1.

The protease activated receptor 2 - CCAAT/enhancer-binding protein beta - SerpinB3 axis inhibition as a novel strategy for the treatment of non-alcoholic steatohepatitis

Affiliations

The protease activated receptor 2 - CCAAT/enhancer-binding protein beta - SerpinB3 axis inhibition as a novel strategy for the treatment of non-alcoholic steatohepatitis

Gianmarco Villano et al. Mol Metab. 2024 Mar.

Abstract

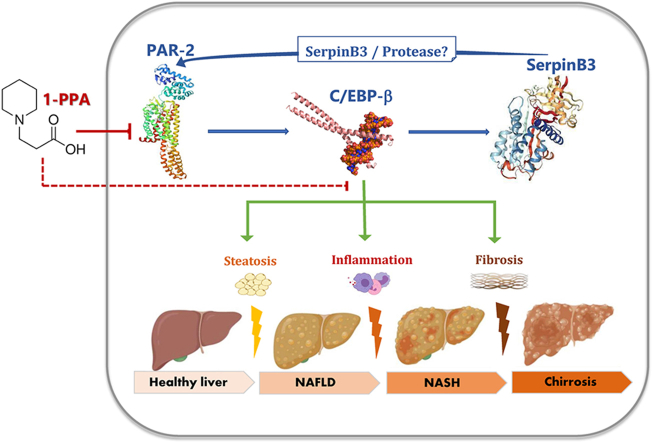
Objective: The serine protease inhibitor SerpinB3 has been described as critical mediator of liver fibrosis and it has been recently proposed as an additional hepatokine involved in NASH development and insulin resistance. Protease Activated Receptor 2 has been identified as a novel regulator of hepatic metabolism. A targeted therapeutic strategy for NASH has been investigated, using 1-Piperidine Propionic Acid (1-PPA), since this compound has been recently proposed as both Protease Activated Receptor 2 and SerpinB3 inhibitor.

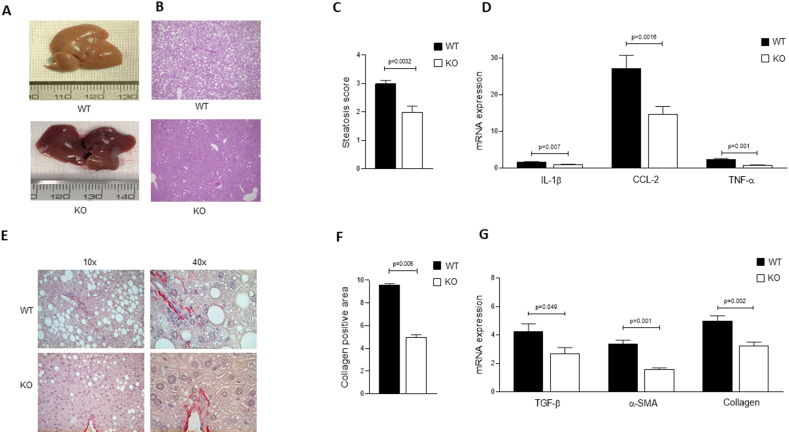
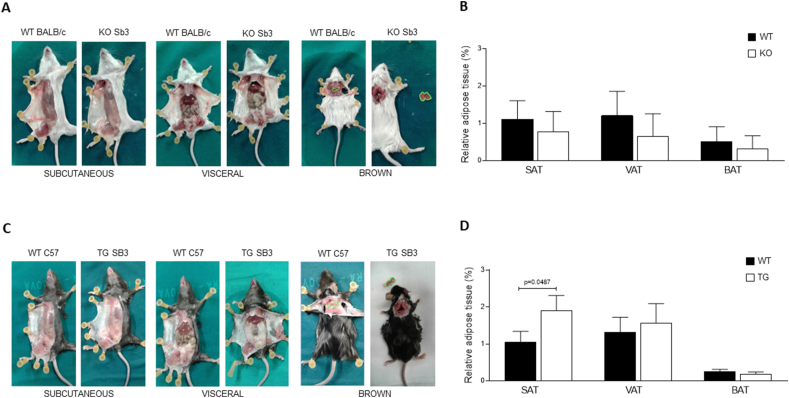
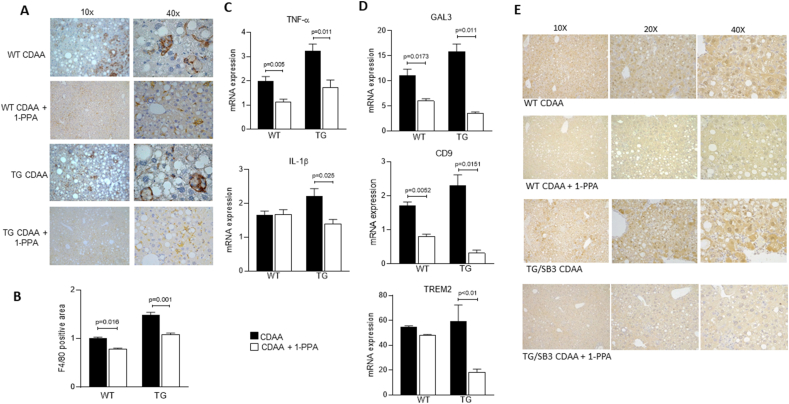
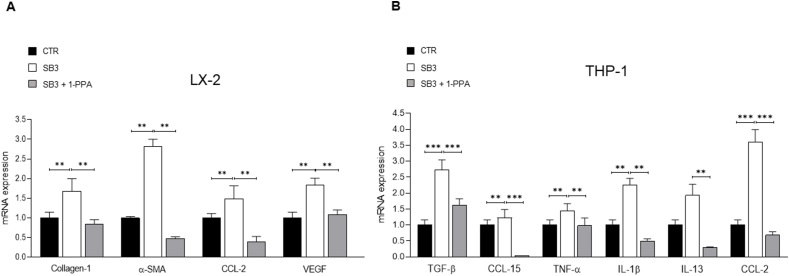
Methods: The effect of SerpinB3 on inflammation and fibrosis genes was assessed in human macrophage and stellate cell lines. Transgenic mice, either overexpressing SerpinB3 or carrying Serpinb3 deletion and their relative wild type strains, were used in experimental NASH models. Subgroups of SerpinB3 transgenic mice and their controls were also injected with 1-PPA to assess the efficacy of this compound in NASH inhibition.

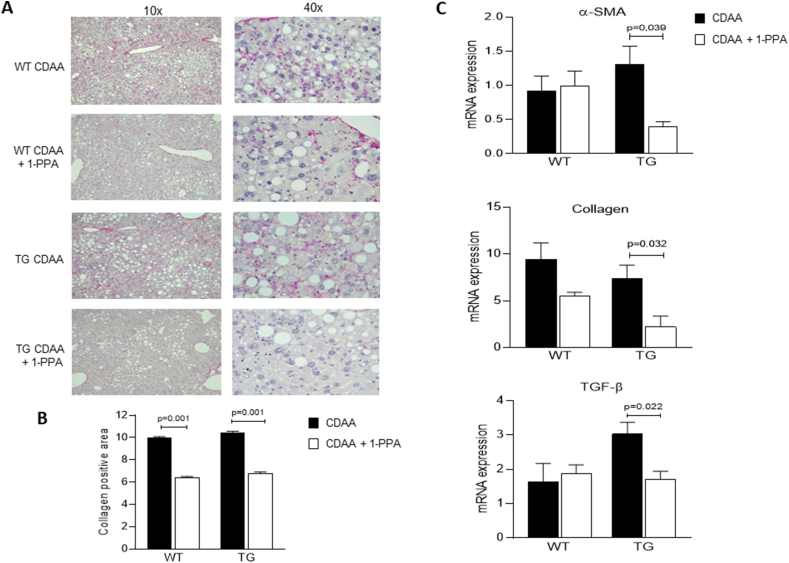
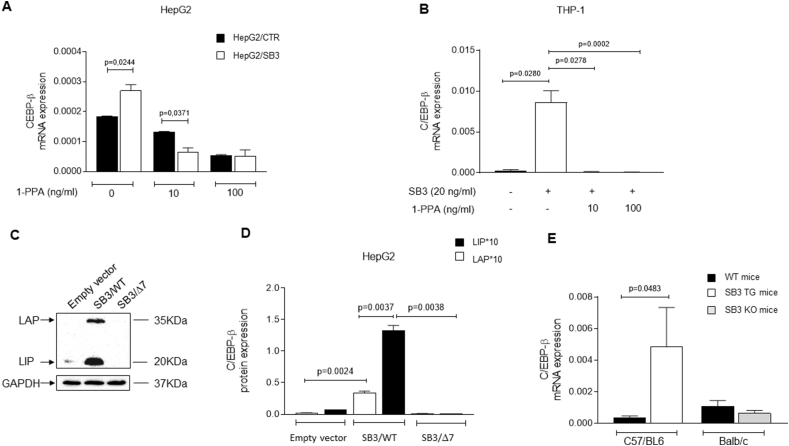
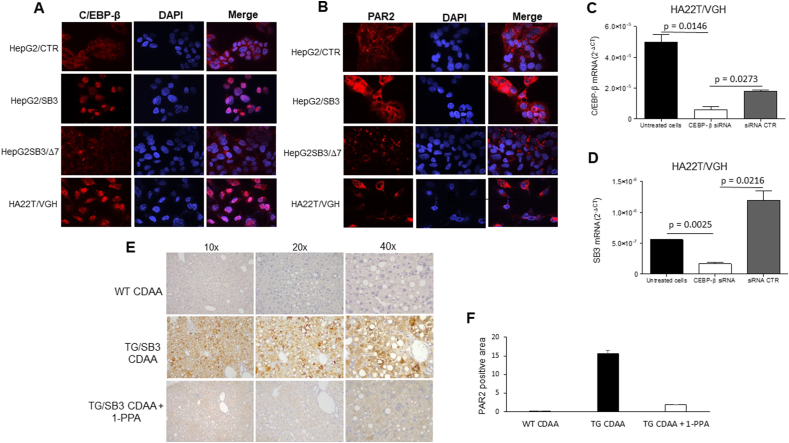
Results: 1-PPA did not present significant cell and organ toxicity and was able to inhibit SerpinB3 and PAR2 in a dose-dependent manner. This effect was associated to a parallel reduction of the synthesis of the molecules induced by endogenous SerpinB3 or by its paracrine effects both in vitro and in vivo, leading to inhibition of lipid accumulation, inflammation and fibrosis in experimental NASH. At mechanistic level, the antiprotease activity of SerpinB3 was found essential for PAR2 activation, determining upregulation of the CCAAT Enhancer Binding Protein beta (C/EBP-β), another pivotal regulator of metabolism, inflammation and fibrosis, which in turn determined SerpinB3 synthesis.

Conclusions: 1-PPA treatment was able to inhibit the PAR2 - C/EBP-β - SerpinB3 axis and to protect from NASH development and progression, supporting the potential use of a similar approach for a targeted therapy of NASH.

Keywords: Experimental NASH; Genetically manipulated mice; Serpins; Therapeutic drugs; Transcription factors.


Conflict of interest statement

Declaration of competing interest The authors declare the following financial interests/personal relationships which may be considered as potential competing interests: The authors declare that P.P., B.A., M.A., Q.S., R.M., T.C. and V.G. are listed as inventors of patent N. IT 102017000026858, European patent EP 392351 and P.P., B.A., L.C., M.C., Q.S., R.M., T.C. and V.G of the Italian Patent Application N. 102022000014593 filed by the University of Padova, PTC pending. No conflict of interest exists for the other authors.

Figures

Image 1
Graphical abstract
Figure 1
Figure 1
SerpinB3, lipid accumulation and development of murine NASH. Representative examples of morphological findings at sacrifice of the liver of a BALB/c wild-type mouse (WT) and of a mouse deficient of the reactive site loop of Serpinb3a (KO), fed with CDAA diet. A) liver macroscopic features, B) liver histology after hematoxylin eosin staining, E) collagen deposition assessed by Sirius red staining. The pictures provide evidence of the lower extent of steatosis in KO mouse, confirmed by the lower levels of steatosis scores detected by liver histology in KO mice (7 animals) compared to WT mice (7 animals) (C). Similar findings are reported for the profile of inflammatory genes (D), including IL-1β, CCL2 and TNF-α, and of fibrosis genes (G), including TGF−β, α-SMA and collagen 1A1. Densitometric analysis of collagen deposition measured after Sirius red staining (F) shows the lower extent of collagen deposition detected in KO mice, compared to WT mice. The results are reported as mean ± SEM (Unpaired t test with Welch's correction). Levels of mRNA gene expression are reported as 2- ΔΔCT. (For interpretation of the references to color in this figure legend, the reader is referred to the Web version of this article.)
Figure 2
Figure 2
Dysregulation of fat distribution in mice with different expression of SerpinB3. A) Representative examples of subcutaneous or visceral white fat and of brown fat distribution are shown after skin removal in BALB/c mice lacking the Serpinb3a reactive site loop (KO) and in the corresponding BALB/c controls fed with normal diet. B) Values of relative adipose tissue in interscapular brown adipose tissue (BAT), subcutaneous adipose tissue (SAT) and in visceral adipose tissue (VAT), expressed as percentage of fat on total body weight (grams) in the WT and KO groups of mice. The results are reported as mean ± SEM (Unpaired t test with Welch's correction). C) Representative examples of subcutaneous or visceral white fat and of brown fat distribution in SerpinB3 transgenic (TG) mice and in the corresponding C57BL/6 controls fed with normal diet. D) Values of relative adipose tissue in interscapular brown adipose tissue (BAT), subcutaneous adipose tissue (SAT) and in visceral adipose tissue (VAT), expressed as percentage of fat on total body weight (grams) in the WT and TG groups of mice. The results are reported as mean ± SEM (Unpaired t test with Welch's correction). (For interpretation of the references to color in this figure legend, the reader is referred to the Web version of this article.)
Figure 3
Figure 3
Inhibitory activity of 1-Piperidin Propionic acid on inflammatory response in mice fed with CDAA diet. A) Representative examples of macrophage infiltration, detected by F4/80 immunostaining, in the liver of control mice (WT) and of SerpinB3 transgenic mice (TG) injected or not with 1-PPA. B) Densitometric analysis of F4/80 immunostaining in the liver of the corresponding groups of mice (7 animals/group). C) mRNA levels of inflammatory genes, including TNF-α and IL-1β, in control mice (WT) or in SerpinB3 transgenic mice (TG), fed or not with CDAA diet and injected or not with 1-PPA. D) mRNA levels of markers of NAMs, Galectin 3 (GAL3), CD9 and TREM2, in control mice (WT) or in SerpinB3 transgenic mice (TG), fed or not with CDAA diet and injected or not with 1-PPA. E) Representative results of SerpinB3 immunostaining in the liver of control mice (WT) and of SerpinB3 transgenic mice (TG) fed with CDAA and injected or not with 1-PPA. Cytoplasmic and or nuclear brown color refers to SerpinB3 immune reactivity. The results are reported as mean ± SEM (Unpaired t test with Welch's correction). mRNA levels are expressed as 2−ΔΔCT. (For interpretation of the references to color in this figure legend, the reader is referred to the Web version of this article.)
Figure 4
Figure 4
Inhibitory activity of 1-Piperidin Propionic acid on fibrosis in mice fed with CDAA diet. A) Representative examples of Sirius red staining in paraffin sections of mice livers in WT and in TG mice injected or not with 1-PPA. B) Densitometric analysis of collagen deposition measured after Sirius red staining in the liver of the corresponding groups of mice (7 animals/group). C) mRNA levels of fibrosis genes in the different groups of mice, including α-SMA, collagen 1A1 and TGF-β. The results are reported as mean ± SEM (Unpaired t test with Welch's correction). mRNA levels are expressed as 2- ΔΔCT. (For interpretation of the references to color in this figure legend, the reader is referred to the Web version of this article.)
Figure 5
Figure 5
Inhibitory effect of 1-Piperidin Propionic acid on fibrogenesis and inflammatory response in vitro. A) Profile of fibrosis genes (collagen 1A1, α-SMA, CCL-2 and VEGF-A) in LX2 cells in presence of SerpinB3 (SB3, 200 ng/ml) alone or mixed with 1-PPA at 100 ng/ml concentration (SB3 + 1-PPA) after 24 h incubation. B) Profile of inflammatory genes (TGF-β, CCL-15, TNF-α, IL-1β, IL-13, CCL-2) in THP1 cells exposed to human recombinant SerpinB3 (SB3, 100 ng/ml) alone or mixed with 1-PPA at 100 ng/ml concentration (SB3 + 1-PPA) after 24 h incubation. The results are reported as mean + SEM of at least three experiments (Unpaired t test with Welch's correction). mRNA levels are expressed as 2- ΔΔCT.
Figure 6
Figure 6
1-Piperidin Propionic acid reduces CEBP-β transcription. A) CEBP-β expression in HepG2 cells transfected with the plasmid vector alone (HepG2/CTR) and in HepG2 cells transfected to overexpress SerpinB3 (HepG2/SB3) in presence of increasing concentrations of 1-PPA or of Medium alone. B) CEBP-β expression profile in the THP-1 cell line. This transcription factor, not detectable in THP-1 cells, is markedly induced by SerpinB3 and the effect is efficiently reverted by the addition of 1-PPA. C) Example of Western blot of the isoforms Liver Activating Protein (LAP) and Liver Inhibitory Protein (LIP) of CEPB-β in control HepG2 (empty vector), in HepG2 cells overexpressing SerpinB3 wild type (SB3/WT) and in HepG2 cells overexpressing SerpinB3 lacking the antiprotease activity (SB3/Δ7). D) Densitometric analysis of protein expression of Liver Activating Protein (LAP) and of Liver Inhibitory Protein (LIP) of CEPB-β, normalized to GAPDH, in control HepG2 cells (Empty vector), in HepG2 cells overexpressing SerpinB3 wild type (SB3/WT) and in HepG2 cells lacking the antiprotease activity (SB3/Δ7). E) CEBP-β expression profile in C57BL6/J and BALB/c wild type mice (WT mice), SerpinB3 transgenic mice (SB3/TG) and mice deficient of the reactive site loop of Serpinb3a (SB3/KO).
Figure 7
Figure 7
C/EBP-β and PAR2 in relation to different extent of expression of SerpinB3. Immunofluorescence results for C/EBP-β (Α) and for PAR2 (B) in HepG2 cells transfected with the plasmid vector alone (HepG2/CTR), in HepG2 cells transfected to overexpress SerpinB3 (HepG2/SB3), in HepG2 cells transfected with a plasmid vector carrying the SerpinB3 sequence deleted of 7aa in the reactive site loop (HepG2/SB3Δ7) and in the HA22T/VGH cells constitutively expressing SerpinB3. C) Effect of C/EBP-β silencing on the expression of C/EBP-β and of SerpinB3 (D) in the HA22T/HGV cell line. E) Representative results of immunostaining for PAR2 the liver in a wild type mouse (TG) and in SerpinB3 transgenic mice (TG/SB3) fed with CDAA and injected or not with 1-PPA. F) Densitometric analysis of PAR2 immunostaining in the liver of the corresponding groups of mice.

References

    1. Pellicoro A., Ramachandran P., Iredale J.P., Fallowfield J.A. Liver fibrosis and repair: immune regulation of wound healing in a solid organ. Nat Rev Immunol. 2014;14:181–194. doi: 10.1038/nri3623. - DOI - PubMed
    1. Schuppan D. Liver fibrosis: common mechanisms and antifibrotic therapies. Clin Res Hepatol Gastroenterol. 2015;39(Suppl 1):S51–S59. doi: 10.1016/j.clinre.2015.05.005. - DOI - PubMed
    1. Parola M., Pinzani M. Liver fibrosis: pathophysiology, pathogenetic targets and clinical issues. Mol Aspect Med. 2019;65:37–55. doi: 10.1016/j.mam.2018.09.002. - DOI - PubMed
    1. Wen Y., Lambrecht J., Ju C., Tacke F. Hepatic macrophages in liver homeostasis and diseases -diversity, plasticity and therapeutic opportunities. Cell Mol Immunol. 2021;18:45–56. doi: 10.1038/s41423-020-00558-8. - DOI - PMC - PubMed
    1. Lee Y.A., Friedman S.L. Inflammatory and fibrotic mechanisms in NAFLD-Implications for new treatment strategies. J Intern Med. 2022;291:11–31. doi: 10.1111/joim.13380. - DOI - PMC - PubMed

Substances