. 2024 Mar 16:541:64-76.
doi: 10.1016/j.neuroscience.2024.01.024. Epub 2024 Feb 1.

Mineralocorticoid Receptor Antagonism Reduces Inflammatory Pain Measures in Mice Independent of the Receptors on Sensory Neurons

Affiliations

Mineralocorticoid Receptor Antagonism Reduces Inflammatory Pain Measures in Mice Independent of the Receptors on Sensory Neurons

Katherine A Qualls et al. Neuroscience. .

Abstract

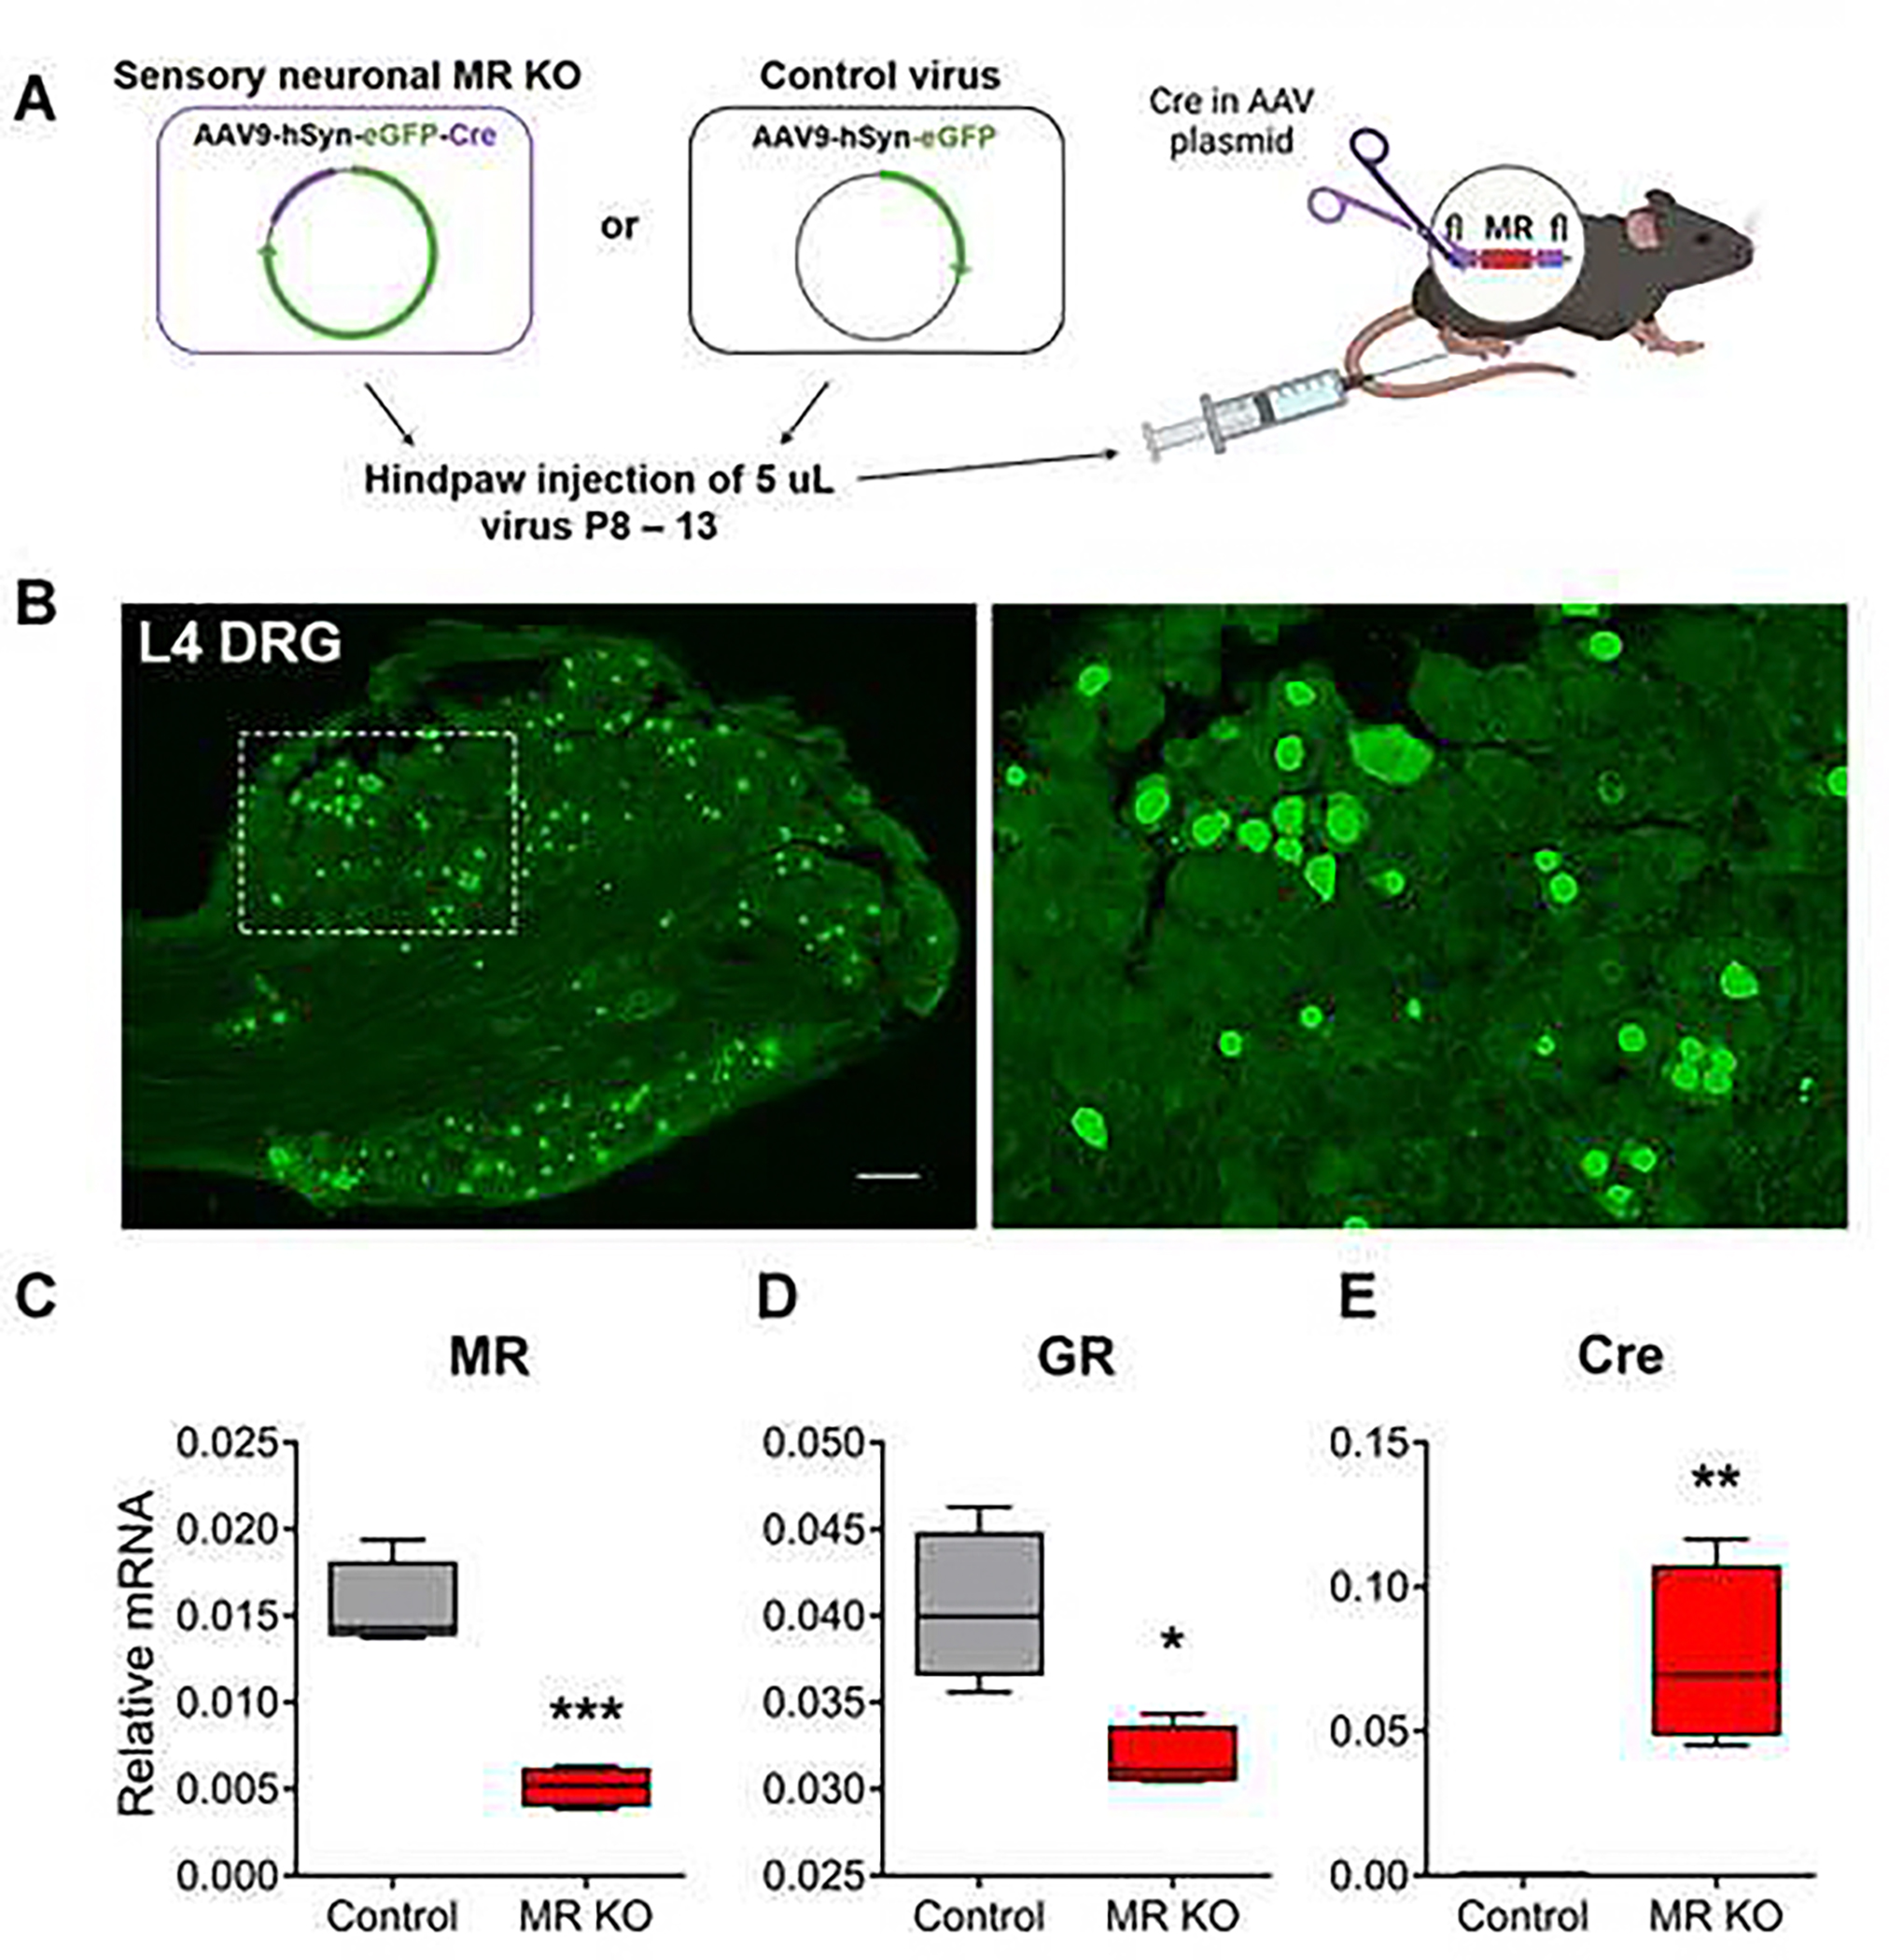
Corticosteroids are commonly used in the treatment of inflammatory low back pain, and their nominal target is the glucocorticoid receptor (GR) to relieve inflammation. They can also have similar potency at the mineralocorticoid receptor (MR). The MR has been shown to be widespread in rodent and human dorsal root ganglia (DRG) neurons and non-neuronal cells, and when MR antagonists are administered during a variety of inflammatory pain models in rats, pain measures are reduced. In this study we selectively knockout (KO) the MR in sensory neurons to determine the role of MR in sensory neurons of the mouse DRG in pain measures as MR antagonism during the local inflammation of the DRG (LID) pain model. We found that MR antagonism using eplerenone reduced evoked mechanical hypersensitivity during LID, but MR KO in paw-innervating sensory neurons only did not. This could be a result of differences between prolonged (MR KO) versus acute (drug) MR block or an indicator that non-neuronal cells in the DRG are driving the effect of MR antagonists. MR KO unmyelinated C neurons are more excitable under normal and inflamed conditions, while MR KO does not affect excitability of myelinated A cells. MR KO in sensory neurons causes a reduction in overall GR mRNA but is protective against reduction of the anti-inflammatory GRα isoform during LID. These effects of MR KO in sensory neurons expanded our understanding of MR's functional role in different neuronal subtypes (A and C neurons), and its interactions with the GR.

Keywords: dorsal root ganglia; glucocorticoid receptor; inflammation; mineralocorticoid receptor; radiculopathy.


Figures

Figure 1.
Figure 1.. MR antagonism, using eplerenone applied locally to the DRG, reduces mechanical hypersensitivity during LID in mice.
Graphs showing PODs −3 (baseline), 4, 7, 14, and 21 von Frey PWT data for the contralateral (A) and ipsilateral (B) sides of LID surgery for the group with eplerenone (LID + Epl) and without (LID). The contralateral side (A) showed no effect of LID or eplerenone (2-way RM ANOVA: Time P = 0.65., Drug P = 0.75, Time x Drug P = 0.83). The ipsilateral side (B) showed a reduction in PWT from LID in both groups, and significantly higher value on POD7 in the LID + Epl group compared to the LID group (2-way RM ANOVA: Time P < 0.0001, Drug P = 0.10, Time x Drug P = 0.0035; Šidák’s multiple comparisons posttest, POD7, LID vs. LID + Epl, P < 0.0001 ***). Additionally, when ipsilateral AUC (C) was calculated for von Frey testing (B) across all timepoints, the eplerenone group had a significantly higher log PWT (unpaired t-test, P = 0.04 *). Fifteen-minute videos documenting rearing behavior (D) and distance traveled (E) on baseline, POD3, and POD11 show a reduction in rearing and distance traveled as a result of LID on POD3, but no effect of eplerenone (2-way RM ANOVA: Rearing bouts; Time P = 0.014, Drug P = 0.30, Time x Drug P = 0.76. Distance traveled; Time P < 0.0001, Drug P = 0.83, Time x Drug = 0.07). LID n = 5 (3M, 2F), LID + Epl n = 6 (3M, 3F).
Figure 2.
Figure 2.. Selective sensory neuronal MR KO technique reduces MR mRNA > 60% in ipsilateral L4 DRG, but also reduces GR mRNA ~25%.
Schematic representation of viral MR KO technique (A) in which either AAV9-hSyn-eGFP-Cre or AAV9-hSyn-eGFP virus are injected in the right hindpaw during the second week of life in MR fl/fl mice. Representative L4 DRG section of a mouse that was injected with AAV9-hSyn-eGFP-Cre that was immunostained for GFP expression and inset (B). Graphs showing a reduction in total MR (C) and GR (D), and an increase in Cre relative mRNA in the L4 DRGs of the MR KO group in comparison to control mice (unpaired t-test, MR: P = 0.0004 ***, GR: P = 0.011 *, Cre: P = 0.003 **). RT-qPCR Control n = 4 (2M, 2F), MR KO n = 4 (2M, 2F). Scale bar = 100μm.
Figure 3.
Figure 3.. Selective MR KO in sensory neurons has no effect on evoked or spontaneous pain measures before and during LID.
Rotarod testing for motor coordination at baseline showed no difference between WT, control, and MR KO groups (A) (1-way ANOVA, P = 0.60). Graphs showing PODs −3 (baseline), 4, 7, 14, and 21 von Frey log PWT data for the contralateral (B) and ipsilateral (C) sides of LID surgery for control and MR KO groups. There was no effect of LID or MR KO on the contralateral side (2-way RM ANOVA: Time P = 0.17, Genotype P = 0.43, Time x Genotype P = 0.99). On the ipsilateral side to surgery, there was an effect of LID, but no effect of MR KO (2-way RM ANOVA: Time P < 0.0001, Genotype P = 0.32, Time x Genotype P = 0.45; Šidák’s multiple comparisons, control and MR KO baselines versus POD4, 7, and 14, P < 0.0001). Rearing behavior (D) and distance traveled (E) on baseline, POD3, and POD11 show a reduction in rearing and distance traveled as a result of LID on POD3, but no effect of MR KO (2-way RM ANOVA: Rearing bouts; Time P < 0.0001, Genotype P = 0.53, Time x Genotype P = 0.77. Distance traveled; Time P = 0.0001, Genotype P = 0.54, Time x Genotype = 0.22). WT n = 12 (6M, 6F), control n = 16 (8M, 8F), MR KO n = 16 (8M, 8F).
Figure 4.
Figure 4.. In vivo DRG calcium imaging shows that MR KO during LID increases sensitivity to maximal response.
Representation of in vivo calcium imaging setup during von Frey filament application with a recording still of a L4 DRG to demonstrate viral injection scheme with the GCaMP6s calcium indicator (green), and control or MR KO virus (red), in which double-labeled neurons (orange) indicate MR KO or control neurons that are active (A). Graphical representation of the number of evoked neuronal response to increasing force of von Frey stimuli in control or MR KO (GCaMP6s + Virus) neurons for normal and LID POD4 groups. (B). Linear regressions of log (von Frey filament force) versus evoked number of neurons (C) in each group (Control Normal: R2 = 0.41, P = 0.0018, Control LID POD4: R2 = 0.24, P = 0.0086, MR KO Normal: R2 = 0.38, P = 0.0004, MR KO LID POD4: R2 = 0.081, P = 0.15). P values for linear regressions indicate significance of the deviation of the slope from zero. Linear regression (c) slopes (2-way ANOVA: Injury P = 0.067, Genotype P = 0.19, Injury x Genotype P = 0.66) and y-intercepts (2-way ANOVA: Injury P = 0.28, Genotype P = 0.35, Injury x Genotype P =0.95) were not significantly different between groups. Control Normal n = 3 (2M, 1F), Control LID POD4 n = 4 (3M, 1F), MR KO Normal n = 4 (1M, 3F), MR KO LID POD4 n = 4 (1M, 3F). Scale bar = 250 μm.
Figure 5.
Figure 5.. C cells with MR KO are more excitable than controls before and during LID.
Acutely isolated right L4 DRGs were used for intracellular sharp electrode recording in current clamp mode. C cells (> 1.5 ms AP width) that were either MR KO or control were recorded for AP parameters, including percent firing multiple AP (A) (E), maximum number of AP evoked (B) (F), rheobase (C) (G), and resting potential (D) (H). In normal DRG, MR KO C cells have a higher percentage firing multiple AP (A) (Fisher’s exact test: P = 0.035 *) and a higher number of AP evoked from a suprathreshold stimulus (B) (Mann-Whitney test: P = 0.033 *), but no significant changes to rheobase (C) or resting potential (D). There were no differences between MR KO and control C cells on POD4 of LID for the percentage of cells firing multiple AP (E) and the number of AP evoked at a suprathreshold stimulus (F); however, MR KO C cells had a lower rheobase (G) (unpaired t-test: P = 0.03 *) and higher resting potential (H) (unpaired t-test: 0.0019 **). Normal n =55 cells from 4 mice (2M, 2F) LID n 53 cells from 4 mice (3M, 1F); also see Supplemental Table 1.
Figure 6.
Figure 6.. MR KO does not change neuronal excitability in A cells.
Acutely isolated right L4 DRGs were used for intracellular sharp electrode recording in current clamp mode. A cells (< 1.5 ms AP width) that were either MR KO or control were recorded for AP parameters, including percent firing multiple AP (A) (E), maximum number of AP evoked (B) (F), rheobase (C) (G), and resting potential (D) (H). In normal DRG, there are no differences in AP parameters between MR KO and control A cells (A-D). Similarly, there were no effects of MR KO on any of the parameters after LID (E-H). Normal n = 110 cells; LID n = 112 cells, same animals as Figure 5. See also Supplemental Table 1.
Figure 7.
Figure 7.. MR mRNA levels are reduced in control mice on LID POD4 and MR KO is protective for change in the GRα isoform.
RT-qPCR data from right L4 DRGs under normal and LID POD4 conditions for control and MR KO mice. MR mRNA levels were reduced in controls on POD4 of LID, and MR KO mice had low MR mRNA levels at both timepoints (A) (2-way ANOVA: Time P = 0.0006, Genotype P < 0.0001, Time x Genotype P = 0.0045; Šidák’s multiple comparisons posttest, control normal vs. control LID POD4 P = 0.0003 ***, control normal vs. MR KO normal and LID POD4 P < 0.0001 ****). GRα isoform mRNA was reduced in controls on LID POD4, but unchanged in MR KO mice (B) (2-way ANOVA: Time P = 0.053, Genotype P = 0.0065, Time x Genotype P = 0.028; Šidák’s multiple comparisons posttest, control normal vs. control LID POD4 P = 0.020 *). GRβ isoform mRNA was unchanged for both groups across timepoints (C) (2-way ANOVA: Time P = 0.41, Genotype P = 0.76, Time x Genotype P = 0.90). Normal and LID POD4: control n = 4 (2M, 2F), MR KO n = 4 (2M, 2F).

References

    1. Avraham O, Feng R, Ewan EE, Rustenhoven J, Zhao G, Cavalli V (2021), Profiling sensory neuron microenvironment after peripheral and central axon injury reveals key pathways for neural repair. Elife 0:e68457. - PMC - PubMed
    1. Berger S, Wolfer DP, Selbach O, Alter H, Erdmann G, Reichardt HM, Chepkova AN, Welzl H, et al. (2006), Loss of the limbic mineralocorticoid receptor impairs behavioral plasticity. Proc Natl Acad Sci U S A 103:195–200. - PMC - PubMed
    1. Bienvenu LA, Morgan J, Rickard AJ, Tesch GH, Cranston GA, Fletcher EK, Delbridge LM, Young MJ (2012), Macrophage mineralocorticoid receptor signaling plays a key role in aldosterone-independent cardiac fibrosis. Endocrinology 153:3416–3425. - PubMed
    1. Carassiti M, Pascarella G, Strumia A, Russo F, Papalia GF, Cataldo R, Gargano F, Costa F, et al. (2021), Epidural Steroid Injections for Low Back Pain: A Narrative Review. Int J Environ Res Public Health 19:231. - PMC - PubMed
    1. Chaplan SR, Bach FW, Pogrel JW, Chung JM, Yaksh TL (1994), Quantitative assessment of tactile allodynia in the rat paw. J Neurosci Methods 53:55–63. - PubMed

Substances

LinkOut - more resources