. 2024 Mar 15:177:278-299.
doi: 10.1016/j.actbio.2024.01.040. Epub 2024 Feb 1.

Mechanical, structural, and physiologic differences between above and below-knee human arteries

Affiliations

Mechanical, structural, and physiologic differences between above and below-knee human arteries

Pauline Struczewska et al. Acta Biomater. .

Abstract

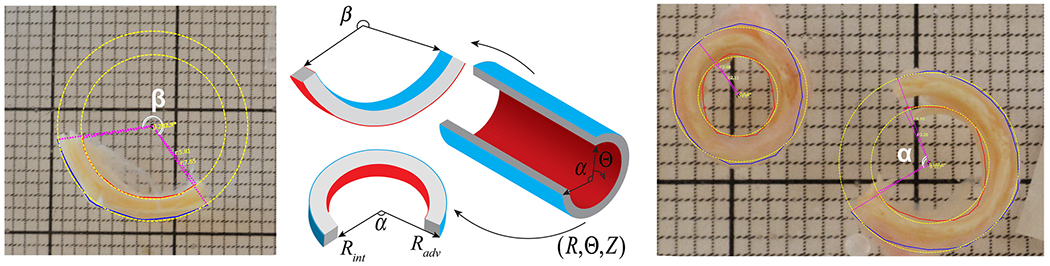
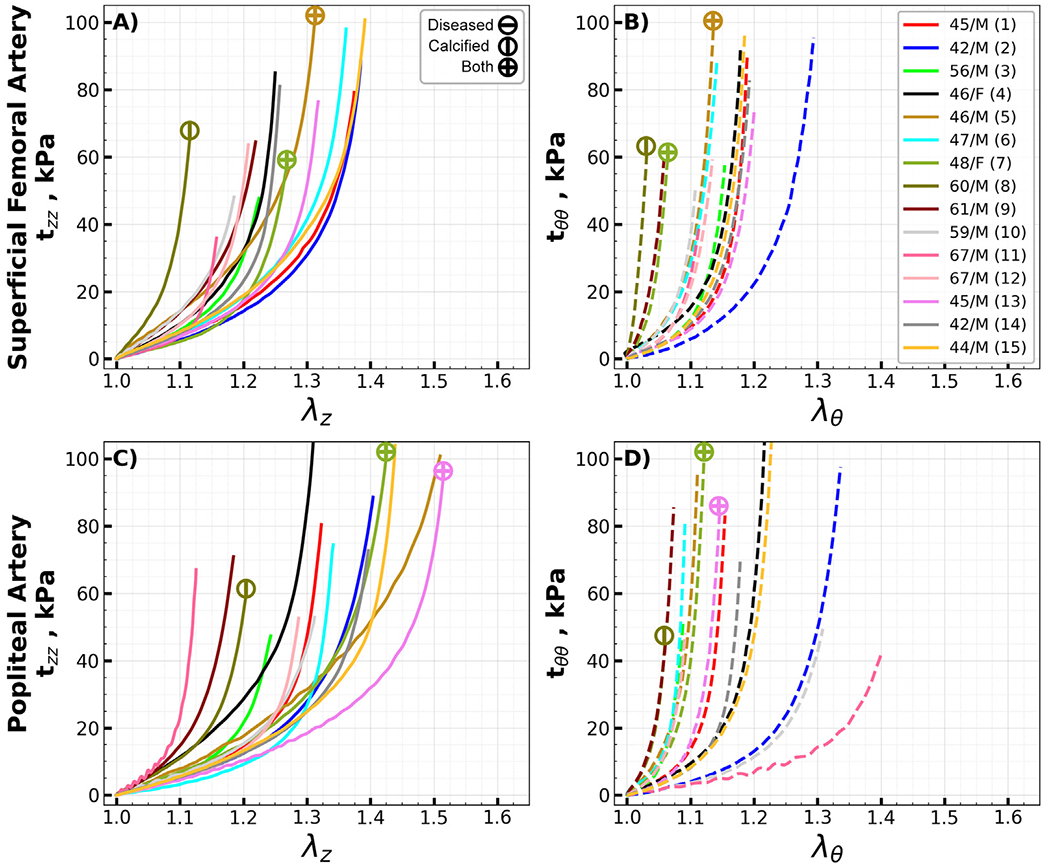
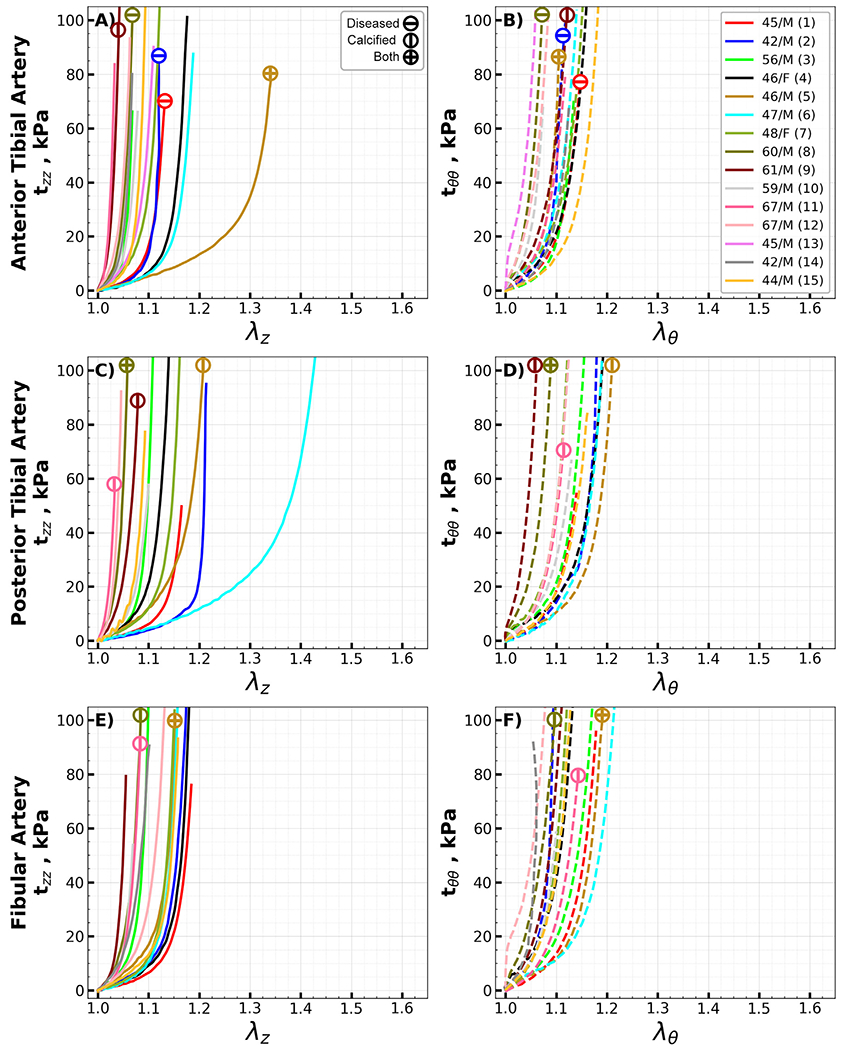
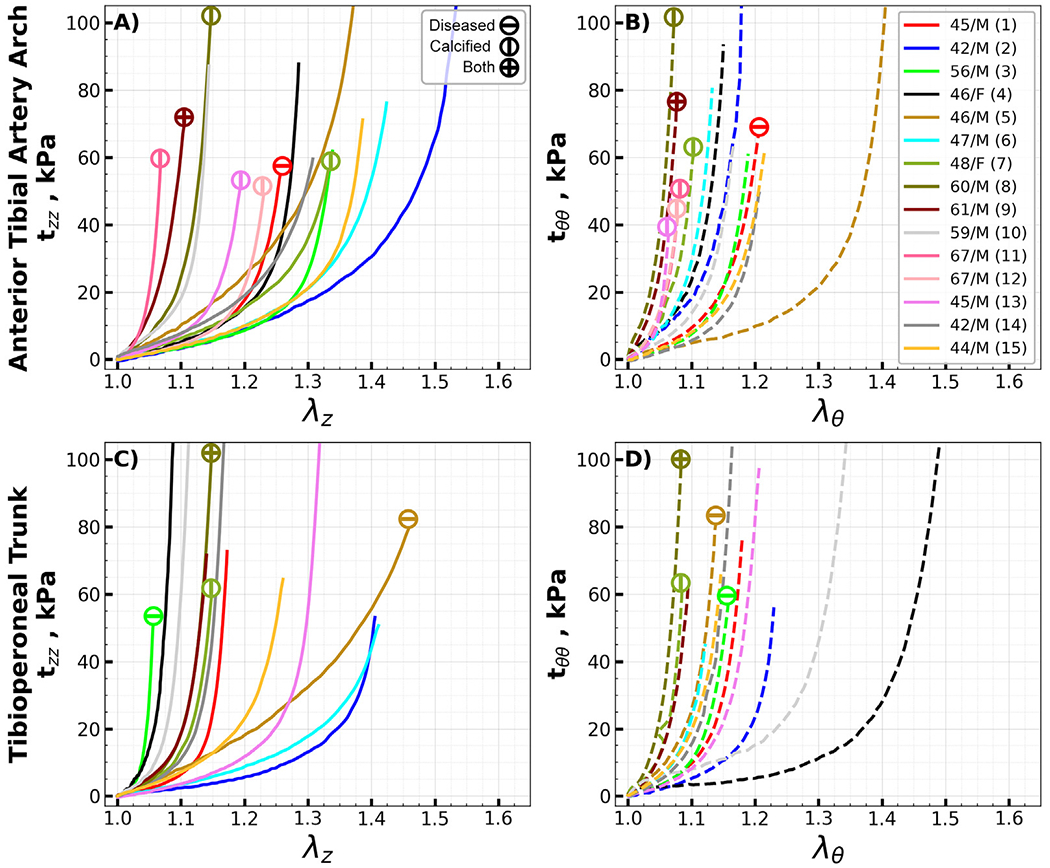
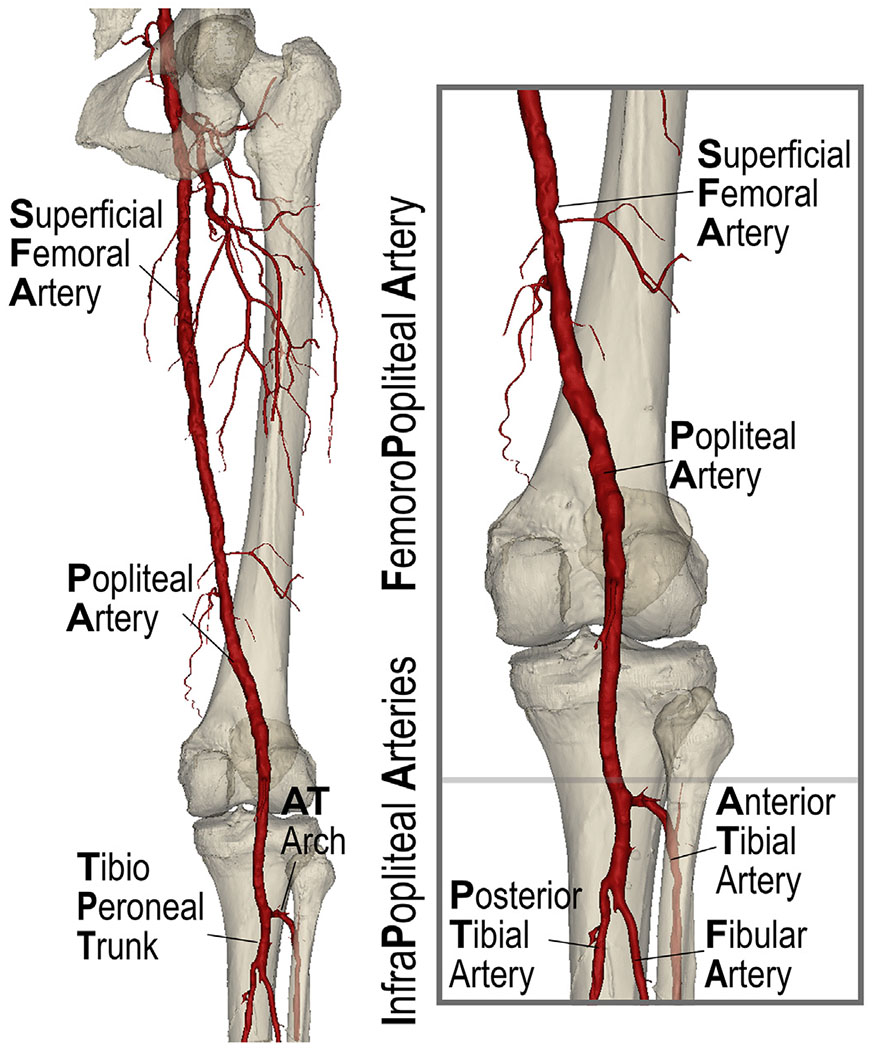
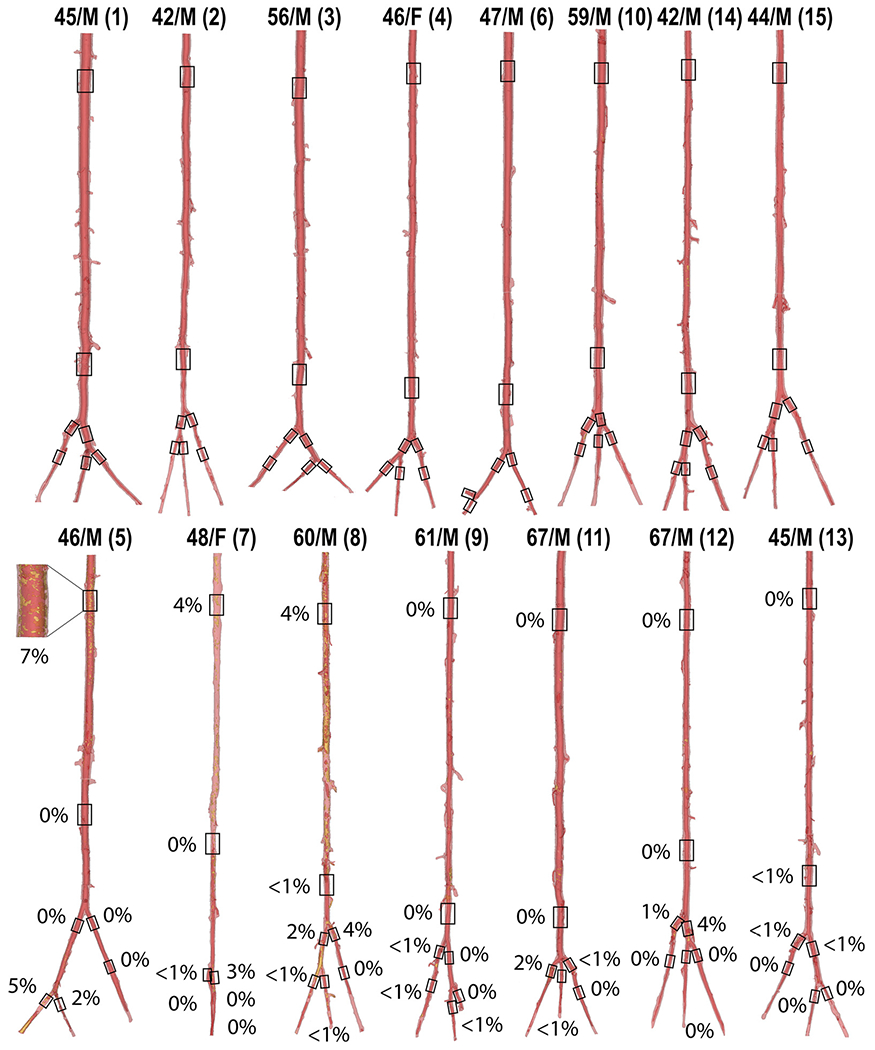
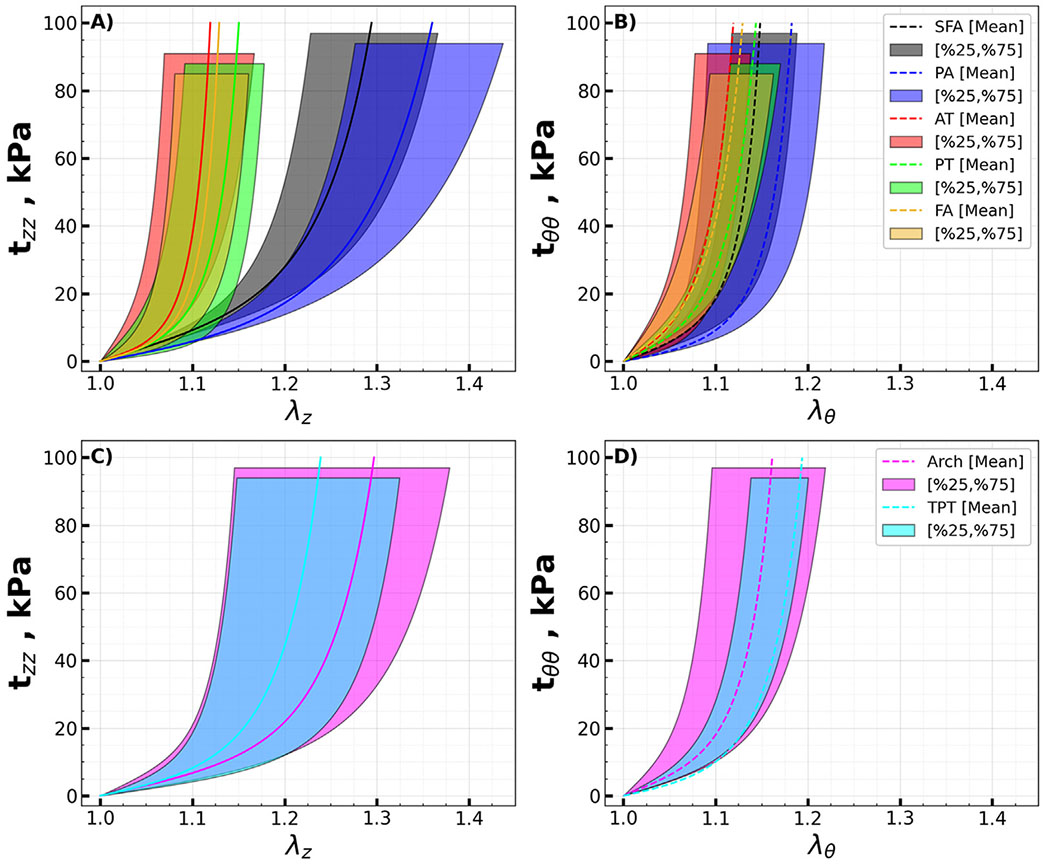
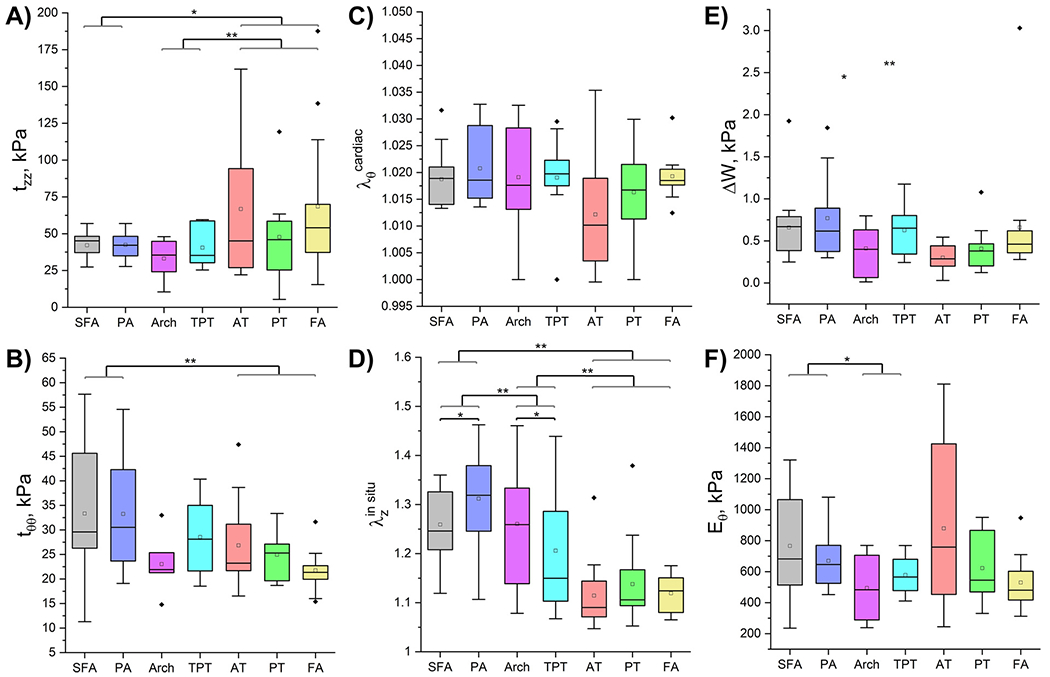
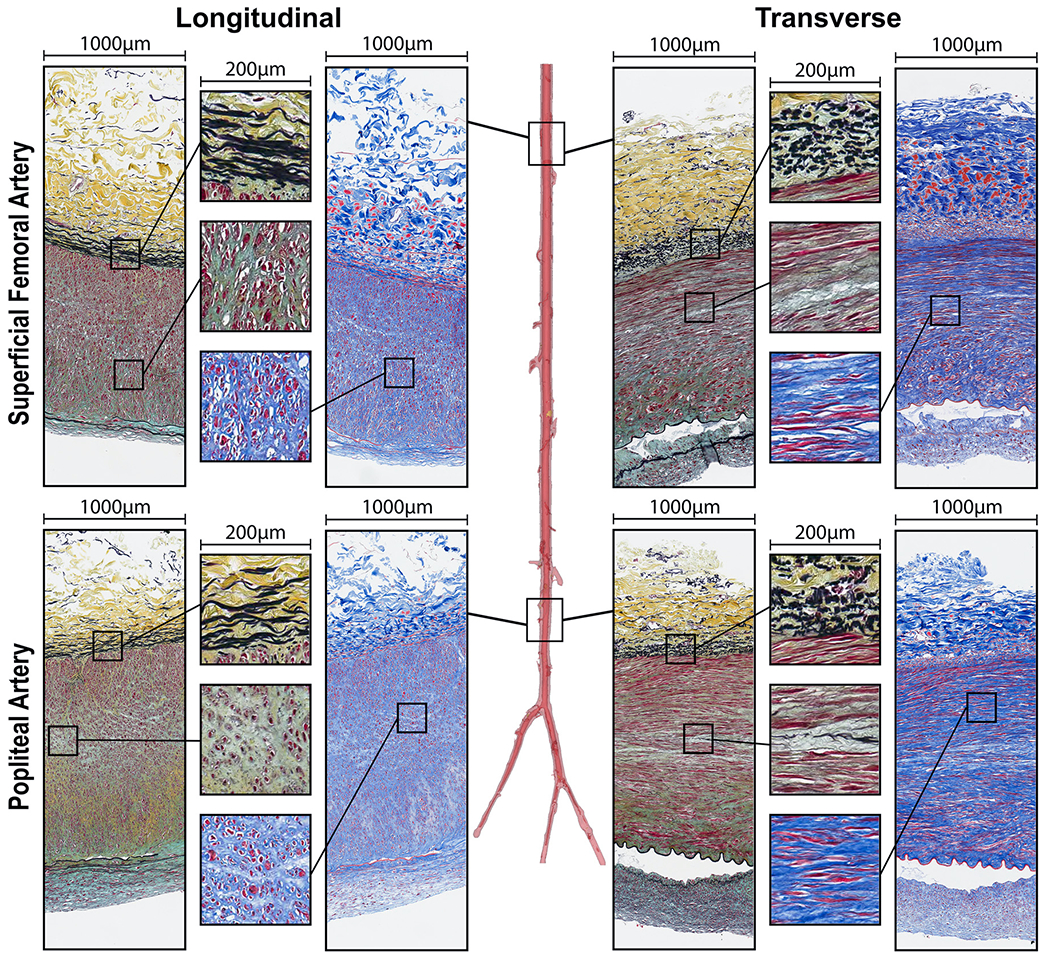
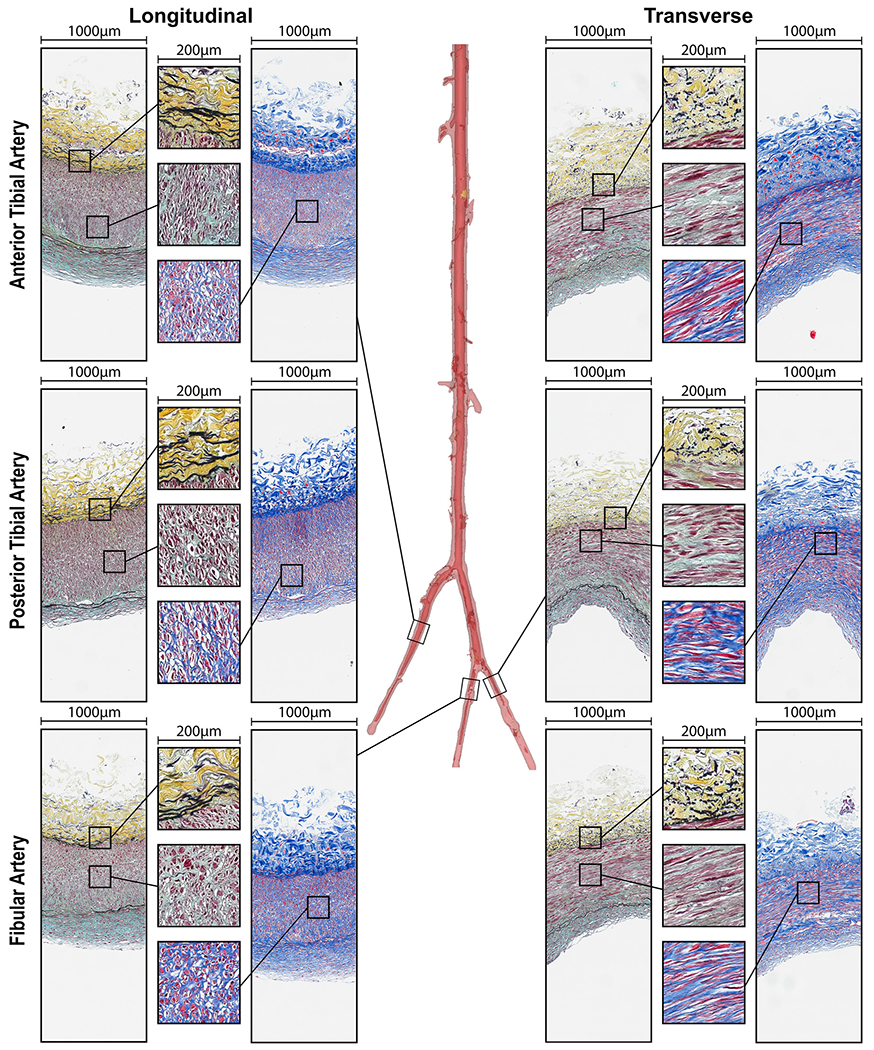
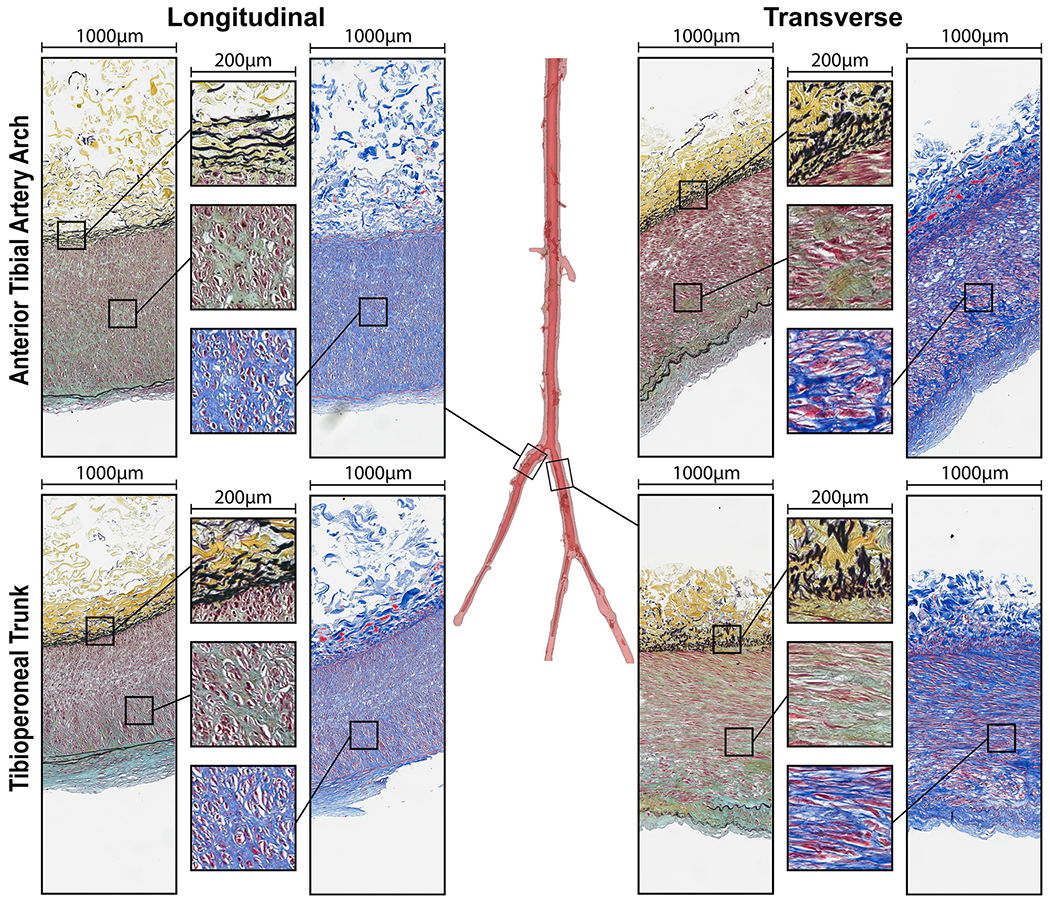
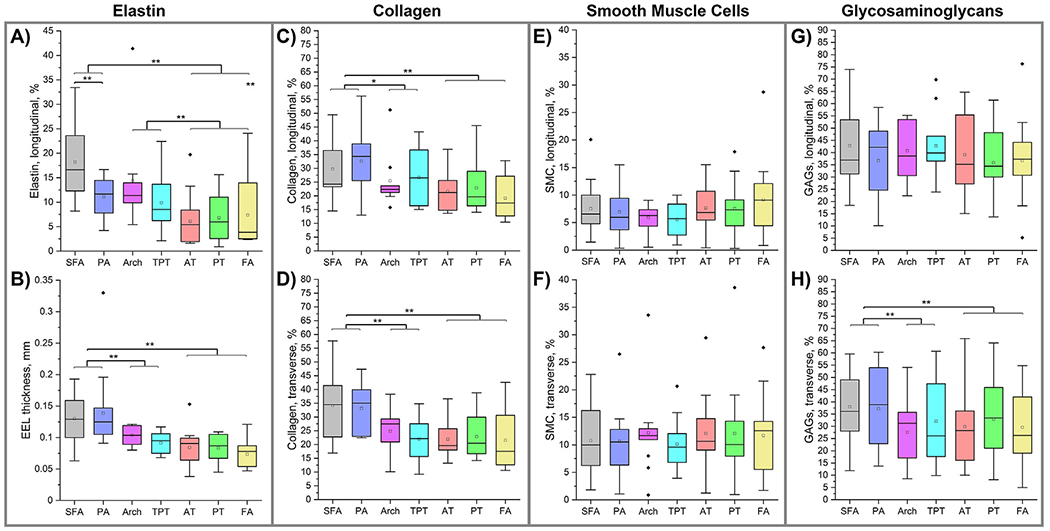
Peripheral Artery Disease (PAD) affects the lower extremities and frequently results in poor clinical outcomes, especially in the vessels below the knee. Understanding the biomechanical and structural characteristics of these arteries is important for improving treatment efficacy, but mechanical and structural data on tibial vessels remain limited. We compared the superficial femoral (SFA) and popliteal (PA) arteries that comprise the above-knee femoropopliteal (FPA) segment to the infrapopliteal (IPA) anterior tibial (AT), posterior tibial (PT), and fibular (FA) arteries from the same 15 human subjects (average age 52, range 42-67 years, 87 % male). Vessels were imaged using μCT, evaluated with biaxial mechanical testing and constitutive modeling, and assessed for elastin, collagen, smooth muscle cells (SMCs), and glycosaminoglycans (GAGs). IPAs were more often diseased or calcified compared to the FPAs. They were also twice smaller, 53 % thinner, and significantly stiffer than the FPA longitudinally, but not circumferentially. IPAs experienced 48 % higher physiologic longitudinal stresses (62 kPa) but 27 % lower circumferential stresses (24 kPa) and similar cardiac cycle stretch of <1.02 compared to the FPA. IPAs had lower longitudinal pre-stretch (1.12) than the FPAs (1.29), but there were no differences in the stored elastic energy during pulsation. The physiologic circumferential stiffness was similar in the above and below-knee arteries (718 kPa vs 754 kPa). Structurally, IPAs had less elastin, collagen, and GAGs than the FPA, but maintained similar SMC content. Our findings contribute to a better understanding of segment-specific human lower extremity artery biomechanics and may inform the development of better medical devices for PAD treatment. STATEMENT OF SIGNIFICANCE: Peripheral Artery Disease (PAD) in the lower extremity arteries exhibits distinct characteristics and results in different clinical outcomes when treating arteries above and below the knee. However, their mechanical, structural, and physiologic differences are poorly understood. Our study compared above- and below-knee arteries from the same middle-aged human subjects and demonstrated distinct differences in size, structure, and mechanical properties, leading to variations in their physiological behavior. These insights could pave the way for creating location-specific medical devices and treatments for PAD, offering a more effective approach to its management. Our findings provide new, important perspectives for clinicians, researchers, and medical device developers interested in treating PAD in both above- and below-knee locations.

Keywords: Femoropopliteal artery; Infrapopliteal arteries; Mechanical properties; Structural characteristics; Tibial arteries.


Conflict of interest statement

Declaration of competing interest The authors declare that they have no known competing financial interests or personal relationships that could have appeared to influence the work reported in this paper.

Figures

Fig. 9.
Fig. 9.
Morphometric measurements of the opening angle were conducted using custom-written software, which employs a least squares algorithm to fit a circle to the segmented outer and inner edges of the cut ring and axial strip of the arterial section. The circle’s center is then utilized to quantify the angle between the two edges of the sector. In this figure, yellow dashed lines indicate the best-fit circle, pink dots signify the circle’s radius, and white curves depict the opening angle (α – circumferential, β – longitudinal). (For interpretation of the references to color in this figure legend, the reader is referred to the web version of this article.)
Fig. 10.
Fig. 10.
Equibiaxial Cauchy stress-stretch curves for all evaluated superficial femoral (SFA, A, B) and popliteal (PA, C, D) arteries in the longitudinal (z) and circumferential (θ) directions. Different colors represent different subjects. Arteries with atherosclerotic disease (disease stage greater than III) and calcified arteries (calcium volume greater than zero) are marked with circles containing horizontal and vertical lines, while circles with a cross represent arteries with both atherosclerosis and calcification. The age and sex of each subject are provided in the legend. (For interpretation of the references to color in this figure legend, the reader is referred to the web version of this article.)
Fig. 11.
Fig. 11.
Equibiaxial Cauchy stress-stretch curves for all evaluated anterior tibial (AT, A, B), posterior tibial (PT, C, D), and fibular (FA, E, F) arteries in the longitudinal (z) and circumferential (θ) directions. Different colors represent different subjects. Arteries with atherosclerotic disease (disease stage greater than III) and calcified arteries (calcium volume greater than zero) are marked with circles containing horizontal and vertical lines, while circles with a cross represent arteries with both atherosclerosis and calcification. The age and sex of each subject are provided in the legend. (For interpretation of the references to color in this figure legend, the reader is referred to the web version of this article.)
Fig. 12.
Fig. 12.
Equibiaxial Cauchy stress-stretch curves for the evaluated transition segments of the anterior tibial arch (A, B) and the tibioperoneal trunk (C, D) in the longitudinal (z) and circumferential (θ) directions. Different colors represent different subjects. Arteries with atherosclerotic disease (disease stage greater than III) and calcified arteries (calcium volume greater than zero) are marked with circles containing horizontal and vertical lines, while circles with a cross represent arteries with both atherosclerosis and calcification. The age and sex of each subject are provided in the legend. (For interpretation of the references to color in this figure legend, the reader is referred to the web version of this article.)
Fig. 1.
Fig. 1.
Arteries of the lower extremity include the superficial femoral (SFA) and the popliteal arteries (PA) that comprise the femoropopliteal (FPA) segment and the anterior tibial (AT), posterior tibial (PT), and fibular (peroneal) arteries (FA) that form the below-knee infrapopliteal (IPA) segment. The AT curves and develops an arch as it passes through the superior aspect of the interosseus membrane. Distal to the AT take-off, the PA continues as the tibioperoneal trunk (TPT) prior to bifurcating into the PT and FA.
Fig. 2.
Fig. 2.
3D μCT reconstructions of all evaluated arteries. The top row represents vessels without calcification, while the bottom row depicts calcified arteries. The percentages indicate the amount of calcium present in each evaluated arterial segment, marked with a black box. The age and sex of each specimen are indicated at the top. Specimen numbers are in parentheses.
Fig. 3.
Fig. 3.
Mean equibiaxial Cauchy stress (kPa) - stretch curves for the A) above (SFA, PA) and B) below-knee (AT, PT, FA) arteries in longitudinal (solid lines, z) and circumferential (dashed lines, θ) directions. Transition zones (AT arch and TPT) are presented in panels C) and D). Variability is demonstrated by the shaded semi-transparent regions that bound 25th and 75th percentile ranges. They have different heights for better visualization.
Fig. 4.
Fig. 4.
Calculated physiologic characteristics for all arterial segments demonstrating A) longitudinal and B) circumferential physiologic Cauchy stresses (kPa) at 100 mmHg pressure, C) circumferential cardiac cycle stretch as the artery deforms from diastole (80 mmHg) to systole (120 mmHg), D) in situ longitudinal pre-stretch, E) changes in stored elastic energy (kPa) over the cardiac cycle, and F) circumferential stiffness (kPa) defined as the change in circumferential physiologic stress divided by the change in the corresponding stretch during the cardiac cycle. Statistically significant differences between groups at p < 0.05 are marked with a single asterisk and at p < 0.01 with a double asterisk. The boxes bound 25th and 75th percentiles, mean values are marked with a hollow square, median is represented by a horizontal line within each box, and outliers are marked with a solid black rhombus. Whiskers extend to the outmost data point that falls within upper inner and lower inner fence defined by 75th percentile + 1.5x interquartile range and 25th percentile − 1.5x interquartile range, respectively.
Fig. 5.
Fig. 5.
Structure of the superficial femoral (SFA) and popliteal (PA) arteries in longitudinal (left) and transverse (right) directions evaluated using Movat (elastin is black, glycosaminoglycans are greenish-gray) and Masson’s Trichrome (collagen is blue, smooth muscle is red) stains. Note directional differences in elastin (longitudinal fibers) and SMCs (mostly circumferential) demonstrated by the inserts. Compare the structure of these above-knee arteries to the arteries below the knee from the same subject (Fig. 6).
Fig. 6.
Fig. 6.
Structure of the anterior tibial (AT), posterior tibial (PT), and fibular (FA) arteries in longitudinal (left) and transverse (right) directions evaluated using Movat (elastin is black, glycosaminoglycans are greenish-gray) and Masson’s Trichrome (collagen is blue, smooth muscle is red) stains. Note directional differences in elastin (longitudinal fibers) and medial SMCs (mostly circumferential) demonstrated by the inserts. Compare the structure of these below-knee arteries to the arteries above the knee from the same subject (Fig. 5).
Fig. 7.
Fig. 7.
Structure of the transition zones: anterior tibial artery arch and the tibioperoneal trunk in longitudinal (left) and transverse (right) directions evaluated using Movat (elastin is black, glycosaminoglycans are greenish-gray) and Masson’s Trichrome (collagen is blue, smooth muscle is red) stains. Note directional differences in elastin (longitudinal fibers) and medial SMCs (mostly circumferential) demonstrated by the inserts. Compare the structure of these transition zones to the arteries above (Fig. 5) and below (Fig. 6) the knee from the same subject.
Fig. 8.
Fig. 8.
Structural composition of the above and below-knee arteries demonstrating the density of elastin in the EEL (A), thickness of the EEL (B), collagen content (C,D), smooth muscle cell (E,F), and glycosaminoglycan (G, H) content in the tunica media measured using longitudinal (top row) and circumferential (bottom row) sections. Statistically significant differences between groups at p < 0.05 are marked with a single asterisk and at p < 0.01 with a double asterisk. The boxes bound 25th and 75th percentiles, mean values are marked with a hollow square, median is represented by a horizontal line within each box, and outliers are marked with a solid black rhombus. Whiskers extend to the outmost data point that falls within upper inner and lower inner fence defined by 75th percentile + 1.5x interquartile range and 25th percentile − 1.5x interquartile range, respectively.

References

    1. Mahoney EM, Wang K, Keo HH, Duval S, Smolderen KG, Cohen DJ, Steg G, Bhatt DL, Hirsch AT, Vascular hospitalization rates and costs in patients with peripheral artery disease in the United States, Circ. Cardiovasc. Qual. Outcomes 3 (2010) 642–651, doi:10.1161/CIRCOUTCOMES.109.930735. - DOI - PubMed
    1. Watt JKJ, Origin of femoro-popliteal occlusions, Br. Med. J 2 (1965) 1455–1459, doi:10.1136/bmj.2.5476.1455. - DOI - PMC - PubMed
    1. Narula N, Dannenberg AJ, Olin JW, Bhatt DL, Johnson KW, Nadkarni G, Min J, Torii S, Poojary P, Anand SS, Bax JJ, Yusuf S, Virmani R, Narula J, Pathology of peripheral artery disease in patients with critical limb ischemia, J. Am. Coll. Cardiol 72 (2018) 2152–2163, doi:10.1016/j.jacc.2018.08.002. - DOI - PubMed
    1. Mahoney EM, Wang K, Cohen DJ, Hirsch AT, Alberts MJ, Eagle K, Mosse F, Jackson JD, Steg PG, Bhatt DL, One-year costs in patients with a history of or at risk for atherothrombosis in the United States, Circ. Cardiovasc. Qual. Outcomes 1 (2008) 38–45, doi:10.1161/CIRCOUTCOMES.108.775247. - DOI - PubMed
    1. Scully RE, Arnaoutakis DJ, DeBord Smith A, Semel M, Nguyen LL, Estimated annual health care expenditures in individuals with peripheral arterial disease, J. Vasc. Surg 67 (2018) 558–567, doi:10.1016/J.JVS.2017.06.102. - DOI - PubMed

Publication types