. 2024 Feb 2;7(4):e202302276.
doi: 10.26508/lsa.202302276. Print 2024 Apr.

Targeting circulating labile heme as a defense strategy against malaria

Affiliations

Targeting circulating labile heme as a defense strategy against malaria

Susana Ramos et al. Life Sci Alliance. .

Abstract

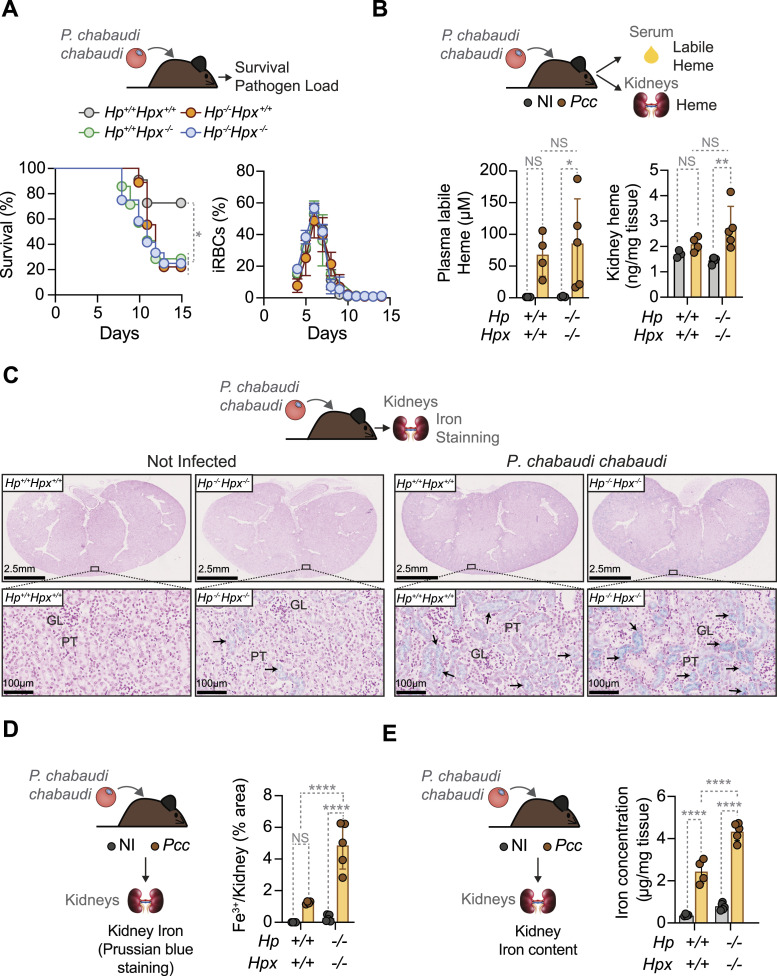
Severe presentations of malaria emerge as Plasmodium (P.) spp. parasites invade and lyse red blood cells (RBC), producing extracellular hemoglobin (HB), from which labile heme is released. Here, we tested whether scavenging of extracellular HB and/or labile heme, by haptoglobin (HP) and/or hemopexin (HPX), respectively, counter the pathogenesis of severe presentations of malaria. We found that circulating labile heme is an independent risk factor for cerebral and non-cerebral presentations of severe P. falciparum malaria in children. Labile heme was negatively correlated with circulating HP and HPX, which were, however, not risk factors for severe P. falciparum malaria. Genetic Hp and/or Hpx deletion in mice led to labile heme accumulation in plasma and kidneys, upon Plasmodium infection This was associated with higher incidence of mortality and acute kidney injury (AKI) in ageing but not adult Plasmodium-infected mice, and was corroborated by an inverse correlation between heme and HPX with serological markers of AKI in P. falciparum malaria. In conclusion, HP and HPX act in an age-dependent manner to prevent the pathogenesis of severe presentation of malaria in mice and presumably in humans.


Conflict of interest statement

The authors declare that they have no conflict of interest.

Figures

Figure 1.
Figure 1.. Heme accumulation in serum correlates with P. falciparum malaria severity.
(A, B) Representative UV–visible spectra of plasma from P. falciparum-infected individuals with uncomplicated malaria or developing CM, highlighting (A) Soret region (λ363–383 nm) corresponding to labile heme, with a peak at λ405 nm and (B) λ582 nm region corresponding to HB-bound heme. (C) Labile heme, haptoglobin (HP), hemopexin (HPX) concentrations in serum from P. falciparum-infected individuals stratified according to disease severity: Uncomplicated malaria (N = 25), cerebral malaria (CM; N = 58) or severe non-cerebral malaria (N = 61). Circles represent individuals and red lines indicate median values. P-values determined using a one-way ANOVA test and subsequent posthoc tests. NS, nonsignificant; *P < 0.05; ****P < 0.0001. (C, D) Contribution of each of the parameters to distinguish the indicated sub-groups (stratified as in (C)), controlling for age and sex. Values indicate regression coefficients of the standardized variable on a logit regression. Raw data in Table 1. (E) Correlation coefficients between log-transformed haptoglobin (HP; left panel) or hemopexin (HPX; right panel) versus labile heme concentration in serum of P. falciparum-infected individuals, stratified as in (C). Circles represent individual patients. P-values determined using a Spearman’s rank correlation coefficient test. Spearman’s correlation coefficients (r) are highlighted. Source data are available for this figure.
Figure 2.
Figure 2.. HP and HPX regulate serum labile heme accumulation during malaria.
Mice were infected with Pcc (2 × 10⁶ iRBC) and serum was collected at the peak of parasitemia (day 6–7 post infection). (A, B) Relative expression of hepatic haptoglobin (Hp) and hemopexin (Hpx) mRNA in C57BL/6 mice, not infected (NI) or infected with Pcc, determined by (A) bulk RNAseq (N = 4 per genotype) from a previously published dataset (Ramos et al, 2022) or by (B) qRT–PCR from whole liver, normalized to Arbp0 mRNA (N = 7 per genotype). (C, D, E, F) Serum concentrations of (C) haptoglobin (HP) and (D) hemopexin (HPX), (E) total heme (Left panel) and labile heme (Right panel), (F) Iron (Left panel) and transferrin saturation (Right panel), in Pcc-infected (1 × 10⁵ iRBC, at the peak of parasitemia: days 8–9 post-infection) and non-infected control mice (N = 10–12 per indicated genotype). Data represented as mean ± SD from one or two independent experiments with similar trend. Dots correspond to individual mice. P-values determined by two-way ANOVA. NS, non-significant; *P < 0.05; **P < 0.01; ***P < 0.001; ****P < 0.0001. Source data are available for this figure.
Figure 3.
Figure 3.. HP and HPX are not required to prevent malaria acute kidney injury in adult mice.
Adult 8–12 wk-old mice from the indicated genotypes were infected with Pcc and serum was collected, at the peak of parasitemia. (A) Renal heme (Left panel) and iron (Right panel) concentrations. Mice were infected with 2 × 10⁶ iRBC and collected 7 d post infection. Data represented as mean ± SD from two independent experiments with a similar trend (N = 4–5 per genotype). Dots correspond to individual mice. (B) Blood urea nitrogen (left panel) and creatinine (right panel) concentrations in serum. Mice were infected with 1 × 10⁵ iRBC and collected 8–9 d post infection. Data represented as mean ± SD from two independent experiments. with similar trend (N = 7–12 per genotype). Dots correspond to individual mice. (C) Kidney H&E staining, representative of N = 4 mice per genotype, corresponding to Pcc-infected (1 × 10⁵ iRBC, at the peak of parasitemia: days 8–9 post-infection) and noninfected control mice. Top panels show whole kidney sections and bottom panels higher magnifications of the highlighted area. Arrowheads indicate renal proximal tubule epithelial single cell necrosis. GL, glomerulus; PT, proximal tubules. (C, D) Histopathological evaluation of the kidneys from (C) performed using digitalized whole-slide images, corresponding to whole kidney sections. Scores are represented as mean ± SD (n = 4–5 mice per genotype). Dots correspond to individual mice. Scores: 0 = No lesions; 1 = Single cell necrosis, discrete hemoglobin tubular casts; 2 = Mild; 3 = Moderate; 4 = Severe tubular cell necrosis, hemoglobin tubular casts. (E) Survival (left panel) and parasitemia (right panel) of Pcc-infected (1 × 10⁵ iRBC) Hp+/+Hpx+/+, Hp−/−Hpx+/+, Hp+/+Hpx−/− and Hp−/−Hpx−/− mice (N = 7–11 mice per genotype), from two independent experiments with similar trend. Survival is represented in Kaplan–Meier plots and parasitemia as mean ± SD. P-values in (A, B, D) determined by two-way ANOVA. NS, non-significant; *P < 0.05; **P < 0.01; ***P < 0.001; ****P < 0.0001. Source data are available for this figure.
Figure 4.
Figure 4.. HP and HPX are not required to prevent malaria mortality in adult mice.
Adult 8–12 wk-old mice from the genotypes indicated were infected with different Plasmodium strains (i.p., 1 × 10⁵ iRBC). (A, B, C, D) Survival (left panels) and parasitemia (right panels) were monitored daily from day 3 post infection with: (A) P. chabaudi chabaudi (Pcc; N = 8–10 mice, two independent experiments), (B) P. berghei ANKA-GFP (PbANKA; N = 6–9 mice, two independent experiments), (C) P. berghei NK65 (PbNK65; N = 8–23 mice, five independent experiments), (D) P. yoelii yoelii 17XNL (Pyy17XNL; N = 8–11 mice, two independent experiments). Survival is represented in Kaplan–Meier plots. Percentage of infected RBCs (iRBC) was quantified by FACS when using PbANKA-GFP transgenic parasites, or by morphologic assessment of Giemsa-stained blood smears (four to five fields) when using other Plasmodium strains and is represented as mean ± SD. Source data are available for this figure.
Figure 5.
Figure 5.. Compensatory heme scavenging mechanisms during malaria.
(A) Heme buffering capacity of serum from C57BL/6 mice at steady state, assayed by a heme-specific single domain Ab-based sandwich ELISA. Hemin, at the concentrations indicated, was preincubated with serially diluted serum from C57BL/6 mice. Each dot represents a single well in one experiment. (B) Comparison of the heme buffering capacity of serum from Hp+/+Hpx+/+ versus Hp−/−Hpx−/− mice, at steady state. (A) Increasing heme concentrations were pre-incubated with serum (1/250) in the same assay as in (A). Data shown as mean ± SD (N = 3 per genotype) from one experiment. (C) Serum concentrations of ⍺1-microglobulin (mg/dl) in Pcc-infected (1 × 10⁵ iRBC, at the peak of parasitemia: days 8–9 post-infection) and non-infected control mice (N = 4 per indicated genotype). (D) α1-Microglobulin concentrations in serum from P. falciparum-infected individuals stratified according to disease severity: Uncomplicated malaria (N = 21), cerebral malaria (CM; N = 58) or severe non-cerebral malaria (N = 60). (C, E) Serum concentrations of albumin in the same mice as in (C). (D, F) α1-Microglobulin concentrations in serum from P. falciparum-infected individuals as in (D). (G, H, I) Serum concentrations of (G) low density lipoprotein (LDL); (H) Oxidized LDL. (G, H, I) Ratio of oxidized LDL/LDL calculated from (G) and (H). Data in (C, E, G, H, I) represented as mean ± SD (N = 4 mice per genotype) from one to two independent experiments with similar trend. Dots represent individual mice. Data in (D, F) are represented in violin plots where circles represent individuals and red line indicates median values. (D, F) In (C, E, G, H, I) P-values were determined by two-way ANOVA and in (D, F) by one-way ANOVA. NS, nonsignificant; *P < 0.05; **P < 0.01; ***P < 0.001; ****P < 0.0001. Source data are available for this figure.
Figure 6.
Figure 6.. HP and HPX are essential to survive malaria in ageing mice.
(A) Ageing (>30 wk) mice from the indicated genotypes were infected with Pcc (i.p., 2 × 10⁶ iRBCs). Survivals (left panel) are represented in the Kaplan–Meier plot and parasitemia (Right panel) by mean ± SD, monitored daily from day 3 post infection. Data pooled from three independent experiments (N = 7–12 mice per genotype), with a similar trend. (B) Quantification of labile heme in serum (Left panel) and renal heme (Right panel) at the peak of Pcc infection (2 × 10⁶ iRBC; day 7 post-infection) in Hp+/+Hpx+/+ and Hp−/−Hpx−/− mice. Data shown as mean ± SD from one experiment (N = 4–5 mice per genotype). P-values determined using two-way ANOVA. (C) Kidney Perl’s Prussian blue staining (non-heme Fe3+) from N = 4–5 mice per genotype (non-infected or Pcc-infected: 2 × 10⁶ iRBC, at the peak of infection: day 7 post-infection) in one experiment. Top panels show whole-kidney sections and bottom panels higher magnifications from the area highlighted. Arrowheads indicate Fe3+ (blue). GL, glomerulus; PT, proximal tubules. (C, D) Quantification of renal non-heme Fe3+ accumulation, detected in the same experiment as in (C). Data presented as mean ± SD (N = 4–5 mice per genotype). (E) Quantification of renal non-heme iron concentration, shown as mean ± SD (N = 4–5 mice per genotype). P-values in (D, E) determined using two-way ANOVA. NS, nonsignificant; *P < 0.05; **P < 0.01; ****P < 0.0001. Source data are available for this figure.
Figure 7.
Figure 7.. Age-dependent effect of HP and HPX on the regulation of gene expression in the kidneys of Pcc-infected mice.
(A) Schematic representation of the experimental procedure used for renal bulk RNA-seq analyzes (Left panel). Euler plots of renal bulk RNA-seq data (Right panels) indicating the number and proportion of genes differentially expressed (All), induced (up-regulated) and repressed (down-regulated) in kidneys from Pcc-infected versus non infected (NI) male C57BL/6 mice. Red corresponds to genes differentially regulated, in a nonoverlapping manner (unique), in adult Pcc-infected male mice. Green corresponds to genes regulated, in an overlapping (shared) manner, in adult and ageing Pcc-infected mice. Blue corresponds to genes regulated, in a nonoverlapping manner (unique), in ageing Pcc-infected mice. (A, B) Manhattan plots of gProfiler renal bulk RNA-seq data from (A), depicting gene ontology (GO) analysis for biological processes (GO:BP; green), cellular components (GO:CC; orange), and molecular function (GO:MF; blue), Kyoto Encyclopedia of Genes and Genomes pathways (pink), Reactome (REAC, light green), transcription factors (TF; yellow), and WikiPathway (WP; gray). Left panel (red) corresponds to genes differentially regulated, in a nonoverlapping manner (unique), in adult Pcc-infected mice. Middle panel (green) corresponds to genes regulated, in an overlapping (shared) manner, in adult and ageing Pcc-infected mice. Right panel (blue) corresponds to genes regulated, in a nonoverlapping manner (unique), in ageing Pcc-infected mice. Data from N = 2 mice per experimental group from two independent experiments with similar trend. Source data are available for this figure.
Figure 8.
Figure 8.. Age-dependent effect of HP and HPX on the regulation of gene expression in the kidneys of Pcc-infected mice.
(A) Schematic representation of the experimental procedure used for renal bulk RNA-seq analyzes in ageing Hp−/−Hpx−/− versus control aged-matched Hp+/+Hpx+/+ mice at steady state. (B) Volcano plots displaying differential gene expression between whole kidneys from ageing Hp−/−Hpx−/− versus control aged-matched Hp+/+Hpx+/+ mice at steady state. (B, C) Gene ontology (GO) analysis of differentially expressed genes from (B). Top 20 significant up- or down-regulated GO terms depicted, for comparisons where more than 20 significant GO terms were found. (D) Schematic representation of the experimental procedure used for renal bulk RNA-seq analyzes in ageing Pcc-infected Hp−/−Hpx−/− versus control aged-matched Pcc-infected Hp+/+Hpx+/+ mice. (E) Volcano plots displaying differential gene expression between whole kidneys from ageing Pcc-infected Hp−/−Hpx−/− versus control aged-matched Pcc-infected Hp+/+Hpx+/+ mice. (F) Gene ontology (GO) analysis of differentially expressed genes from (E), displayed as in (C). Genes significantly up-regulated in kidneys from Hp−/−Hpx−/− mice are represented in red dots, whereas blue dots represent down-regulated genes. Grey dots represent not statistically significant genes. Analysis of same data as Fig 7, performed using gProfiler. Data from N = 2–3 mice per experimental group from 1 independent experiment. Source data are available for this figure.
Figure 9.
Figure 9.. Levels of circulating HPX and heme are associated with P. falciparum acute kidney injury.
(A) Representative H&E staining of the kidney from ageing (>30 wk) Hp+/+Hpx+/+ and Hp−/−Hpx−/− mice infected with Pcc (i.p., 2 × 10⁶ iRBCs, at the peak of infection: day 7 postinfection). Images are representative from N = 4–5 mice per condition. Top panels show whole-kidney section and bottom panels show higher magnifications from the rectangle highlighted in the top panel. (B) Asterisks indicate hemoglobin casts. GL, glomerulus; PT, proximal tubules. (A) Histopathological evaluation of kidneys from (A) was performed using digitalized whole-slide images, corresponding to whole-kidney sections. Scores are represented as mean ± SD (n = 4–5 mice per genotype). Dots correspond to individual mice. P-values determined by Two-Way ANOVA. *P < 0.05; ****P < 0.0001; NS, not significant. Scores: 0 = No lesions; 1 = Single cell necrosis, discrete hemoglobin tubular casts; 2 = Mild; 3 = Moderate; 4 = Severe tubular cell necrosis, hemoglobin tubular casts. (C, D) Spearman correlation coefficients between indicated variables and LNC2 and creatinine in serum of P. falciparum-infected individuals (same individuals as in Fig 1), corrected for multiple tests (Holm–Sidak). Source data are available for this figure.

References

    1. Adams PA, Berman MC (1980) Kinetics and mechanism of the interaction between human serum albumin and monomeric haemin. Biochem J 191: 95–102. 10.1042/bj1910095 - DOI - PMC - PubMed
    1. Allhorn M, Berggard T, Nordberg J, Olsson ML, Akerstrom B (2002) Processing of the lipocalin alpha(1)-microglobulin by hemoglobin induces heme-binding and heme-degradation properties. Blood 99: 1894–1901. 10.1182/blood.v99.6.1894 - DOI - PubMed
    1. Andersen CB, Torvund-Jensen M, Nielsen MJ, de Oliveira CL, Hersleth HP, Andersen NH, Pedersen JS, Andersen GR, Moestrup SK (2012) Structure of the haptoglobin-haemoglobin complex. Nature 489: 456–459. 10.1038/nature11369 - DOI - PubMed
    1. Andersen CBF, Stødkilde K, Saederup KL, Kuhlee A, Raunser S, Graversen JH, Moestrup SK (2017) Haptoglobin. Antioxid Redox Signal 26: 814–831. 10.1089/ars.2016.6793 - DOI - PubMed
    1. Ascenzi P, Bocedi A, Notari S, Menegatti E, Fasano M (2005) Heme impairs allosterically drug binding to human serum albumin Sudlow’s site I. Biochem Biophys Res Commun 334: 481–486. 10.1016/j.bbrc.2005.06.127 - DOI - PubMed

Publication types