. 2024 Feb 2;15(1):1009.
doi: 10.1038/s41467-024-45215-0.

Targeting ALK averts ribonuclease 1-induced immunosuppression and enhances antitumor immunity in hepatocellular carcinoma

Affiliations

Targeting ALK averts ribonuclease 1-induced immunosuppression and enhances antitumor immunity in hepatocellular carcinoma

Chunxiao Liu et al. Nat Commun. .

Abstract

Tumor-secreted factors contribute to the development of a microenvironment that facilitates the escape of cancer cells from immunotherapy. In this study, we conduct a retrospective comparison of the proteins secreted by hepatocellular carcinoma (HCC) cells in responders and non-responders among a cohort of ten patients who received Nivolumab (anti-PD-1 antibody). Our findings indicate that non-responders have a high abundance of secreted RNase1, which is associated with a poor prognosis in various cancer types. Furthermore, mice implanted with HCC cells that overexpress RNase1 exhibit immunosuppressive tumor microenvironments and diminished response to anti-PD-1 therapy. RNase1 induces the polarization of macrophages towards a tumor growth-promoting phenotype through activation of the anaplastic lymphoma kinase (ALK) signaling pathway. Targeting the RNase1/ALK axis reprograms the macrophage polarization, with increased CD8+ T- and Th1- cell recruitment. Moreover, simultaneous targeting of the checkpoint protein PD-1 unleashes cytotoxic CD8+ T-cell responses. Treatment utilizing both an ALK inhibitor and an anti-PD-1 antibody exhibits enhanced tumor regression and facilitates long-term immunity. Our study elucidates the role of RNase1 in mediating tumor resistance to immunotherapy and reveals an RNase1-mediated immunosuppressive tumor microenvironment, highlighting the potential of targeting RNase1 as a promising strategy for cancer immunotherapy in HCC.


Conflict of interest statement

The authors declare no competing interests.

Figures
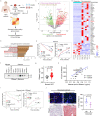
Fig. 1
Fig. 1. RNase1 predicts poor prognosis for HCC and poor clinical response of it to anti-PD-1 therapy.
a Experimental strategy. Figure was created with BioRender.com. b The 10 most frequently enriched biological process GO terms in nivolumab non-responders. Upregulated genes are functionally annotated using GO terminology using the R-package clusterProfiler. c Volcano plot of fold differences in genes between HCC samples from nivolumab responders (n = 5) and non-responders (n = 5). P values were calculated using the Wald test. Secreted protein-coding genes belonging to the RNase superfamily or known to be associated with human cancer are shown in different colors. d Heat map of the expression of the most differentially expressed secreted proteins in (c) (P < 0.001; 34 upregulated and 10 downregulated genes). Data were analyzed using two-sided t-test. e OS and recurrence probability in HCC patients based on RNase1 expression. f Expression of secreted RNase1 protein in murine and human HCC cells. Representative results from 3 independent experiments. g Enzyme-linked immunosorbent assay (ELISA) analysis of RNase1 expression in plasma samples from HCC patients (n = 67) and normal individuals (n = 15). h Correlation analysis of the plasma RNase1 concentrations and RNase1 expression levels in paired human HCC samples (n = 55; R = 0.6 [two-sided Pearson’s chi-square test]). i OS and recurrence probability in HCC patients based on RNase1 plasma level. j IHC and IF staining of HCC samples from nivolumab responders (n = 5) and non-responders (n = 8). Left: Fluorescent multiplex immunohistochemical labeling using the indicated antibodies upon nivolumab-based treatment (upper panel) and immunohistochemical staining for RNase1 in human HCC samples (bottom panel). Scale bars, 50 μm (inset, 25 μm). Right: RNase1 immunohistochemistry scores for human HCC samples upon nivolumab exposure (n = 13; P = 0.0216). Results are presented as mean ± SD values. Statistical analysis: g two-sided Unpaired Student’s t-test; e and i Log-rank test. Source data are provided as a Source Data file.
Fig. 2
Fig. 2. RNase1 expression is correlated with extensive infiltration of immunosuppressive myeloid cells.
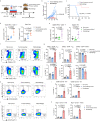
a The RNase1 plasma levels in mice bearing HCA-1/Vec or HCA-1/R1 tumors (n = 6 mice per group) on day 22 of treatment. b Schematic of the protocol for anti-PD-1 (αPD-1) and IgG-based treatment in the orthotopic HCC model. c Representative images of orthotopic liver tumors after αPD-1 or IgG treatment. d Normalized tumor weights measured at the treatment endpoint (n = 5 mice per group). e Survival of mice bearing HCA-1/Vec– or HCA-1/R1–derived orthotopic tumors following treatment with αPD-1 or IgG (n = 5 mice per group; log-rank test). f Identification of differentially distributed cellular phenotypes in HCA-1/Vec– and HCA-1/R1–derived tumor samples using the t-SNE algorithm. g Heat maps of the median immune cell marker intensities according to cytometry by time of flight-based immune profiling of HCA-1–derived tumors. h Myeloid cell populations detected using CD11b, F4/80, Ly6C, Ly6G, and CD11c as markers. The cells in the map are color-coded according to the intensity of the expression of the indicated markers. i Quantification of the cell populations in (h). j Lymphocyte populations detected using CD3e, CD4, CD8, and CD19 as markers. k Quantification of the lymphocyte populations in (j). fk n = 5 for HCA-1/Vec group and n = 6 for HCA-1/R1 group. l and m Cell number of myeloid cell (l) and lymphocyte (m) populations in orthotopic model. np Percentages (n) and absolute numbers (o and p) of iNOS+CD206 and iNOSCD206+ TAM subsets in the tumors. lp n = 5 for HCA-1/Vec group and n = 5 for HCA-1/R1 group. Representative results from 3 independent experiments. The error bars represent (mean ± SD) values. Statistical analysis: a, d, i, km, o, p two-sided Unpaired Student’s t-test. Source data are provided as a Source Data file.
Fig. 3
Fig. 3. RNase1 regulates macrophage polarization and predicts reduced rates of response of HCC to anti-PD-1 therapy.
a, b RNase1 expression level was negatively correlated with M1-like macrophage infiltration (a) and positively correlated with M2-like macrophage infiltration (b). The M1- and M2-like macrophages are distinguished according to the average level of RNase1 expression in the TCGA database (n = 178 samples in both the RNase1-low and -high group). c Heat map of the expression of surface markers used to identify M1/M2 macrophages (n = 2 samples per group). d BMDMs were stimulated with or without RNase1 (1 μg/ml) for 24 h, stained for CD206 and iNOS, and analyzed using flow cytometry (n = 6 independent experiments per group). e BMDMs were stimulated with IFN-γ (10 ng/ml) plus LPS (200 ng/ml) in the presence or absence of RNase1 (1 μg/ml) for 24 h. The results of a representative experiment are shown in the left panel, and cumulative data from six independent experiments are shown in the right panel. f Immunoblot of secreted RNase1 in Hepa1-6 cells transduced with Cas9 and a control single guide RNA (sgCtrl) or sgRNase1. g Schematic of the treatment schedule for αPD-1 (100 μg per mouse) and IgG in C57BL/6 J mice injected with Hepa1-6/sgCtrl or Hepa1-6/sgRNase1 cells. Figure was created with Adobe Illustrator. h, i Tumor growth in mice bearing Hepa1-6/sgCtrl (h) or Hepa1-6/sgRNase1 (i) tumors after therapy with αPD-1 or IgG. The lightly colored lines represent individual tumor growth curves (n = 6 mice per group). j Representative images of immunostaining for CD206, CD8, and Granzyme B in mouse Hepa1-6 tumors. Hoechst: counterstaining. Scale bar, 20 μm. km Quantification of CD206 (k), CD8 (l), and Granzyme B (m) (n = 6 mice per group). Unit = 19,766 μm2. n Survival rates for mice bearing Hepa1-6/Ctrl– or Hepa1-6/sgRNase1–derived tumors following treatment with αPD-1 or IgG (n = 6 mice per group; log-rank test). fh Representative results from 3 independent experiments. The error bars represent (mean ± SD) values. Statistical analysis: a, b, d, e, k, l, and m two-sided Unpaired Student’s t-test. h and i a log-rank test. Source data are provided as a Source Data file.
Fig. 4
Fig. 4. RNase1 modulates macrophage polarization through ALK.
a Pull-down assay and Western blot analysis of the interaction between RNase1 and ALK in BMDMs and Raw264.7 cells. b Raw264.7 sgCtrl or sgAlk cells were treated with or without RNase1 (1 μg/ml) for 15 min. Detection of ALK and RNase1 binding was performed using a Duolink assay. Scale bar, 20 μm. c HEK-293T cells were transfected with plasmids containing a control vector (Vec), wild-type ALK (ALK-WT), or a kinase-dead mutant ALK (ALK-I1250T). An immunoblot of the indicated cells treated with RNase1 (1 μg/ml) for 15 min is shown. d Western blot of BMDMs and Raw264.7 cells treated with recombinant RNase1 protein (1 μg/ml) at various time points using the indicated antibodies. e BMDMs were treated with IFN-γ (10 ng/ml) plus LPS (200 ng/ml) for various time points in the presence or absence of RNase1 (1 μg/ml). f BMDMs transfected with ALK siRNAs and treated with or without IFN-γ plus LPS in the presence or absence of RNase1 for 24 h. g, h THP-1–derived macrophages expressing ALK short hairpin RNA (shALK) were treated with IFN-γ plus LPS (g) or IL-4 (h) for 12 h in the presence or absence of RNase1. The indicated mRNA expression in these cells was measured using quantitative polymerase chain reaction and is shown as average values from six independent experiments. The error bars represent (mean ± SD) values. i, j BMDMs were pretreated with an ALKi for 2 h followed by IFN-γ plus LPS and RNase1 (1 μg/ml) for 24 h. The results of one representative experiment are shown in (i), and cumulative data from six independent experiments are presented in (j). The error bars represent mean ± SD values. k BMDMs were pretreated with various doses of crizotinib (Cri) or alectinib (Ale) for 2 h and then activated with IFN-γ plus LPS and RNase1 for 24 h (n = 6 mice per group). af, and k Representative results from 3 independent experiments. Statistical analysis: g, h, and j two-sided Unpaired Student’s t-test. Source data are provided as a Source Data file.
Fig. 5
Fig. 5. The combination of an ALKi and anti-PD-1 therapy leads to macrophage polarization reprogramming and enhancement of immune effector functions.
a Schematic of the protocol for combination treatment with αPD-1 and crizotinib using an orthotopic HCC model. Figure was created with BioRender.com. b Magnetic resonance images of orthotopic liver tumors in the indicated groups of mice on day 5 (D5) and day 25 (D25) after tumor-cell implantation. c Mouse tumor weights measured at the treatment endpoint (n = 5 per group). df Percentages (d) and absolute numbers (e, f) of CD206+ and CD206 TAM subsets in the tumors. g, h Absolute numbers of CD8+ T cells (g) and IFN-γ+granzyme B+ CD8+ T cells (h) in the tumors. i, j Absolute numbers of Th1-cell (i) and Treg (j) subsets in the tumors. For ej n = 5 for control group; n = 6 for anti-PD-1 or Crizotinib treatment group; and n = 7 for combination group. k OS durations in mice bearing HCA-1-RNase1 tumors following treatment, as indicated (n = 6 mice per group). Log-rank test. l IHC staining from tumors of indicated group. Scale bar, 50 µm. m Quantification of IHC score of CD206, Granzyme B and PD-L1 in indicated groups (n = 5 per group). n, o The tumor growth of Hepa1-6 cells in C57BL/6 mice treated with Alectinib, anti-PD-1, or the combination. Representative images of tumors are shown on (n) and quantification of tumor volume is shown on (o). n = 6 mice per group. pr Absolute numbers of iNOS+ CD206 TAM (p), CD8+ T cells (q) and IFN-γ+ GranB+ CD8+ T (r) cells in the tumors (n = 6 per group). ak Representative results from 2 independent experiments. nf Representative results from 3 independent experiments. The error bars represent mean ± SD values. Statistical analysis: c, ej, m, and pr, two-sided Unpaired Student’s t-test. o a log-rank test. Source data are provided as a Source Data file.
Fig. 6
Fig. 6. Treatment with an ALKi and anti-PD-1 antibody results in protection from a secondary tumor challenge in an HCC mouse model.
a Scheme of the experimental procedure for the HCA-1/R1 tumor regression study. C3H mice were challenged with stable HCA-1/R1 cells and given crizotinib and an anti-PD-1 antibody as indicated in Fig. 5a. Mice with complete tumor regression were rechallenged 45 days after tumor-cell injection (n = 12). Similarly aged C3H mice (n = 12) were injected with HCA-1/R1 cells and used as tumor-bearing controls. TdLNs and splenocytes were harvested from mice for flow cytometric analysis 7 days after tumor rechallenge (n = 6 per group). Figure was created with Adobe Illustrator. b The sizes of the tumors over time in the rechallenge and tumor-bearing control groups (n = 6 per group). c The overall survival rates for the rechallenged and tumor-bearing control mice (n = 6 per group). d, e The numbers of CD8+IFN-γ+ T cells and Th1 cells in the TdLNs (d) and spleens (e) of the indicated groups of mice (n = 6 per group). The error bars represent mean ± SD values. f, g The percentages (f) and absolute numbers (g) of CD8+ and CD4+ TCM, TEM, and naïve T-cell subsets in TdLNs. h, i The percentages (h) and absolute numbers (i) of CD69+CD103+ and CD69+CD103 subsets of CD8+ Trm cells in TdLNs. j, k Percentages (j) and absolute numbers (k) of Klrg1+CD127CD8+ Teff cells and Klrg1CD127+CD8+ Tmem cells in TdLNs. For g, i and k: n = 6 for non-tumor and tumor-bearing control groups; n = 5 for rechallenge group. The error bars represent (mean ± SEM) values. ac Representative results from 2 independent experiments. The results were analyzed using two-way analysis of variance (ANOVA; b), a log-rank test (c), a two-sided unpaired Student t-test (d, e), or one-way ANOVA (g, i, and k).
Fig. 7
Fig. 7. Pathological relevance of RNase1, CD206, CD8, and PD-L1 expression in HCC patients.
ac Quantification of immunohistochemical staining for the correlation between RNase1 and CD206 (a), RNase1 and CD8 (b), and RNase1 and PD-L1 (c) expression using a human HCC tissue microarray. Correlations were assessed using the two-sided Pearson chi-square test. A P value less than 0.05 was set as the criterion for statistical significance. d Two representative cases from the immunohistochemical staining in (ac). Scale bar, 50 μm. e A proposed model of RNase1 as a secretory biomarker used to identify treatment options for HCC. In brief, high plasma levels of RNase1 induce immunosuppression by promoting the polarization of TAMs via binding to ALK and trigger ALK/STAT3 signaling, which in turn debilitates antitumor immune responses. ALK inhibitor treatment enhances the efficacy of anti-PD-1 therapy by reprogramming macrophage polarized from pro-tumor phenotype (M2-like) into antitumor phenotype (M1-like), inducing the secretion of T-cell recruiting chemokines, intertumoral accumulation of cytotoxic CD8+ T cells, as well as reduction of Tregs. In addition, memory T-cell were enriched and expanded in rechallenged mice. ALK activation and immunosuppressive state triggered by RNase1 could be reversed by ALK inhibitor and anti-PD-1 combination therapy, and RNase1 could serve as a plasma biomarker to identify patients with HCC who may benefit from this therapeutic strategy. Figure was created with BioRender.com.

References

    1. Ducreux M, et al. The management of hepatocellular carcinoma. Current expert opinion and recommendations derived from the 24th ESMO/World Congress on Gastrointestinal Cancer, Barcelona, 2022. ESMO Open. 2023;8:101567. doi: 10.1016/j.esmoop.2023.101567. - DOI - PMC - PubMed
    1. Kudo M, et al. Lenvatinib versus sorafenib in first-line treatment of patients with unresectable hepatocellular carcinoma: a randomised phase 3 non-inferiority trial. Lancet. 2018;391:1163–1173. doi: 10.1016/S0140-6736(18)30207-1. - DOI - PubMed
    1. Abou-Alfa GK, et al. Cabozantinib in patients with advanced and progressing hepatocellular carcinoma. N. Engl. J. Med. 2018;379:54–63. doi: 10.1056/NEJMoa1717002. - DOI - PMC - PubMed
    1. El-Khoueiry AB, et al. Nivolumab in patients with advanced hepatocellular carcinoma (CheckMate 040): an open-label, non-comparative, phase 1/2 dose escalation and expansion trial. Lancet. 2017;389:2492–2502. doi: 10.1016/S0140-6736(17)31046-2. - DOI - PMC - PubMed
    1. Yang, C. et al. Evolving therapeutic landscape of advanced hepatocellular carcinoma. Nat. Rev. Gastroenterol. Hepatol.10.1038/s41575-022-00704-9 (2022). - PubMed