. 2024 Feb 2;14(1):2788.
doi: 10.1038/s41598-024-52700-5.

The phylogeography of Middle Eastern tree frogs in Israel

Affiliations

The phylogeography of Middle Eastern tree frogs in Israel

Gal Mesika Surizon et al. Sci Rep. .

Abstract

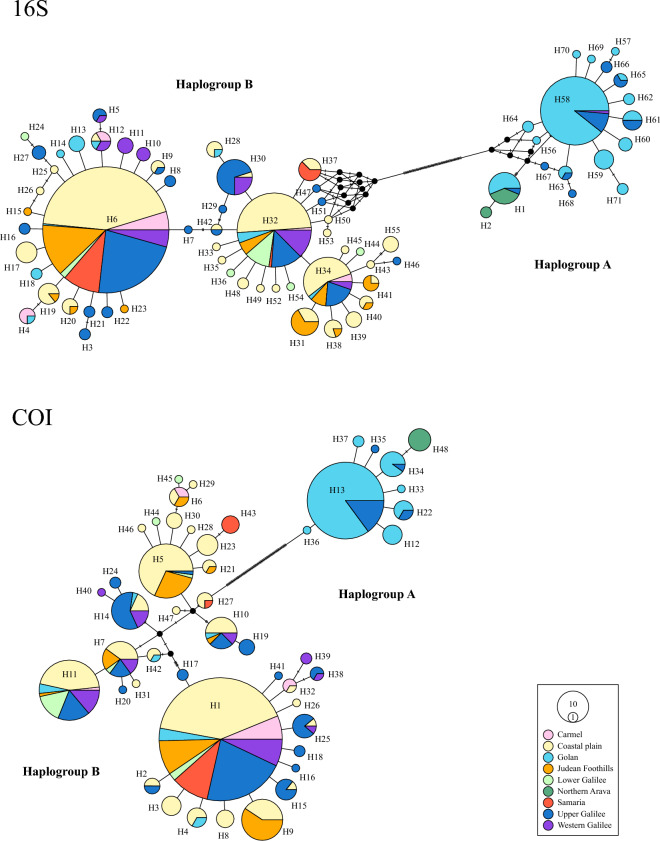
Western Palearctic treefrogs of the genus Hyla provide an example of a morphologically and ecologically cryptic group. Up to three distinct Hyla species have been proposed as resident in Israel and this number has consistently been subject to taxonomical debates. Here, we analyzed 16S rRNA and COI gene fragments of 658 individuals sampled at 47 pools in nine regions across Israel and the West Bank in order to resolve the taxonomic status of Hyla frogs. We generated both Bayesian and Maximum Likelihood phylogenies, and constructed time-calibrated trees to provide an evolutionary and historical context of sequence variations. We further applied SAMOVA as well as Monmonier's maximum-difference algorithm to study the genetic structure among populations and to identify potential zones acting as barriers to gene flow across locations. Our results revealed two distinct haplogroups for each gene fragment, with 95% CI divergence times dated from 8.9-17.1 Mya (16S) and 7.1-23.6 Mya (COI), respectively. SAMOVA and barrier analyses partitioned the populations into three groups. Our results highlight that, while there are probably only two Hyla species in Israel, one population of one of the species might qualify as a separate evolutionarily significant unit. Our findings elucidate the taxonomic status of Hyla frogs in Israel and provide the basis for determining appropriate management and conservation priorities.


Conflict of interest statement

The authors declare no competing interests.

Figures

Figure 1
Figure 1
(a) Map showing the locations of the 47 sampled sites across Israel. Number of individuals of Hyla savignyi (green circles) and H. felixarabica (pink circles) sampled at each locality based on mtDNA 16S (b) and COI (c). Circle sizes represent sample sizes.
Figure 2
Figure 2
Median-joining haplotype networks of 16S and COI haplotypes of Hyla individuals collected from nine regions across Israel. Circle sizes represent haplotype frequencies, cross bars between haplotypes denote one mutation each, and colors correspond to the different regions. Branches are not to scale.
Figure 3
Figure 3
Time-trees for the haplotypes of 658 Hyla individuals from Israel as well as outgroups based on the ML phylogenetic tree output for (a) a 16S rRNA gene fragment and (b) a COI fragment. Estimated upper and lower ranges for each node are represented as red bars. Timescale in million years. Note that for 16S the H. savignyi sequences obtained from GenBank are of different origins. While one sequence was obtained from an individual sampled in Turkey, another sequence was obtained from an individual sampled in Syria prior to the study, classifying individuals from southern Syria as H. felixarabica.
Figure 4
Figure 4
Structure clustering results of 47 Hyla populations throughout Israel based on two gene fragments. (a) PhiCT values for groups (K) 2 to 10 as obtained by SAMOVA analyses, and (b) PhiST values for constructed barriers (B) 1 to 10 as obtained by the Monmonier algorithm. Broken vertical line indicates the most likely number of K and B. (c) Geographical barrier test (Monmonier’s algorithm) for 47 Hyla populations throughout Israel based on two gene fragments (16S rRNA gene and COI). Populations are represented by a red dot and a corresponding black ID number (For details see Table S2); black thin lines depict the Voronoï tessellation of the populations according to their geographic locations; and blue lines constitute the three main genetic barriers (Ba, Bb and Bc) detected through a bootstrap analysis based on 100 permutations. Blue numbers indicate the bootstrap support for 16S/COI.

References

    1. Arteaga A, et al. Comparative phylogeography reveals cryptic diversity and repeated patterns of cladogenesis for amphibians and reptiles in northwestern Ecuador. PLoS ONE. 2016;11:e0151746. doi: 10.1371/journal.pone.0151746. - DOI - PMC - PubMed
    1. Mendoza ÁM, et al. Cryptic diversity revealed by DNA barcoding in Colombian illegally traded bird species. Mol. Ecol. Res. 2016;16:862–873. doi: 10.1111/1755-0998.12515. - DOI - PubMed
    1. Bartáková V, et al. High cryptic diversity of bitterling fish in the southern West Palearctic. Mol. Phylogenet. Evol. 2019;133:1–11. doi: 10.1016/j.ympev.2018.12.025. - DOI - PubMed
    1. Srinivasulu C, Srinivasulu A, Srinivasulu B, Jones G. Integrated approaches to identifying cryptic bat species in areas of high endemism: The case of Rhinolophus andamanensis in the Andaman Islands. PloS ONE. 2019;14:e0213562. doi: 10.1371/journal.pone.0213562. - DOI - PMC - PubMed
    1. Freitas ES, Miller AH, Reynolds RG, Siler CD. A taxonomic conundrum: Characterizing a cryptic radiation of Asian gracile skinks (Squamata: Scincidae: Riopa) in Myanmar. Mol. Phylogenet. Evol. 2020;146:106754. doi: 10.1016/j.ympev.2020.106754. - DOI - PubMed