. 2024 May;5(5):716-730.
doi: 10.1038/s43018-023-00716-7. Epub 2024 Feb 2.

Lung endothelium exploits susceptible tumor cell states to instruct metastatic latency

Affiliations

Lung endothelium exploits susceptible tumor cell states to instruct metastatic latency

Moritz Jakab et al. Nat Cancer. 2024 May.

Abstract

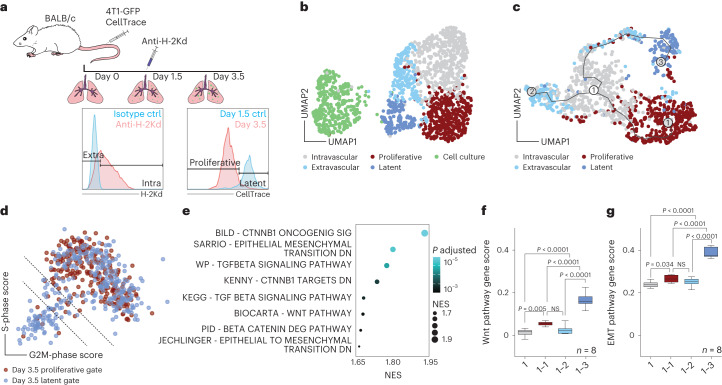
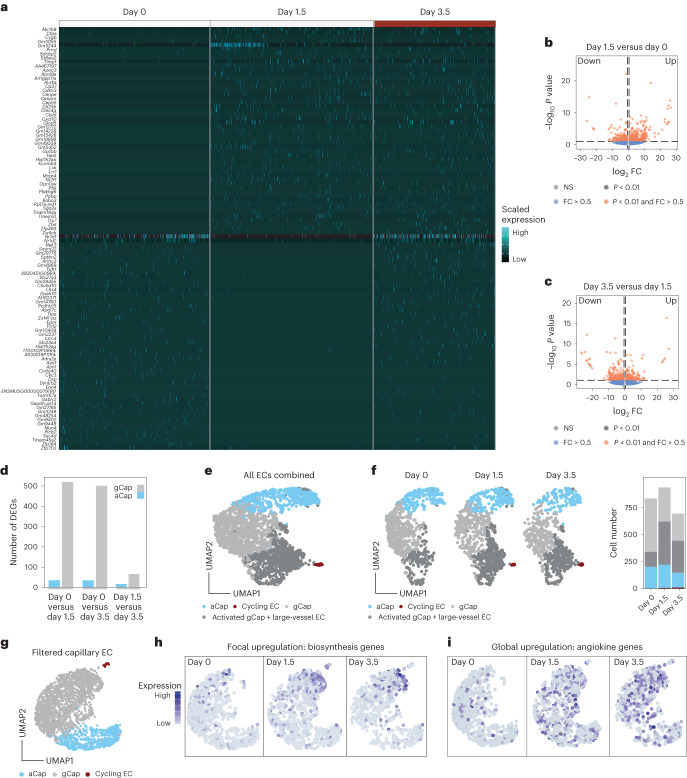
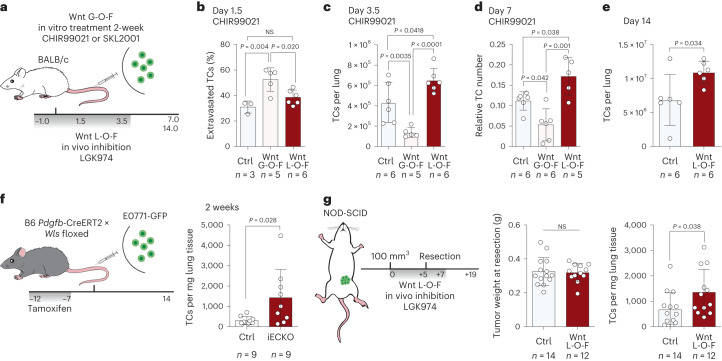
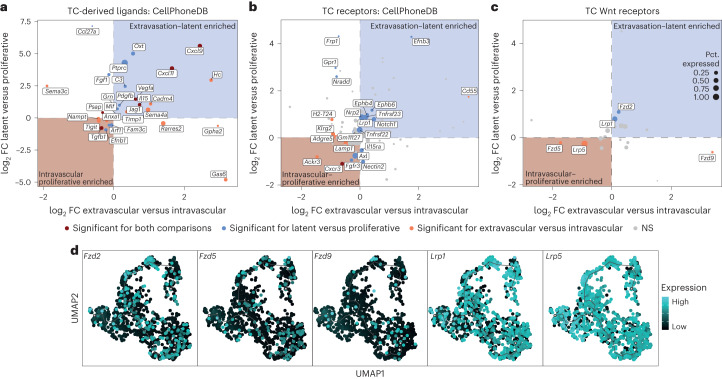
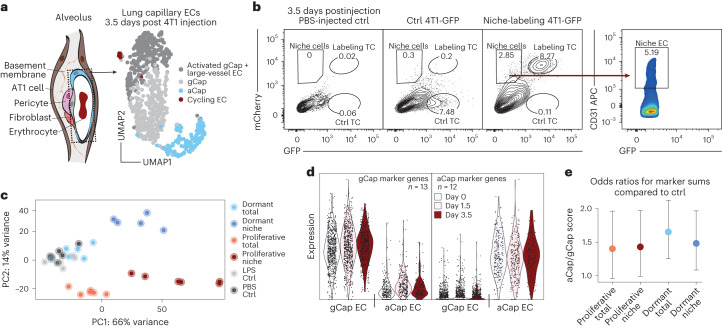
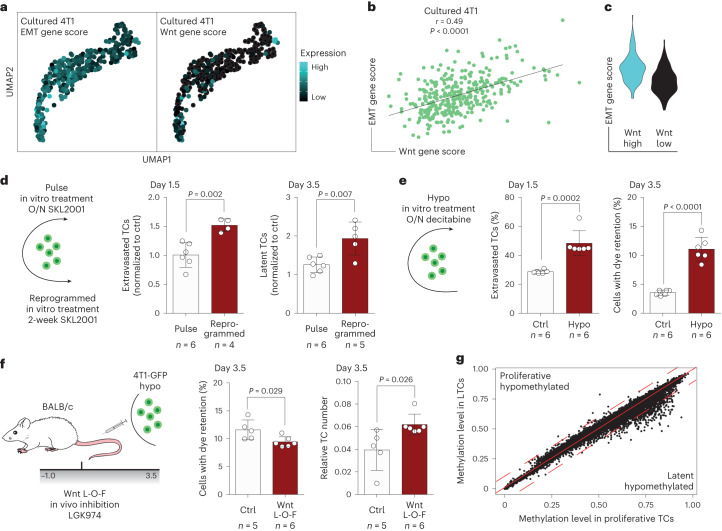
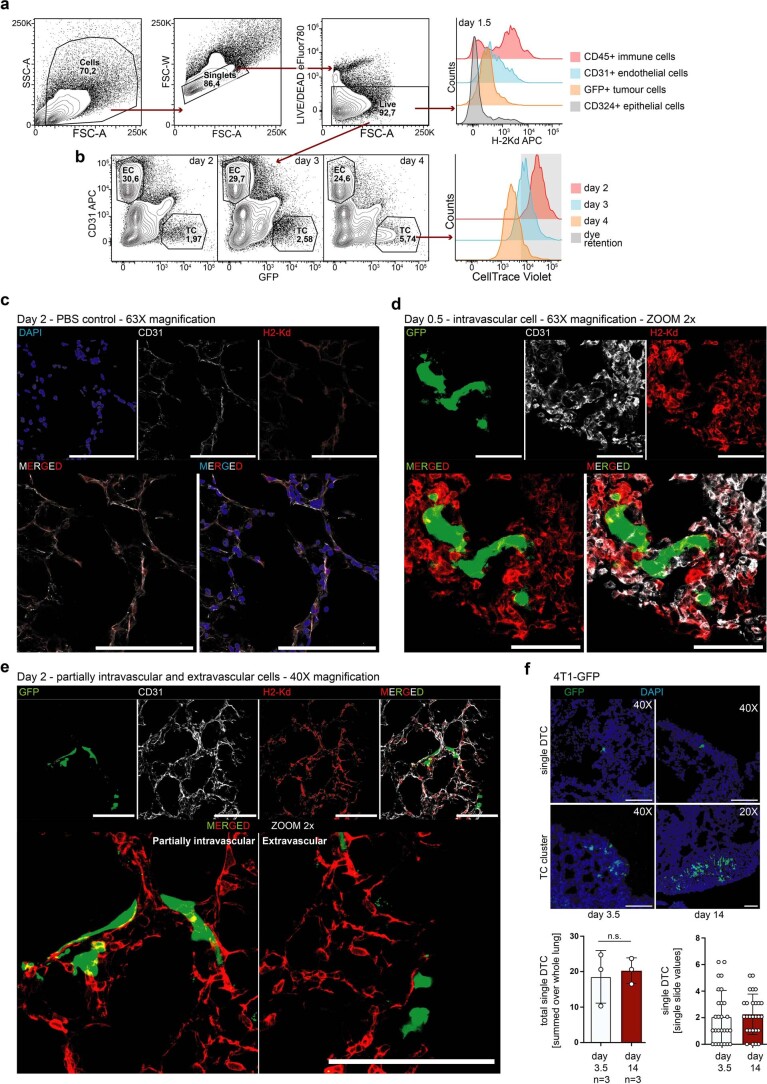
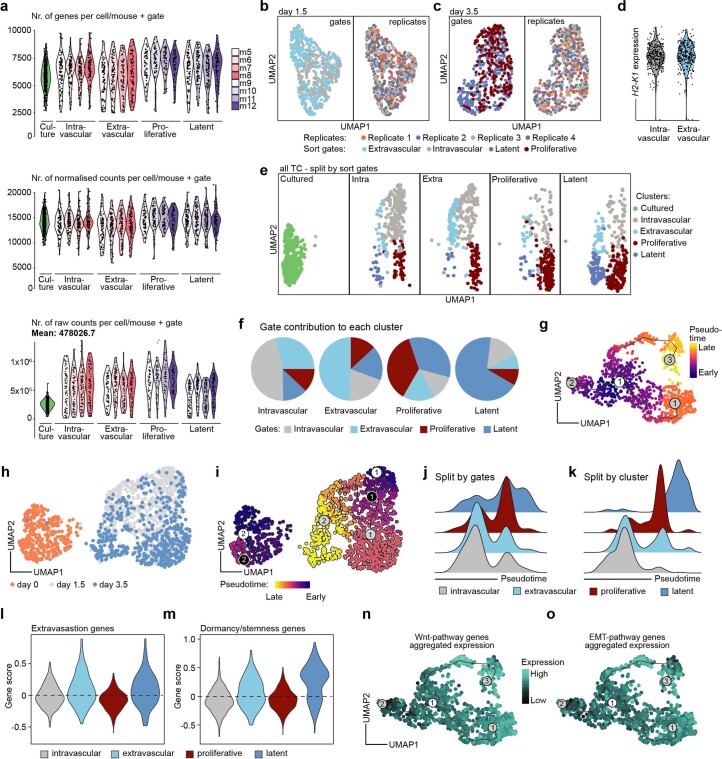
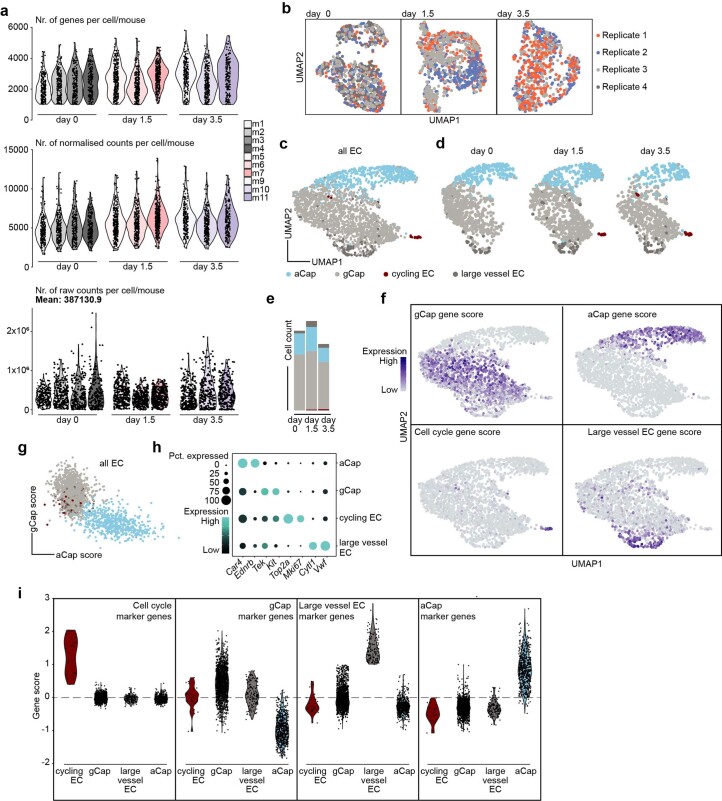
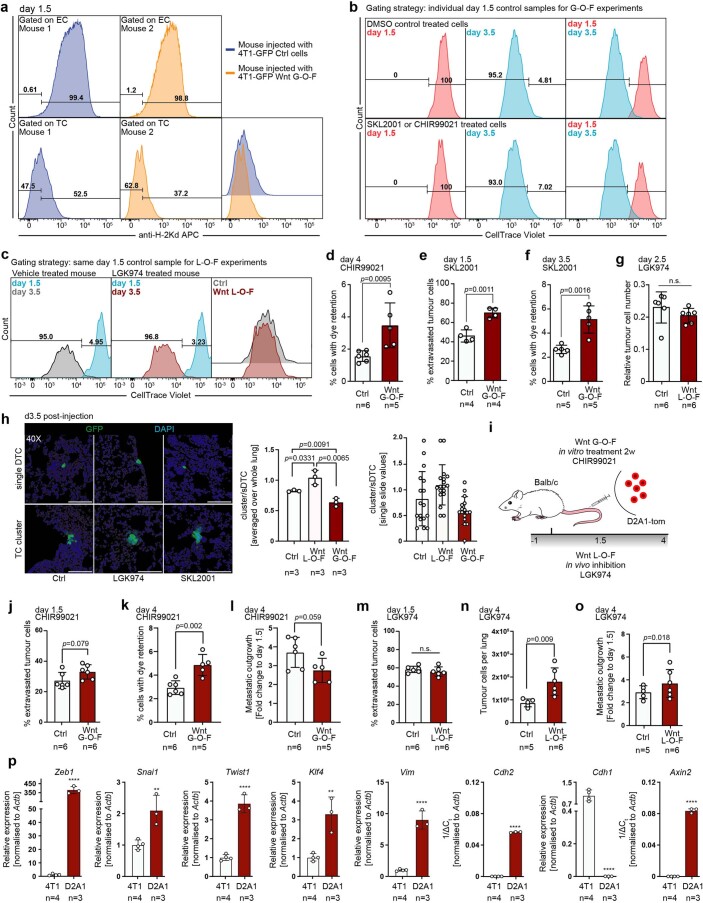
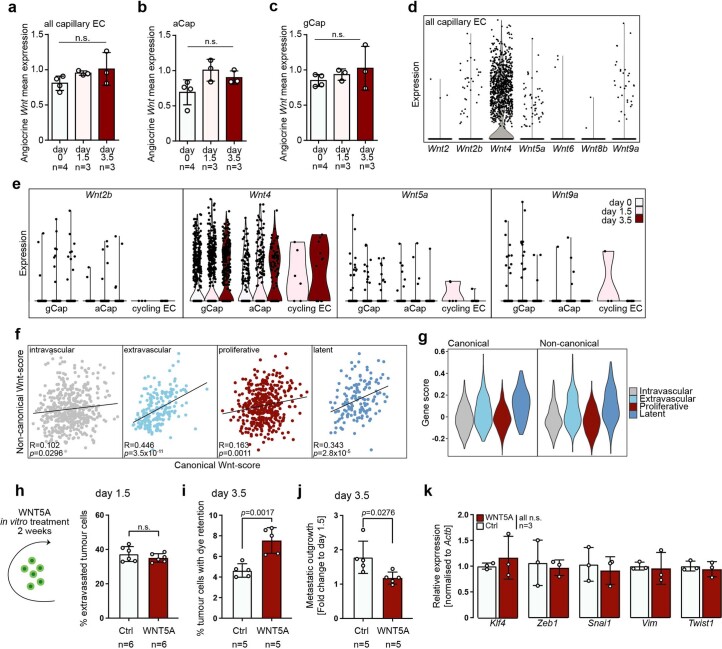
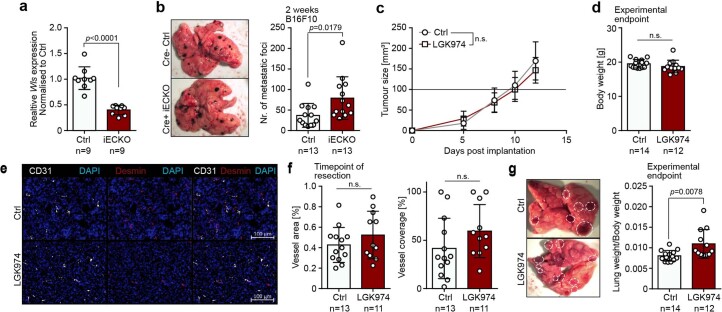
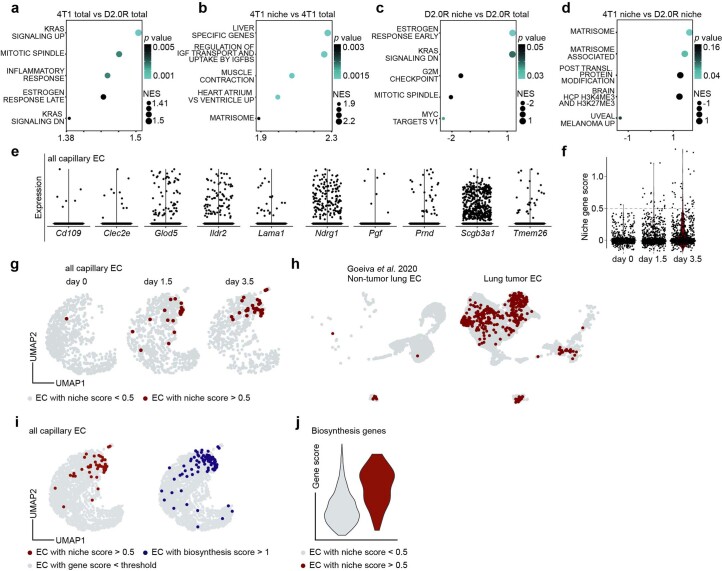
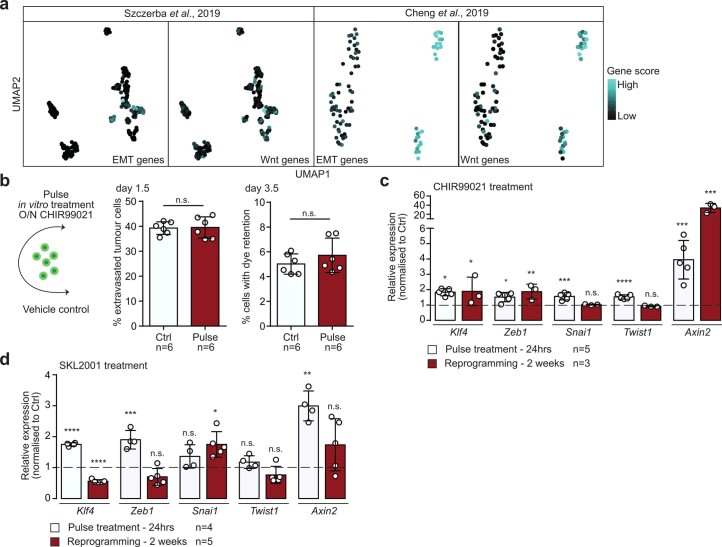
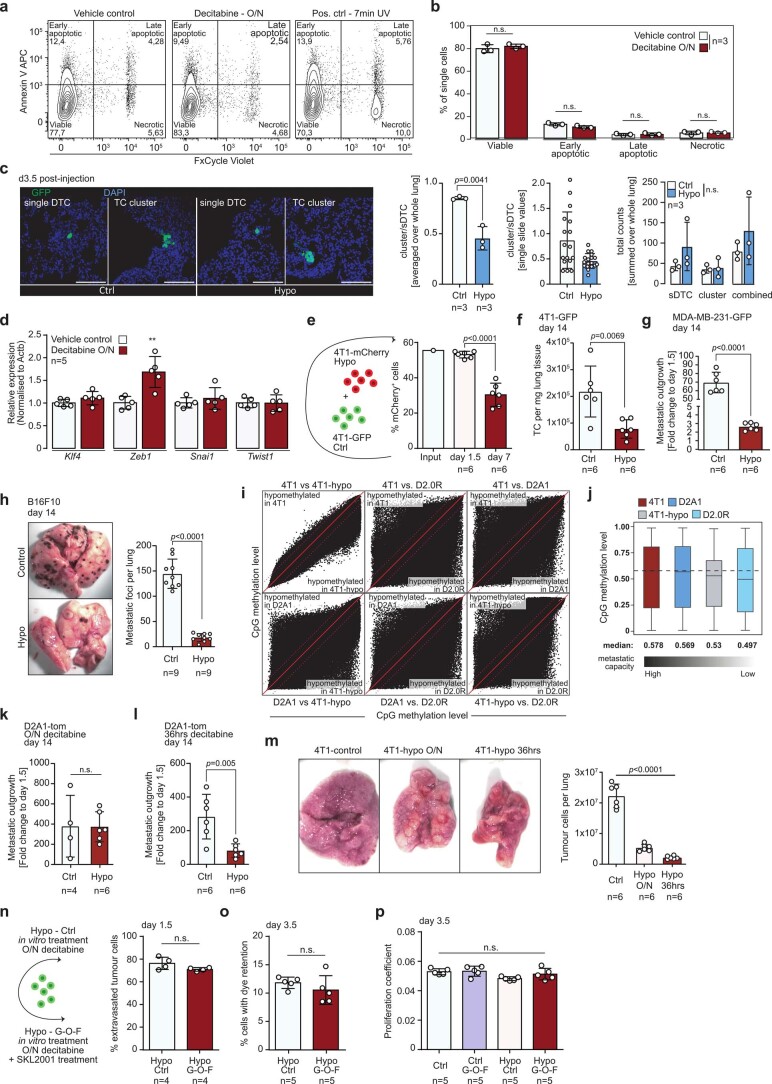
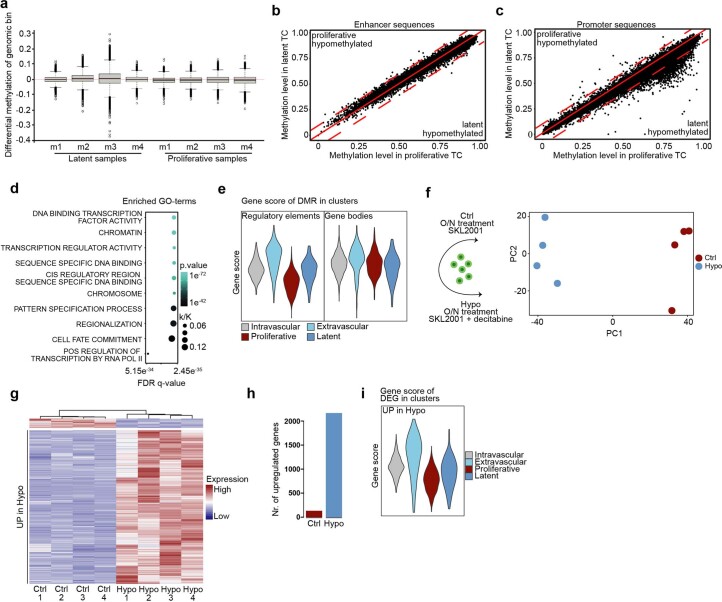
In metastasis, cancer cells travel around the circulation to colonize distant sites. Due to the rarity of these events, the immediate fates of metastasizing tumor cells (mTCs) are poorly understood while the role of the endothelium as a dissemination interface remains elusive. Using a newly developed combinatorial mTC enrichment approach, we provide a transcriptional blueprint of the early colonization process. Following their arrest at the metastatic site, mTCs were found to either proliferate intravascularly or extravasate, thereby establishing metastatic latency. Endothelial-derived angiocrine Wnt factors drive this bifurcation, instructing mTCs to follow the extravasation-latency route. Surprisingly, mTC responsiveness towards niche-derived Wnt was established at the epigenetic level, which predetermined tumor cell behavior. Whereas hypomethylation enabled high Wnt activity leading to metastatic latency, methylated mTCs exhibited low activity and proliferated intravascularly. Collectively the data identify the predetermined methylation status of disseminated tumor cells as a key regulator of mTC behavior in the metastatic niche.


Conflict of interest statement

The authors declare no competing interests.

Figures

Fig. 1
Fig. 1. Extravasation and LTCs are defined by a Wnt and EMT signature.
a, Schematic of the experimental design. Recipient BALB/c mice received two injections of 1 × 106 4T1-GFP cells stained with CellTrace dye via the tail vein. At day 1.5 postinjection, mice were injected intravenously with 5 µg of fluorescently labeled anti-H-2Kd antibody. TCs and ECs were sampled at day 0 (uninjected baseline), day 1.5 and day 3.5. TCs were discriminated based on both extravasation status on day 1.5 and proliferation status on day 3.5. b, UMAP of total TC dataset, with 1,556 cells passing quality control. SNN-based clustering resolved transcriptomes of TCs into five clusters; n = 4 mice per time point. c, Trajectory analysis of extracted TCs from combined day 1.5 and day 3.5 time points reveals three transition branches; the dataset contains 1,194 cells. d, Scatter plot of S- and G2M-phase gene expression scores for individual cells extracted on day 3.5 and colored by respective FACS gates. Dotted lines indicate thresholds of cells with score sums <−1 (lower line) and <0 (upper line). e, GSEA of genes upregulated in bona fide LTCs, ranked by fold change. Selected gene sets are shown (the full set is displayed in Supplementary Table 2). P values computed by permutation. f,g, Gene scores for Wnt pathway-associated genes (f, 146 genes) and for genes upregulated during EMT transition (g, 384 genes). Analysis of pseudobulks of manually selected TCs along the branches of the trajectory in c and grouped by biological replicate, with pseudobulks reflecting intravascular cells (1), cells on the intravascular–proliferative branch (1–1), cells on the intravascular–extravascular branch (1–2) and cells on the extravascular–latency branch (1–3). P values by one-way analysis of variance (ANOVA) with Tukey post test are shown. Box size represents interquartile range (IQR), with midline representing the median of the data, upper line the upper quartile and lower line the lower quartile. Whiskers represent 1.5 × IQR. Ctrl, control; NES, normalized enrichment score; NS, not significant. Source data
Fig. 2
Fig. 2. Lung endothelium exhibits an immediate bimodal response pattern.
ac, Differential gene expression analysis of lung EC pseudobulks comparing day 0 versus day 1.5 and day 1.5 versus day 3.5 using DESeq2. a, Heatmap of highly differentially expressed genes across the experimental timeline, with log2 fold change (FC) >3.5 and P <0.01, as computed in DESeq2 using the Wald test. Scaled expression is shown. b,c, Volcano plots of differentially expressed genes for comparison of day 1.5 versus day 0 (b; full set of DEGs shown in Supplementary Table 3) and for comparison of day 3.5 versus day 1.5 of total lung EC pseudobulks (c; full set of DEGs shown in Supplementary Table 4). FC and P values were computed in DESeq2 using the Wald test. Dotted lines represent thesholds of significance. Horizontal dotted lines indicate fold changes > |0.5|, vertical dotted lines indicate P values < 0.01. d, Differentially expressed genes were calculated using gCap and aCap pseudobulks comparing day 0 with days 1.5 and 3.5, as well as day 1.5 with day 3.5. Numbers of significant DEGs for each comparison and EC type are shown. DEGs were computed using the Wilcoxon rank-sum test. Genes were considered significant for log2 FC > 0.5 and P < 0.01. e, UMAP showing SNN-based clustering of total lung ECs resolved four cell clusters, which were annotated using the same marker genes for the classification shown in Extended Data Fig. 3. The activated gCap cluster was annotated based on upregulated genes compared with the gCap cluster (full set of DEGs shown in Supplementary Table 5). f, UMAP of total lung ECs split by time point and colored by cluster identity (left); barplot showing cell number per cluster and time point (right). The dataset contains 2,479 cells; n = 3–4 mice per time point. g, UMAP of filtered capillary lung ECs, colored by classified cell type. The dataset contains 2,293 cells. h,i, visualization of gene expression as gene scores in UMAP for the biosynthesis gene set (h) and angiokine gene set (i), split by time point.
Fig. 3
Fig. 3. Lung endothelial cells are a major source of latency-inducing Wnt ligands.
a, Schematic of the experimental G-O-F and L-O-F (loss-of-function) strategy. G-O-F was achieved by treatment with either CHIR99021, a selective GSK-3 inhibitor that leads to the accumulation of β-catenin via inhibition of its proteasomal degradation, or SKL2001, which directly interacts with β-catenin and thereby stabilizes the protein. L-O-F was achieved by treatment with LGK974, a selective inhibitor of Porcupine, an enzyme that is crucially involved in the secretion of Wnt ligands. Gray bar indicates time span (in days) of daily treatment with LGK974. b, Percentage of extravasated TCs for control, G-O-F and L-O-F 1.5 days postinjection. Data presented as mean ± s.d.; P values by one-way ANOVA with Tukey post test; n = 3–6 mice. c, Quantification of absolute TC number per lung 3.5 days postinjection for control, G-O-F and L-O-F. Data presented as mean ± s.d., P values by one-way ANOVA with Tukey post test; n = 5–6 mice. d, Quantification of relative TC number normalized to EC abundance in lungs 7 days postinjection for control, G-O-F and L-O-F. Data presented as mean ± s.d., P values by one-way ANOVA with Tukey post test; n = 5–6 mice. e, Quantification of absolute TC number per lung 14 days postinjection for control and L-O-F. Data presented as mean ± s.d., P value by two-tailed t-test; n = 6 mice. f, Schematic of experiment. Gene recombination was induced by tamoxifen administration: 2 × 105 E0771-GFP cells were injected into the tail vein of EC-specific knockout (iECKO) and control animals. Gray bar indicates time span (in days) of daily tamoxifen treatment (left). Total number of TCs per mg lung tissue of control and iECKO mice 2 weeks postinjection of E0771-GFP (right). Data presented as mean ± s.d., P value by two-tailed t-test; n = 9 mice. g, Left, schematic of the experiment. 1 × 106 4T1-GFP cells were implanted into the mammary fat pad of NOD-SCID mice. Once tumors had reached a size of 100 mm³, mice were treated with LGK974 for 5 days until tumor resection. Following resection, mice were treated for an additional 2 days and left to develop metastases. Gray bar indicates time span (in days) of daily treatment with LGK974. Weights of resected primary tumors (middle) and total number of TCs per mg lung tissue of control and LGK974-treated mice 2 weeks postresection (right). Data presented as mean ± s.d., P value by two-tailed t-test; n = 12–14 mice. Source data
Fig. 4
Fig. 4. Resolving the temporal Wnt interactome of endothelial and TCs.
ac, DGEA on TC pseudobulks reflecting the sort gate and biological replicate. Extravascular cells were compared with intravascular cells and LTCs with proliferative cells (full set of DEGs is shown in Supplementary Table 6). DEGs were mapped against CellPhoneDB and filtered for genes that had annotated interaction partners expressed in the lung EC scRNA-seq dataset. Y axis shows log2 FC of DEGs for the latent versus proliferative comparison and x axis shows the log2 FC of the extravascular versus intravascular comparison. Blue and red backgrounds indicate enrichment of the gene for the extravasation–latent and intravascular–proliferative trajectory, respectively. Dot color represents significance: red indicates genes significantly differentially expressed for both latent–proliferative and intravascular–extravascular comparison; blue indicates genes significantly differentially expressed for latent–proliferative but not intravascular–extravascular comparison; and orange indicates genes that are significantly differentially expressed only for intravascular–extravascular comparison. Dot size indicates percentage of TCs with detectable gene expression in the scRNA-seq dataset (Pct. expressed). a, Annotated differentially expressed TC-derived ligands. b, Annotated differentially expressed TC receptors. c, Supervised analysis of Wnt receptors expressed in TCs. log2 FC and P values were computed in DESeq2 using the Wald test. Genes with adjusted P < 0.05 were considered significant. d, Expression pattern of differentially expressed Wnt receptors on the trajectory graph.
Fig. 5
Fig. 5. LTCs do not occupy distinct vascular niches in the lung.
a, Left, schematic of lung alveolus; dotted box highlights ECs. Right, UMAP of EC transcriptomes reflecting the composition of bulk EC samples 3.5 days postinjection of 4T1-GFP cells. b, Representative FACS gates for purification of labeled niche ECs 3.5 days postinjection of niche-labeling 4T1-GFP cells. APC, allophycocyanin. c, Principal component (PC) analysis of samples included in the experiment. Total samples refer to unlabeled CD31+ ECs, niche samples refer to labeled CD31+ ECs, dormant samples refer to injections of niche-labeling D2.0R-GFP, proliferative samples refer to injections of niche-labeling 4T1-GFP. LPS control mice were injected intraperitoneally with LPS 24 h before euthanasia; PBS control mice were injected intravenously with PBS 3.5 days before euthanasia (full set of DEGs is shown in Supplementary Table 7); n = 5–6 replicates per condition. d, Summed expression of gCap and aCap marker genes in individual ECs split by both time point and EC identity. e, log2 FC of aCap/gCap marker genes odds ratios normalized to PBS-injected control samples. Dots represent mean of n = 5–6 replicates. Error bars indicate 95% confidence interval.
Fig. 6
Fig. 6. TC behavior in the metastatic niche is predetermined by methylation state.
a, Gene scores of EMT (left)- and Wnt pathway-associated genes (right) in 362 cultured TCs visualized in UMAP. b, Correlation of gene scores. P and r values by Pearson correlation. c, Violin plot of EMT gene scores in cultured TCs with Wnt gene score >0 (Wnt high, cyan) and Wnt gene score <0 (Wnt low, black). d, Left, schematic of experiment. 4T1-GFP cells were either treated overnight (O/N) with Wnt agonist (pulse) or for 2 weeks (reprogrammed) before injection. Relative fraction of extravasated TCs normalized to the respective control 1.5 days postinjection (middle) and relative fraction of LTCs normalized to the respective control 3.5 days postinjection (right). Data presented as mean ± s.d., P values by two-way ANOVA with Sidak post test; n = 4–6 mice. e, Left, schematic of experiment. 4T1-GFP cells were treated overnight with the demethylating agent decitabine. Percentage of extravasated TCs for control and hypomethylation (hypo) treatment 1.5 days postinjection (middle) and percentage of latent TCs 3.5 days postinjection (right). Data presented as mean ± s.d., P values by two-tailed t-test; n = 6 mice. f, Left, schematic of experimental L-O-F approach. 4T1-GFP cells were treated overnight with decitabine. Gray bar indicates time span (in days) of daily treatment with LGK974. Percentage of latent TCs 3.5 days postinjection for control and LGK974-treated animals (middle) and relative TC number normalized to EC abundance in lungs (right). Data presented as mean ± s.d., P values by two-tailed t-test; n = 5–6 mice. g, Scatter plot of methylation level (fraction of methylated CpG islands) for gene bodies in latent and proliferative TCs. Solid red line indicates no differences in methylation, dotted red lines indicate thresholds for >10% differences in methylation. Source data
Extended Data Fig. 1
Extended Data Fig. 1. FACS-based gating strategy to enrich rare metastasising tumor cell sub-populations.
a, Representative FACS-gates for purifying extravascular and intravascular cells using a self-validating system. Cells (immune and endothelial cells) that are anatomically positioned to be exposed to the circulation show staining, cells that are excluded from the circulation (epithelial cells, tissue resident immune cells) are not stained. TC show partial staining reflecting their extravasation status. b, Representative FACS plots of relative TC abundance in the lung two, three and four days postinjection (left panel) with corresponding temporal tracing of CellTrace dye dilution (right panel). Induction of TC proliferation occurs between day 3 and day 4 postinjection. TC with dye retention were considered latent. For day 3.5 and day 4 experiments, the day 1.5 timepoint was included to set the dye retention gate. c-e, Representative images for validating the intravascular staining using anti-H-2Kd antibody. For all experiments, mice were injected with 30µg anti-H-2Kd-APC antibody 2 min prior to euthanasia. Lungs were excised, fixed in PFA and cryo-embedded. For all images stacks of 20 µm were acquired using sequential scans and z-projections using maximum intensity are displayed. c, Lung from PBS-injected control animal. Upper left panel, DAPI staining is shown (cell nuclei, blue), upper mid panel displays CD31 staining (blood vessels, white) and upper right panel H-2Kd staining (red). Lower left panel shows overlay of CD31 and H-2Kd staining and lower right panel displays overlay of DAPI, CD31, and anti-H-2Kd staining. Scale bars = 100 µm. All images were acquired using 63X magnification objective. d, Lung from mouse 0.5 days postinjection of 4T1-GFP tumor cells (intravascular control). Upper left panel, GFP staining is shown (TC, green), upper mid panel displays CD31 staining (blood vessels, white) and upper right panel H-2Kd staining (red). Lower left panel shows overlay of GFP and H-2Kd staining and lower right panel displays overlay of GFP, CD31, and anti-H-2Kd staining. Yellow colour indicates overlap of GFP and H-2Kd signal. Scale bars = 50 µm. All images were acquired using 63X magnification objective, using zoom factor 2. e, Lung from mouse 2 days postinjection of 4T1-GFP tumor cells. Upper left panel, GFP staining is shown (TC, green), upper mid left panel displays CD31 staining (blood vessels, white), upper mid right panel H-2Kd staining (red), and upper right panel the overlay of GFP, CD31, and H-2Kd. Lower panel shows zoom in (factor 2) of GFP and H-2Kd overlay. Lower left panel displays partially extravasated tumor cells and lower right panel displays fully extravasated tumour cells. Yellow colour indicates overlap of GFP and H-2Kd signal. Scale bars = 100µm. All images were acquired using 40X magnification objective. f, Representative images and quantifications of single disseminated tumor cells (sDTC) and tumor cell clusters in mice 3.5 days or 14 days post 4T1-GFP injection. For all images stacks of 12 µm were acquired and z-projections using maximum intensity are displayed. Magnifications are indicated in the respective image. All images display overlays of DAPI (cell nuclei, blue) and GFP (TC, green). Upper panels show sDTC in lungs 3.5 days (left panel) and 14 days (right panel) postinjection, and lower panels show respective cell clusters. Left quantification shows total sDTC per lung and group, and right quantification shows sDTC number counted for each slide (sum of 2 sections). Data are presented as mean values +/− s.d., p value by two-tailed t-test is shown. n.s., not significant., n = 3 mice. Source data
Extended Data Fig. 2
Extended Data Fig. 2. Characterisation of metastasising tumor cell sub-populations using scRNAseq.
a, Number of detected genes (upper panel), normalized gene counts (mid panel) and total gene counts (lower panel) for each cell passing quality filtering split by FACS-gate and biological replicate. Only TC with detected genes >2500 were analysed. n = 4 mice. b, UMAP of TC extracted from lungs 1.5 days (632 cells) or c, 3.5 days postinjection (562 cells). Cells are coloured by FACS-gate (left panels) or by biological replicate (right panels). d, H2-K1-expression in individual TC isolated 1.5 days postinjection split by their respective FACS-gates. e, UMAP of all TC combined and split by the respective FACS-gates identifies cluster-enrichment for the sorted fractions. f, Pie charts displaying the contribution of the individual FACS gates to each cluster. Each pie chart represents one cluster, individual sections of the pie charts are coloured by FACS gates. g, Pseudo-temporal ordering of TC from the day 1.5 and day 3.5 timepoint combined. h, UMAP of all TC combined coloured by timepoint of sampling. i, Pseudo-temporal ordering of all TC combined. j, Ridge plots of the distribution of cells in pseudotime split by sort gates, and k, by cell clusters. l, Violin plots showing scored expression of genes associated with tumor cell extravasation, and m, of genes associated with tumor cell dormancy and cancer stemness in individual clusters of the TC scRNAseq dataset. n, Visualization of the aggregated expression of Wnt pathway-associated genes and o, genes upregulated during EMT on the trajectory. Source data
Extended Data Fig. 3
Extended Data Fig. 3. Classifying lung EC reveals emergence of cycling and activated gCap.
a, Number of detected genes (upper panel), normalized gene counts (mid panel) or total gene counts (lower panel) for each cell passing quality filtering split by timepoint and biological replicate. Only EC with detected genes >1000 were analysed. n = 3-4 mice. b, UMAP of lung EC isolated at day 0 (left panel, 839 cells), day 1.5 (mid panel, 941 cells) and day 3.5 (right panel, 699 cells) coloured by biological replicate. n = 3-4 mice. c, UMAP of classified EC coloured by cell type (2,479 cells) and d, split by timepoint. e, EC cell type distribution split by timepoint. f, Visualization of marker gene scores used for classification of lung EC on the UMAP. g, Scatter plot of gCap vs. aCap gene scores in individual lung EC. Cells are coloured by classified cell type. h, Dot plot of selected EC subtype marker genes. Dot size reflects percentage of total EC that express the marker gene and color reflects expression level. i, Violin plots of marker gene scores used for cell classification split by classified EC subtype.
Extended Data Fig. 4
Extended Data Fig. 4. Niche-derived Wnt-ligands induce extravasation and latency in experimental metastasis models.
a-c, Representative FACS gates for quantifications of extravasated and latent tumor cells. a, Gating strategy for discriminating extravascular from intravascular tumor cells are shown for a mouse injected with 4T1 control cells (mouse 1, dark blue line) and a mouse injected with 4T1 G-O-F cells (mouse 2, orange line). Gates were set for the control group so that all EC fall into the intravascular gate (upper left panel). The quality of the gating was assessed for each individual sample (upper right panel) and adjusted if grave differences were observed. Samples were excluded if cells were insufficiently stained. EC gates were pasted to tumor cells (lower panels) and the percentage of stained (intravascular) and unstained (extravascular) cells was measured. Lower panels show analysed control TC histograms (left panel), G-O-F TC histograms (mid panel), and the overlay (right panel). b, Gating strategy to quantify latent TC in G-O-F experiments. For each treatment group, one additional mouse was included in the experiment that was euthanized at day 1.5 and served as latent control. Latent gates were set in the respective day 1.5 control samples in a way that all TC fall into the latent gate. Gates were pasted to day 3.5 samples and percentage of latent TC was measured. Left panel shows histogram of day 1.5 TC (red line), mid panel show histogram of day 3.5 TC (blue line) and right panel shows overlay of day 1.5 and day 3.5 histograms for control treated (upper panels) and G-O-F tumor cells (lower panels). c, Representative gating for L-O-F experiment. The gating occurred in principle as outlined above, with the difference that only one day 1.5 control was included, as the same TC were injected for both groups. Left panel displays overlay of day 1.5 control histogram (blue line) and day 3.5 TC extracted from control treated mouse (grey line). Mid panel shows overlay of day 1.5 control histogram (blue line) and day 3.5 TC extracted from LGK974 treated mouse (red line). Right panel shows overlay of day 3.5 TC extracted from control (red line) and LGK974 treated mouse (grey line). d, Percentage of TC with dye retention 4 days postinjection of 4T1-GFP control and Wnt-agonist CHIR99021 long-term treated cells. n = 5-6 mice. e, Percentage of extravasated TC 1.5 days postinjection of 4T1-GFP control and Wnt-agonist SKL2001 long-term treated cells and f, Percentage of TC with dye retention at day 3.5. n = 4-5 mice. g, Relative tumor cell abundance in lungs of Ctrl treated and LGK974 treated mice 2.5 days postinjection of 4T1-GFP tumor cells. Relative tumor cell abundance was calculated as percentage of lung EC, which served as nonproliferative intra-sample control. n = 6 mice. h, Representative images and quantifications of single disseminated tumor cells (sDTC) and tumor cell clusters in mice 3.5 days postinjection for Ctrl (left panels), Wnt L-O-F (mid panels) and Wnt G-O-F (SKL2001) (right panels). For all images stacks of 12 µm were acquired and z-projections using maximum intensity are displayed. All images were acquired using 40X magnification. Panels display overlays of DAPI (cell nuclei, blue) and GFP (TC, green). Upper panels show sDTC and lower panels display cell cluster. Quantification shows cell cluster to sDTC ratios, which were calculated for each lung by summing cell clusters and sDTC across all analysed sections. Quantification to the right displays ratios for each analysed slide (sum of two sections) per group. n = 3 mice. i, Schematic of experiment. j, Percentage of extravasated TC 1.5 days postinjection of D2A1-tom control and Wnt-agonist CHIR99021 long-term treated cells. n = 6 mice. k, Percentage of TC with dye retention at day 3.5 and l, metastatic outgrowth calculated as fold change of tumor cell abundance compared to the mean tumor cell abundance for each treatment group at day 1.5. n = 5-6 mice. m, Percentage of extravasated TC 1.5 days postinjection of D2A1-tom in Ctrl and LGK974 treated mice. n = 6 mice. n, Tumor cell abundance in lungs of Ctrl treated and LGK974 treated mice 3.5 days postinjection of D2A1-tom cells, and o, metastatic outgrowth of D2A1-tom cells in Ctrl or LGK974 treated mice. n = 5-6 mice. p, Relative expression of key EMT-associated genes Zeb1, Snai1, Twist1, Klf4, Vim, Cdh2, Cdh1 and canonical Wnt-downstream target Axin2 in cultured 4T1 cells or D2A1 cells. Target gene expression was normalized to Actb and relative expression to 4T1 cells was calculated using the 2-ΔΔCt-method. For genes without detectable expression in 4T1 cells 1/ΔCt is displayed. d-p Data are presented as mean values +/− s.d., p value by two-tailed t-test are shown. n.s., not significant. * p value < 0.05, ** p value < 0.01, *** p value < 0.001, **** p value < 0.0001. n = 3-4 independent experiments. Source data
Extended Data Fig. 5
Extended Data Fig. 5. Lung endothelial cells express canonical and noncanonical Wnt ligands.
a, Mean summed expression of Wnt-ligands in all capillary EC, b, in filtered aCap or c, in filtered gCap pseudo-bulks of biological replicates. Data are presented as mean values +/− s.d., p values were calculated by one-way ANOVA with Tukey post-test. n.s., not significant. n = 3-4 mice. d, Expression profile for detected Wnt-ligands in individual lung EC of the combined scRNAseq dataset. e, Expression profile of the 4 top expressed Wnt ligands split by timepoint and by EC subtype. f, Correlation of noncanonical Wnt gene scores and canonical Wnt gene scores in cells of the individual tumor cell clusters are shown. P value and r value by Pearson correlation are shown. g, Violin plots of scored gene expression of genes associated with canonical Wnt-signalling (left panel), and noncanonical Wnt-signalling (right panel) in individual TC clusters. h, Schematic of experiment. TC were treated 2 weeks in vitro with WNT5A or PBS control. Quantification shows percentage of extravasated tumor cells 1.5 days postinjection of control or WNT5A treated TC. n = 6 mice. i, Percentage of latent tumor cells 3.5 days postinjection of control or WNT5A treated TC, and j, metastatic outgrowth, calculated as fold change in TC abundance at day 3.5 compared to the mean of the respective day 1.5 timepoint. n = 5 mice. k, Relative expression of key EMT-associated genes Klf4, Zeb1, Snai1, Vim, and Twist1 in cultured 4T1 control or WNT5A treated cells. Target gene expression was normalized to Actb and relative expression to 4T1 cells was calculated using the 2-ΔΔCt-method. n = 3 independent experiments. h-k, Data are presented as mean values +/− s.d., p value by two-tailed t-test are shown. n.s., not significant. Source data
Extended Data Fig. 6
Extended Data Fig. 6. Angiocrine Wnt is a crucial instructor of metastatic latency.
a, Recombination efficiency of Wls-iECKO mice. Expression of Wls was normalized to Actb and fold changes were calculated using the 2-ΔΔCt-method. Data are presented as mean values +/− s.d., p value by two-tailed t-test is shown. n = 9 mice. b, Representative images of metastatic lungs from Cre- control (upper image) and Cre+ iECKO mice (lower image) two weeks postinjection of 2 × 10⁵ B16F10 melanoma cells (left panel) and corresponding quantification of visible metastatic foci per lung (right panel). Data are presented as mean values +/− s.d., p value by two-tailed t-test is shown. n = 13 mice. c, Primary tumor growth curves for vehicle control and LGK974 treated mice. n = 14 for control group, n = 12 for LGK974 treatment group. Data are presented as mean values +/− s.d., p values for each measurement timepoint were calculated by two-tailed t-test. n.s., not significant. d, Body weights of mice at the experimental endpoint. Data are presented as mean values +/− s.d., p value was calculated by two-tailed t-test. n.s., not significant. n = 12–14 mice. e, Representative images of primary tumor vasculature for vehicle control (upper panels) and LGK974 treated mice (lower panels). f, Corresponding quantifications of total vessel area per region of interest (left panel) and desmin coverage of CD31+ vessels (right panel). Data are presented as mean values +/− s.d., p values were calculated by two-tailed t-test. n.s., not significant. n = 11–13 mice. g, Representative images (left panel) of metastatic lungs from vehicle control (upper image) and LGK974 treated mice (lower image). Dotted white circles indicate metastatic nodules. Quantification of lung weight to body weight ratio for vehicle control and LGK974 treated mice at the experimental endpoint. Data are presented as mean values +/− s.d., p value by two-tailed t-test is shown. n = 12–14 mice. Source data
Extended Data Fig. 7
Extended Data Fig. 7. Proliferative niche endothelial cells promote matrix remodelling of the micro-niche.
a-d, Gene set enrichment analyses of ranked upregulated genes. NES, normalized enrichment score, p values were computed by permutation. n = 6 mice per group. a, Gene sets enriched in unlabelled total EC from 4T1-injected lungs compared to unlabelled total EC from D2.0R-injected lungs. b, Gene sets enriched in labelled EC from 4T1-injected lungs compared to matched unlabelled total EC. c, Gene sets enriched in labelled EC from D2.0R-injected lungs compared to matched unlabelled total EC. d, Gene sets enriched in labelled EC from 4T1-injected lungs compared to labelled EC from D2.0R-injected lungs. e, Expression of proliferative niche EC markers genes in individual capillary EC from the combined scRNAseq dataset (full set of filtered marker genes for all conditions are displayed in Supplementary Table 8). f, Gene scores for marker genes in e for individual EC from the combined scRNAseq dataset split by experimental timepoint. Dotted line indicates threshold of EC with niche gene score > 0.5. g, Localisation of predicted tumor cell-interacting EC in the capillary EC dataset split by timepoint. h, Presence of predicted tumor cell-interacting EC in control non-tumorous and primary lung tumor EC in a publicly available dataset (13,854 cells). i, Localisation of predicted tumor cell-interacting EC and biosynthetic EC identified in Extended Data Fig. 4 in the combined capillary EC dataset. j, Violin plot of biosynthesis gene scores in endothelial cells identified as proliferative niche EC (niche score > 0.5, red colour) and non-niche EC (niche score < 0.5, grey colour).
Extended Data Fig. 8
Extended Data Fig. 8. Wnt-agonistic treatment in vitro does not change cellular identity.
a, EMT- and Wnt-gene scores in CTC isolated from breast cancer patients in publicly available datasets. Left panels display 252 cells, right panels display 89 cells. b, Schematic of experiment. 4T1-GFP cells were pulse treated with CHIR99021 or vehicle control overnight prior to injection (left panel). Percentage of extravasated TC 1.5 days (mid panel) and percentage of TC with dye retention 3.5 days postinjection (right panel). Data are presented as mean values +/− s.d., p values were calculated by two-tailed t-test. n.s., not significant. c, Relative expression of key EMT-inducing transcription factors Klf4, Zeb1, Snai1 and Twist1 and canonical Wnt-downstream target Axin2 in 4T1 cells pulse-treated (over-night) or reprogrammed (two-week treatment) with Wnt-agonist CHIR99021 or d, SKL2001. Target gene expression was normalized to Actb and relative expression to respective controls was calculated using the 2-ΔΔCt-method. Data are presented as mean values +/− s.d., p value by two-tailed t-test are shown. n.s., not significant. * p value < 0.05, ** p value < 0.01, *** p value < 0.001, **** p value < 0.0001. Source data
Extended Data Fig. 9
Extended Data Fig. 9. Hypomethylation does not affect cellular fitness or homing capacity but limits metastatic outgrowth.
a, Representative flow cytometry gates for assessing cell viability of vehicle control treated (left panel), hypomethylated (mid panel) and UV irradiated positive control cells (right panel). b, Corresponding quantification of viable, early apoptotic, late apoptotic and necrotic vehicle control or overnight decitabine treated 4T1 cells Data are presented as mean values +/− s.d., p values were calculated by two-tailed t-test shown. n.s., not significant. n = 3 independent experiments. c, Representative images and quantifications of sDTC (left panels) and tumor cell clusters (right panels) in mice 3.5 days postinjection for Ctrl (two left images), and hypomethylated TC (two right images). For all images stacks of 12 µm were acquired and z-projections using maximum intensity are displayed. All images were acquired using 40X magnification. Panels display overlays of DAPI (cell nuclei, blue) and GFP (TC, green). Quantification shows cell cluster to sDTC ratios (left panel), which were calculated for each lung by summing cell clusters and sDTC across all analysed sections. Quantification in the middle displays ratios for each analysed slide (sum of two sections). Quantification on the right displays absolute counts per biological replicate for sDTC, tumor cell clusters and the combination of both. In order to adhere to the 3R principles, this experiment used the same controls and the same representative control images as the experiment presented in Extended Data Fig. 5h (see methods for specifications). n = 3 mice. d, Relative expression of key EMT-inducing transcription factors Klf4, Zeb1, Snai1 and Twist1 in 4T1 cells treated over-night with decitabine or vehicle control. Target gene expression was normalized to Actb and relative expression to respective controls was calculated using the 2-ΔΔCt-method. Data are presented as mean values +/− s.d., p value by two-tailed t-test is shown. ** p value < 0.01. n = 5 independent experiments. e, Schematic of experiment. 4T1-GFP control cells were mixed with overnight decitabine treated 4T1-mCherry cells in 1:1 ratio and injected into the tail vein of mice (left panel). Quantification of mCherry+ TC within the total TC pool at the timepoint of injection, 1.5 days and 7 days postinjection (right panel). Data are presented as mean values +/− s.d., p value by two-tailed t-test is shown. n = 6 mice. f-h, Cells were treated over-night with decitabine and metastatic burden was assessed 14 days postinjection for, f, 4T1-GFP cells (Balb/c mice) measuring tumor cell abundance per mg lung tissue, g, human MDA-MB-231-GFP breast cancer cells (NSG mice) measuring metastatic outgrowth calculated as fold change to day 1.5 injected control mice, and, h, B16F10 melanoma cells (in B6 mice), counting metastatic foci per lung. Representative images display whole metastatic lungs of mice injected with B16F10 control cells (upper image) or B16F10-hypo cells (lower image). Data are presented as mean values +/− s.d., p values by two-tailed t-test are shown. To adhere to the 3R principles, the experiment in panel f used the same control as the experiment presented in Fig. 2e (see methods for specifications). n = 6–9 mice. i, Box plots showing methylation level of CpGs included in the methyl array in 4T1, D2A1, 4T1-hypo and D2.0R cells. Black gradient below indicates metastatic capacity of the individual cell line, with 4T1 cells being the most aggressive and D2.0R cells being the least aggressive cell line. Size of box represents interquartile range (IQR), with midline representing the median of the data, upper line the upper quartile and lower line the lower quartile. Whiskers represent 1.5 times IQR. j, Scatter plot of methylation level for individual CpGs included in the methyl array comparing each cell line with each other. Red line indicates no differences in methylation, dotted red lines indicate thresholds for >10% differences in methylation. k, Metastatic outgrowth calculated as fold change to day 1.5 injected control mice of control D2A1 cells and D2A1 cells that were treated with decitabine overnight, or, l, for 36 hrs. Data are presented as mean values +/− s.d., p values by two-tailed t-test are shown. n = 4–6 mice. m, Total tumor cell abundance in mice 14 days postinjection with 4T1 control cells or 4T1 cells that were treated overnight or for 36hrs with decitabine. Representative images show whole metastatic lungs of mice injected with control cells (left panel), overnight treated cells (mid panel) and cells treated for 36hrs (right panel). Data are presented as mean values +/− s.d., p values by one-way ANOVA with Tukey post-test are shown. n = 6 mice. n, Schematic of experiment. 4T1-GFP cells were treated overnight with either decitabine (Hypo Ctrl) or decitabine and SKL2001 (Hypo G-O-F) and injected into the tail veins of mice. Quantification shows the percentage of extravasated TC 1.5 days postinjection and, o, the percentage of TC with dye retention 3.5 days postinjection. Data are presented as mean values +/− s.d., p values were calculated by two-tailed t-test. n.s., not significant. n = 5 mice. p, Proliferation coefficients were calculated as the ratio of CellTrace mean fluorescence intensity (MFI) at day 3.5 and average CellTrace MFI at day 1.5 from matched experiments for 4T1-GFP control cells (Ctrl), SKL2001 reprogrammed cells (Ctrl G-O-F), over-night decitabine treated cells (Hypo Ctrl) and over-night decitabine and SKL2001 treated cells (Hypo G-O-F). Low proliferation coefficients reflect high proliferation rate. Cells with dye retention were excluded from the analysis. Data are presented as mean values +/− s.d., p values were calculated by one-way ANOVA with Tukey post-test. n.s., not significant. n = 5 mice. Source data
Extended Data Fig. 10
Extended Data Fig. 10. Latent tumor cell hypomethylation in promoter sequences and gene bodies drives plasticity.
a, Boxplot reflecting the genome wide differential methylation level. Genome was binned in parts of 2000 bp. Methylation fractions were calculated for each bin by the ratio of methylated to total CpG island per bin. Methylation levels were assessed by subtracting the median methylation fraction of a bin across all samples from each individual bin. Red line indicates median methylation fraction of genomic bin. Black lines indicate median for each sample. Top and bottom of box show 25th and 75th percentile, respectively. Whiskers represent the 1.5 interquartile range. b, Scatter plot of methylation level (fraction of methylated CpG islands) for enhancer or c, promoters in latent TC and proliferative TC. Red line indicates no differences in methylation, dotted red lines indicate thresholds for >10% differences in methylation. d, Enriched GO-terms for hypomethylated genes in latent TC. k/K, overlap of queried gene list and GO-term associated genes. FDR, false discovery rate. p values were computed by permutation. e, Scored gene expression of genes linked to hypomethylated regulatory elements in latent tumor cells (as identified in panels b, c) (left panel) or gene bodies (Fig. 5g) (right panel) in the scRNAseq TC dataset split by cell clusters. f, Schematic of RNAseq experiment. Tumor cells were either treated with SKL2001 (Ctrl) or SKL2001 and decitabine (Hypo) overnight. PCA plot of sequencing results (right panel). n = 4 replicates. g, Row normalized and row clustered heatmap of differentially expressed genes between Ctrl and Hypo samples. Genes were considered significantly regulated for log 2 fold changes > 0.58 and adjusted p value < 0.05. p values were computed in DESeq2 using Wald test. h, Bar plot displaying number of upregulated genes for each treatment group (full set of DEG is displayed in Supplementary Table 9). i, Scored gene expression of Hypo gene signature from the RNAseq experiment in the scRNAseq dataset split by cell clusters.

References

    1. Risson E, Nobre AR, Maguer-Satta V, Aguirre-Ghiso JA. The current paradigm and challenges ahead for the dormancy of disseminated tumor cells. Nat. Cancer. 2020;1:672–680. - PMC - PubMed
    1. Polzer B, Klein CA. Metastasis awakening: the challenges of targeting minimal residual cancer. Nat. Med. 2013;19:274–275. - PubMed
    1. Labelle M, Hynes RO. The initial hours of metastasis: the importance of cooperative host–tumor cell interactions during hematogenous dissemination. Cancer Discov. 2012;2:1091–1099. - PMC - PubMed
    1. Ghajar CM. Metastasis prevention by targeting the dormant niche. Nat. Rev. Cancer. 2015;15:238–247. - PMC - PubMed
    1. Hüsemann Y, et al. Systemic spread is an early step in breast cancer. Cancer Cell. 2008;13:58–68. - PubMed

Publication types