

CIRI-Deep Enables Single-Cell and Spatial Transcriptomic Analysis of Circular RNAs with Deep Learning
- PMID: 38308181
- PMCID: PMC11005702
- DOI: 10.1002/advs.202308115
CIRI-Deep Enables Single-Cell and Spatial Transcriptomic Analysis of Circular RNAs with Deep Learning
Abstract
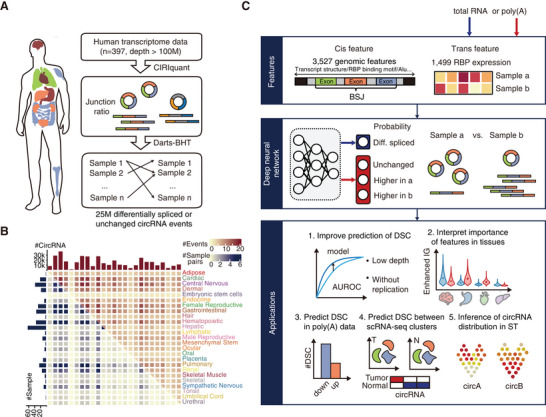
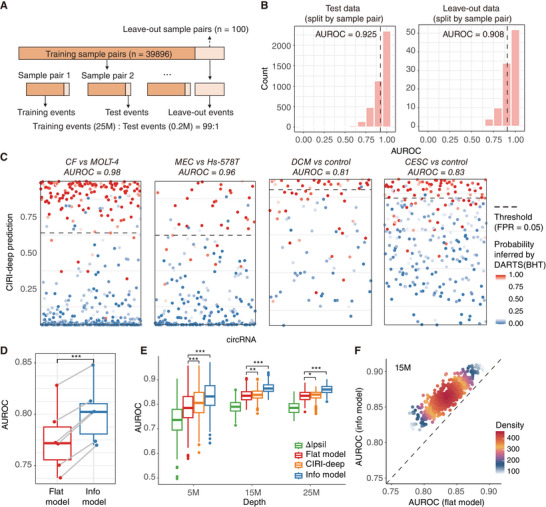
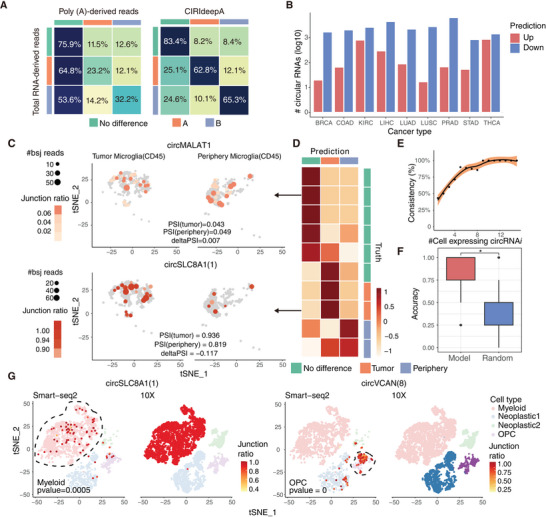
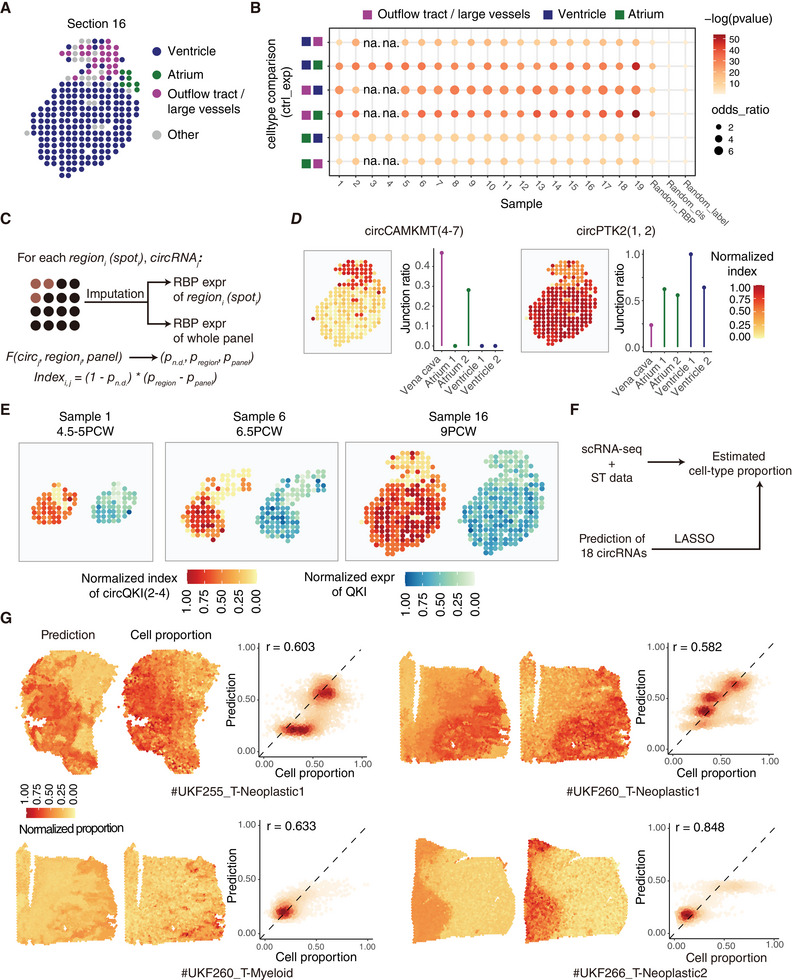
Circular RNAs (circRNAs) are a crucial yet relatively unexplored class of transcripts known for their tissue- and cell-type-specific expression patterns. Despite the advances in single-cell and spatial transcriptomics, these technologies face difficulties in effectively profiling circRNAs due to inherent limitations in circRNA sequencing efficiency. To address this gap, a deep learning model, CIRI-deep, is presented for comprehensive prediction of circRNA regulation on diverse types of RNA-seq data. CIRI-deep is trained on an extensive dataset of 25 million high-confidence circRNA regulation events and achieved high performances on both test and leave-out data, ensuring its accuracy in inferring differential events from RNA-seq data. It is demonstrated that CIRI-deep and its adapted version enable various circRNA analyses, including cluster- or region-specific circRNA detection, BSJ ratio map visualization, and trans and cis feature importance evaluation. Collectively, CIRI-deep's adaptability extends to all major types of RNA-seq datasets including single-cell and spatial transcriptomic data, which will undoubtedly broaden the horizons of circRNA research.
Keywords: circular RNA; deep learning; single cell RNA‐seq; spatial transcriptome; splicing.
© 2024 The Authors. Advanced Science published by Wiley‐VCH GmbH.
Conflict of interest statement
The authors declare no conflict of interest.
Figures

Similar articles
-
Visualization of circular RNAs and their internal splicing events from transcriptomic data.Bioinformatics. 2020 May 1;36(9):2934-2935. doi: 10.1093/bioinformatics/btaa033. Bioinformatics. 2020. PMID: 31950978
-
Analysis of pig transcriptomes suggests a global regulation mechanism enabling temporary bursts of circular RNAs.RNA Biol. 2019 Sep;16(9):1190-1204. doi: 10.1080/15476286.2019.1621621. Epub 2019 Jun 3. RNA Biol. 2019. PMID: 31120323 Free PMC article.
-
Comprehensive profiling of circular RNAs with nanopore sequencing and CIRI-long.Nat Biotechnol. 2021 Jul;39(7):836-845. doi: 10.1038/s41587-021-00842-6. Epub 2021 Mar 11. Nat Biotechnol. 2021. PMID: 33707777
-
Circular RNA discovery with emerging sequencing and deep learning technologies.Nat Genet. 2025 May;57(5):1089-1102. doi: 10.1038/s41588-025-02157-7. Epub 2025 Apr 17. Nat Genet. 2025. PMID: 40247051 Review.
-
Approaches and challenges in genome-wide circular RNA identification and quantification.Trends Genet. 2023 Dec;39(12):897-907. doi: 10.1016/j.tig.2023.09.006. Epub 2023 Oct 13. Trends Genet. 2023. PMID: 37839990 Review.
Cited by
-
Global dysregulation of circular RNAs in frontal cortex and whole blood from DM1 and DM2.Hum Genet. 2025 Apr;144(4):417-432. doi: 10.1007/s00439-025-02729-x. Epub 2025 Feb 4. Hum Genet. 2025. PMID: 39903274 Free PMC article.
-
circRNAs as Epigenetic Regulators of Integrity in Blood-Brain Barrier Architecture: Mechanisms and Therapeutic Strategies in Multiple Sclerosis.Cells. 2024 Aug 6;13(16):1316. doi: 10.3390/cells13161316. Cells. 2024. PMID: 39195206 Free PMC article. Review.
-
Mitigating Cellular Dysfunction Through Contaminant Reduction in Synthetic circRNA for High-Efficiency mRNA-Based Cell Reprogramming.Adv Sci (Weinh). 2025 Apr;12(16):e2416629. doi: 10.1002/advs.202416629. Epub 2025 Mar 5. Adv Sci (Weinh). 2025. PMID: 40042035 Free PMC article.
-
Genome-wide profiling and functional characterization of circular RNAs in neural development and injury: insights from a rat model research.Cell Mol Life Sci. 2025 Apr 1;82(1):135. doi: 10.1007/s00018-025-05665-1. Cell Mol Life Sci. 2025. PMID: 40169448 Free PMC article.
-
Past, present, and future strategies for detecting and quantifying circular RNA variants.FEBS J. 2025 Aug;292(16):4073-4085. doi: 10.1111/febs.70012. Epub 2025 Feb 11. FEBS J. 2025. PMID: 39934961 Free PMC article. Review.
References
-
- a) Memczak S., Jens M., Elefsinioti A., Torti F., Krueger J., Rybak A., Maier L., Mackowiak S. D., Gregersen L. H., Munschauer M., Loewer A., Ziebold U., Landthaler M., Kocks C., le Noble F., Rajewsky N., Nature 2013, 495, 333; - PubMed
- b) Salzman J., Gawad C., Wang P. L., Lacayo N., Brown P. O., PLoS One 2012, 7, e30733. - PMC - PubMed
-
- a) Du W. W., Yang W., Liu E., Yang Z., Dhaliwal P., Yang B. B., Nucleic Acids Res. 2016, 44, 2846; - PMC - PubMed
- b) Legnini I., Di Timoteo G., Rossi F., Morlando M., Briganti F., Sthandier O., Fatica A., Santini T., Andronache A., Wade M., Laneve P., Rajewsky N., Bozzoni I., Mol. Cell 2017, 66, 22. - PMC - PubMed
-
- a) Conn S. J., Pillman K. A., Toubia J., Conn V. M., Salmanidis M., Phillips C. A., Roslan S., Schreiber A. W., Gregory P. A., Goodall G. J., Cell 2015, 160, 1125; - PubMed
- b) Meng J., Chen S., Han J. X., Qian B., Wang X. R., Zhong W. L., Qin Y., Zhang H., Gao W. F., Lei Y. Y., Yang W., Yang L., Zhang C., Liu H. J., Liu Y. R., Zhou H. G., Sun T., Yang C., Cancer Res. 2018, 78, 4150; - PubMed
- c) Piwecka M., Glazar P., Hernandez‐Miranda L. R., Memczak S., Wolf S. A., Rybak‐Wolf A., Filipchyk A., Klironomos F., Cerda Jara C. A., Fenske P., Trimbuch T., Zywitza V., Plass M., Schreyer L., Ayoub S., Kocks C., Kuhn R., Rosenmund C., Birchmeier C., Rajewsky N., Science 2017, 357; - PubMed
- d) Chen L. L., Nat. Rev. Mol. Cell Biol. 2020, 21, 475. - PubMed
-
- Starke S., Jost I., Rossbach O., Schneider T., Schreiner S., Hung L. H., Bindereif A., Cell Rep. 2015, 10, 103. - PubMed
MeSH terms
Substances
Grants and funding
LinkOut - more resources
Full Text Sources
Miscellaneous