. 2024 Apr;11(14):e2306827.
doi: 10.1002/advs.202306827. Epub 2024 Feb 2.

CSN6-SPOP-HMGCS1 Axis Promotes Hepatocellular Carcinoma Progression via YAP1 Activation

Affiliations

CSN6-SPOP-HMGCS1 Axis Promotes Hepatocellular Carcinoma Progression via YAP1 Activation

Kai Li et al. Adv Sci (Weinh). 2024 Apr.

Abstract

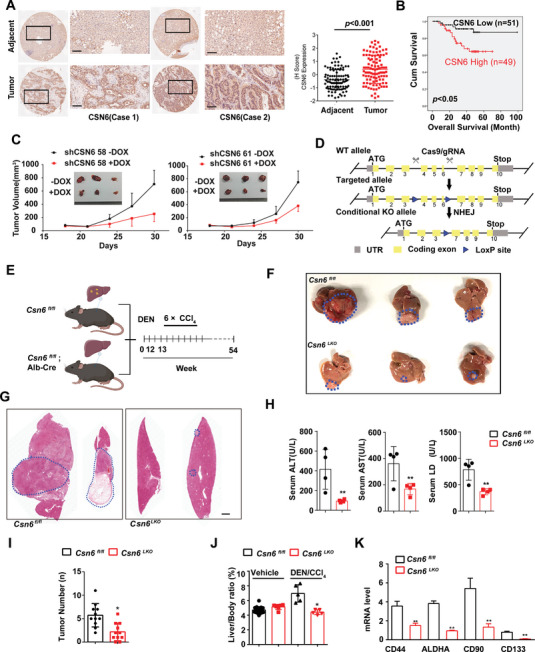
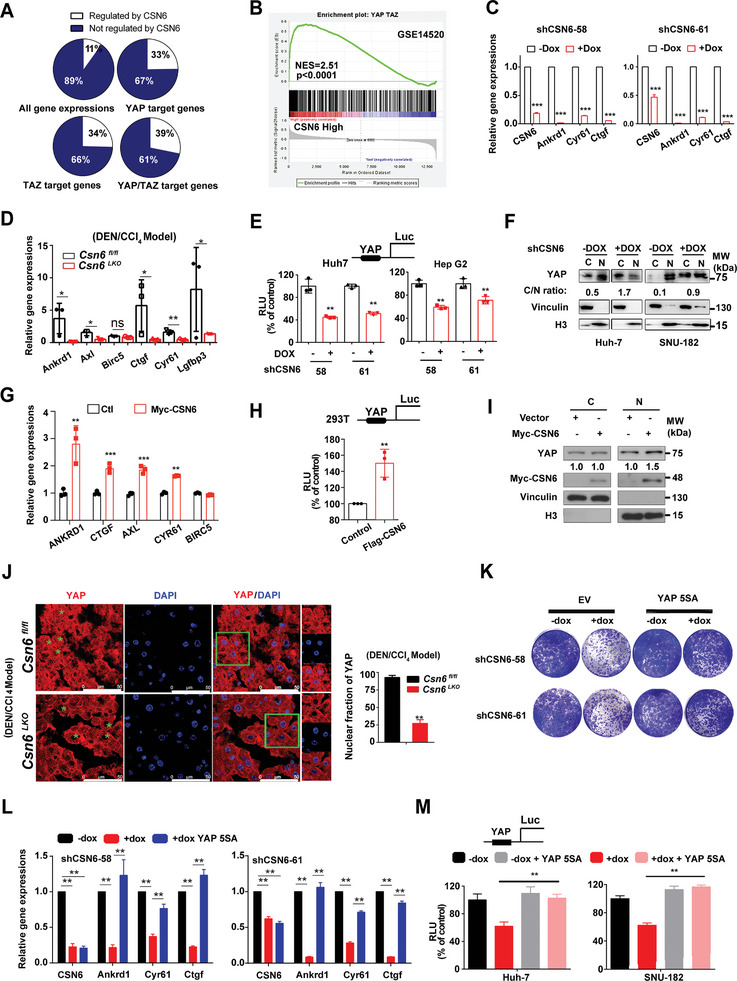
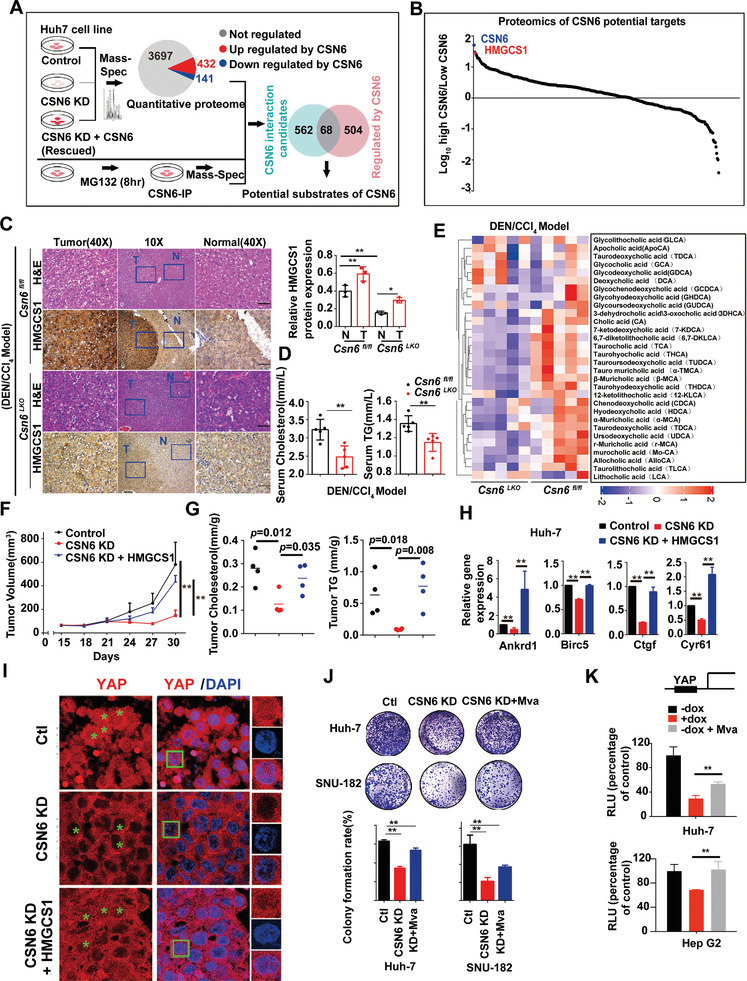
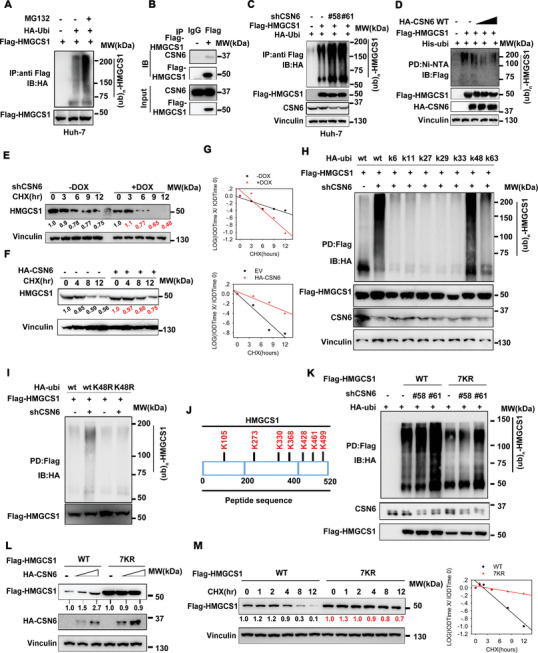
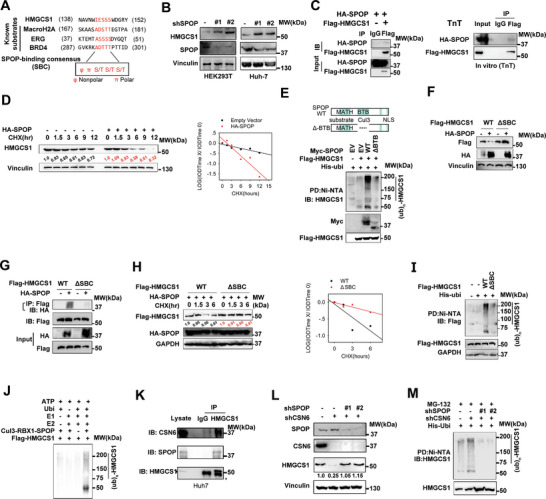
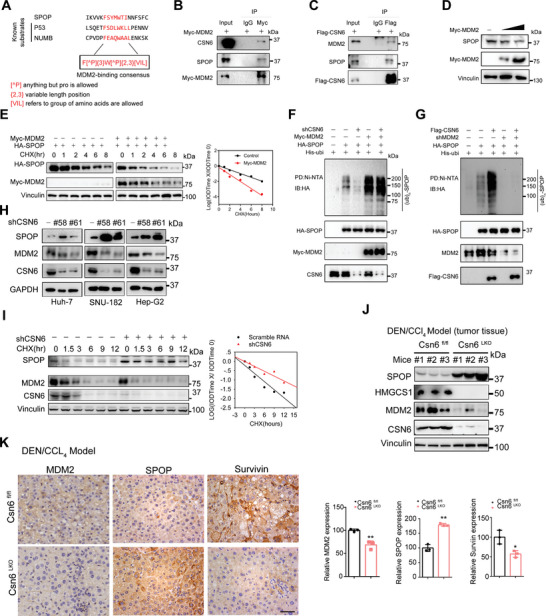
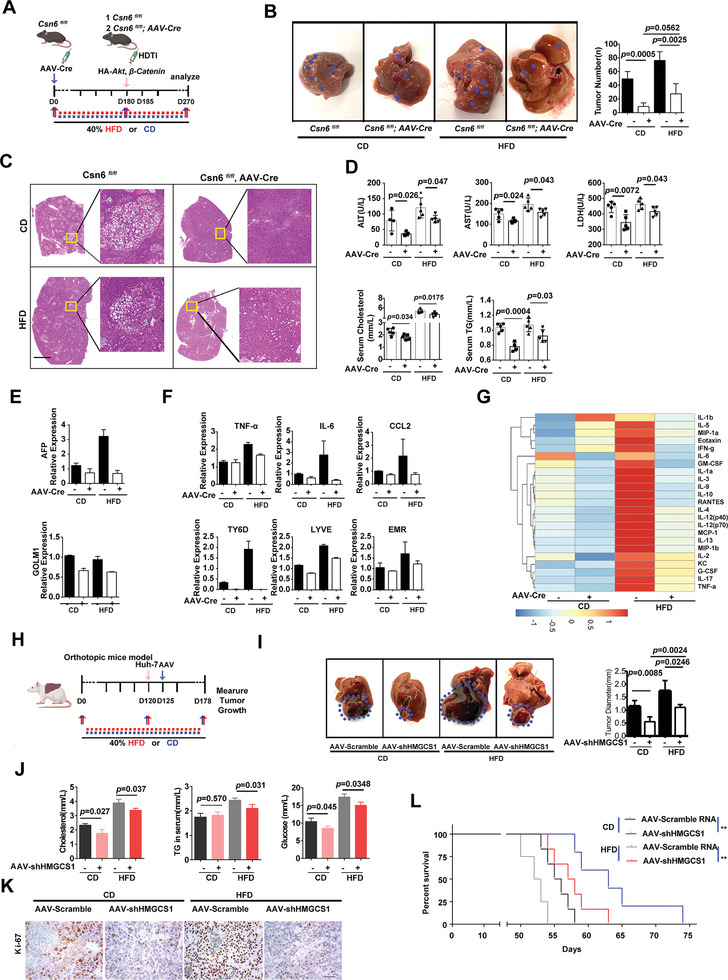
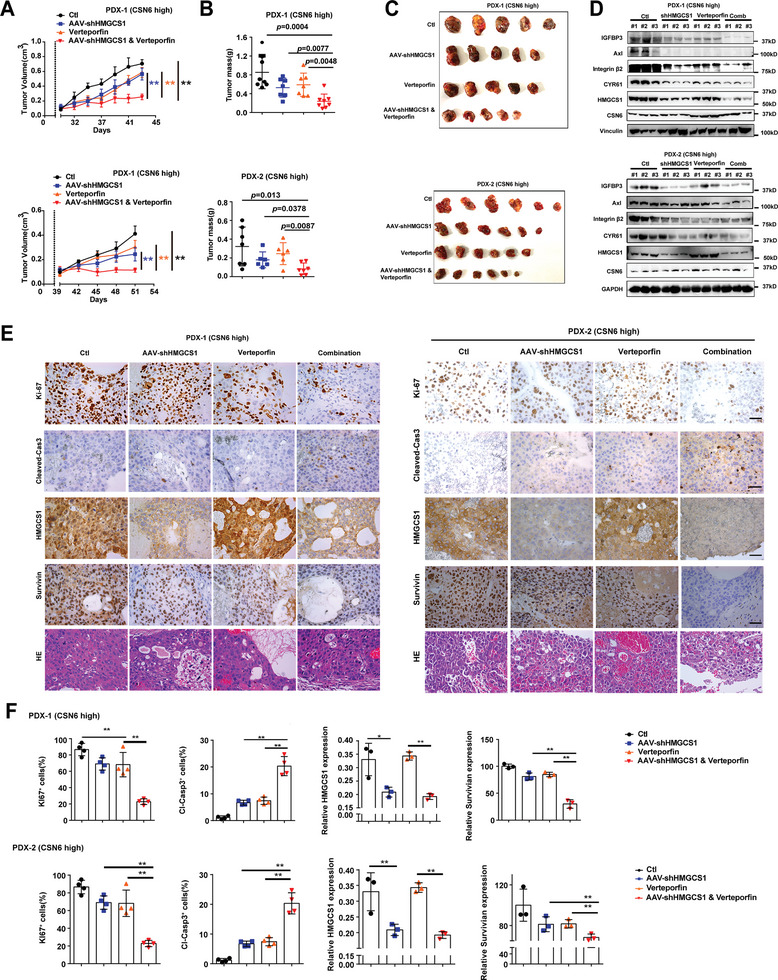
Cholesterol metabolism has important roles in maintaining membrane integrity and countering the development of diseases such as obesity and cancers. Cancer cells sustain cholesterol biogenesis for their proliferation and microenvironment reprograming even when sterols are abundant. However, efficacy of targeting cholesterol metabolism for cancer treatment is always compromised. Here it is shown that CSN6 is elevated in HCC and is a positive regulator of hydroxymethylglutaryl-CoA synthase 1 (HMGCS1) of mevalonate (MVA) pathway to promote tumorigenesis. Mechanistically, CSN6 antagonizes speckle-type POZ protein (SPOP) ubiquitin ligase to stabilize HMGCS1, which in turn activates YAP1 to promote tumor growth. In orthotopic liver cancer models, targeting CSN6 and HMGCS1 hinders tumor growth in both normal and high fat diet. Significantly, HMGCS1 depletion improves YAP inhibitor efficacy in patient derived xenograft models. The results identify a CSN6-HMGCS1-YAP1 axis mediating tumor outgrowth in HCC and propose a therapeutic strategy of targeting non-alcoholic fatty liver diseases- associated HCC.

Keywords: HFD; YAP1; cholesterol metabolism; hepatocellular carcinoma(HCC).


Conflict of interest statement

The authors declare no conflict of interest.

Figures

Figure 1
Figure 1
CSN6 promotes HCC growth and correlates with poor survival. A) Representative image of CSN6 IHC staining in human liver cancer and adjacent normal liver tissue. Scale bars, 100 µm. Quantitative CSN6 expression was shown in paired HCC tissue and adjacent normal tissue (right panel). Data are presented as mean ± SD. B) Kaplan‐Meier survival curves of overall survival duration based on CSN6 expression in human HCC tissue microarray. C) Impact of DOX‐induced shCSN6 on tumor growth of Huh‐7 xenograft tumors. Tumor volume was measured. The data are presented as the means ± s.d. n = 5; **, p < 0.01. D) Schematic depiction of generating Csn6 conditional knockout (KO) mouse model. E) Time line of AlbCre mediated liver‐specific Csn6 knockout (KO) mouse treated with DEN/CCl4 treatment. Csn6 fl/fl mice (n = 10) and Csn6 LKOmice (CSN6LKO, n = 10) were injected with DEN (100 mg kg−1, i.p.) at the age of 12 weeks followed by six injections of CCl4 (0.5 mL kg−1, i.p.) and sacrificed 12.5 months after DEN. Scale bar, 2 mm. F) Gross morphology of DEN/CCl4‐challenged Csn6 fl/fl and Csn6 LKO mice. G) H&E staining of DEN/CCl4‐challenged Csn6 fl/fl and Csn6 LKO mice. H) Serum level of ALT, AST, and LDH from indicated mice was measured after DEN/CCl4 treatment. **, p < 0.01. I) Tumor number from indicated mice were determined. *, p < 0.05; **, p <0 .01. J) Liver body ratios from indicated mice were determined. *, p < 0.05. K) Liver cancer marker genes were determined by qPCR. n = 3; **, p < 0.01.
Figure 2
Figure 2
CSN6 promotes YAP1 transcriptional activity. A) 33%–39% of genes activated by YAP/TAZ are also regulated by CSN6. Huh7 cell line was infected with DOX‐inducible shCSN6 RNA. RNA‐seq was performed. B) Gene set enrichment analysis (GSEA) of GSE14520. GSEA plot of YAP signaling pathway signature correlated with CSN6 high related genes. NES, normalized enrichment score. C) CSN6 KD led to decreased gene expression of YAP targets. qPCR was performed for indicated genes in CSN6 KD Huh‐7 cell line. n = 3; ***, p < 0.001. D) Relative gene expression of YAP1 targets in liver tissues of Csn6 fl/fl and Csn6 LKOmice. *, p < 0.05; **, p < 0.01; ns, not significant. E) Silencing CSN6 decreased YAP transcriptional activity with luciferase reporter gene assay (8XGTII‐lux). Luciferase activity assay of YAP in DOX‐induced KD of CSN6 in indicated cancer cell lines. Cells were transfected with vector or 8XGTII‐lux. RLU, Relative Luciferase Units. *, p < 0.05; **, p < 0.01; n = 3. F) Nuclear fraction assay of YAP1 shows silencing CSN6 increased YAP1 translocation from the nucleus to the cytoplasm. G) CSN6 overexpression led to increased gene expression of YAP targets in MHCC‐97H cell line. **, p < 0.01; ***, p < 0.001; n = 3. H) CSN6 overexpression enhanced YAP transcriptional activity with luciferase reporter gene assay (8XGTII‐lux). **, p < 0.01; n = 3. I) Nuclear fraction assay of YAP1 shows that CSN6 overexpression increased YAP1 translocation from the cytoplasm to the nucleus. J) Immunofluorescence staining of YAP1 in liver tissues from DEN/CCl4‐treated Csn6 fl/fl and Csn6 LKO mice. Percentage of YAP1 nuclear localization was quantitated. K–M) CSN6 KD attenuated colony formation, YAP1 target expression, and YAP1 transcriptional activities. YAP‐5SA overexpression reversed these effects caused by CSN6 KD.
Figure 3
Figure 3
CSN6 promotes YAP1 activation through HMGCS1 mediated mevalonate metabolism. A) A two‐step screen strategy identified CSN6 substrate in liver cancer. Huh7 cells were transduced with DOX‐inducible shCSN6 or CSN6 rescued lentivirus. CSN6 protein was also immunoprecipitated in the presence of MG132 for 8 h. Mass‐spectrometry was performed to identify CSN6 regulated proteins and associated proteins. B) CSN6 direct substrates were identified in liver cancer by proteomics. The target proteins were ranked according to DEGs (differently expressed genes) regulated by CSN6. Each dot represents one candidate protein. C) H&E staining and immunohistochemistry analysis of HMGCS1 expression level in liver tissues of DEN/CCl4‐treated Csn6 fl/fl and Csn6 fl/fl; Alb‐Cre (Csn6 LKO) mice. Area of tumor and adjacent normal tissue was noted. Scale bar, 50 µm. Quantification of HMGCS1 expression level was shown on the right panel. *, p < 0.05; **, p < 0.01; n = 3. D) Levels of cholesterol and triglycerides (TG) in serum of DEN/CCl4‐treated Csn6 fl/fl and Csn6 LKO mice were measured. **, p < 0.01; n = 3. E) Levels of various BA measured in livers of Csn6 fl/fl and Csn6 LKO mice after DEN/CCl4 treatment was presented as a heat map. F) Tumor growth curves of Huh‐7 (1 × 106) liver cancer cells transfected with indicated constructs. Cells were subcutaneously injected into nude mice (n = 5). Tumors were collected at the end of the experiments. **, p < 0.01. G) Cholesterol and TG of tumor tissues were measured. H) YAP target genes of tumor tissues were measured. **, p < 0.01. I) Immunofluorescence staining of YAP1 in tumors were presented. HMGCS1 increased YAP1 nuclear translocation in the presence of CSN6 KD. Scale bar, 50 µm. J) CSN6 KD attenuated colony formation and mevalonate(Mva) reversed the effects caused by CSN6 KD. **, p < 0.01; n = 3. K) CSN6 KD attenuated YAP1 transcriptional activities. Mevalonate (Mva) reversed the effects caused by CSN6 KD. **, p < 0.01; n = 3.
Figure 4
Figure 4
CSN6 attenuates K48‐mediated HMGCS1 ubiquitination. A) Poly‐ubiquitination assay of HMGCS1. Immunoblot analysis of poly‐ubiquitinated HMGCS1 in 293T cells transfected with the indicated constructs and treated with MG132 for 6 h. B) Immunoblot analysis of the indicated proteins from immunoprecipitates (IP) obtained from 293T cells with MG132 treatment for 6 h. CSN6 associated with HMGCS1. C) CSN6 KD increased HMGCS1 poly‐ubiquitination in 293T cells. Immunoblot analysis of poly‐ubiquitinated HMGCS1 in 293T cells transfected with the indicated constructs and treated with MG132 for 6 h. D) CSN6 enhanced HMGCS1 poly‐ubiquitination in a dose‐dependent manner. Cells transfected with indicated constructs were treated with MG132 (10 × 10‐6 m) 6 h before harvest. The cell lysates were pulled down (PD) with nickel beads (Ni‐NTA) and immunoblotted with indicated antibodies. E,F) CSN6 overexpression decreased HMGCS1 protein turnover rates. CSN6 KD accelerated HMGCS1 protein turnover rate. Representative immunoblots showing HMGCS1 protein turnover rate in cells treated with cycloheximide (CHX, 60 µg mL‐1), in the presence or absence of CSN6 (Top). G) Quantification data were shown. IOD, integrated optical density. The relative density of CSN6 was normalized to Vinculin and then normalized to the t = 0 control. H,I) CSN6 KD enhanced HMGCS1 K48‐linked ubiquitination. Cells transfected with indicated constructs were treated with MG132 (10 × 10‐6 m) 6 h before harvest. The cell lysates were pulled down (PD) with M2 beads and immunoblotted with indicated antibodies. J) The predicted ubiquitination sites of HMGCS1 protein. K) HMGCS1‐7KR mutant is resistant to ubiquitination. Cells transfected with indicated constructs were treated with MG132 (10 × 10‐6 m) 6 h before harvest. The cell lysates were pulled down (PD) with M2 beads and immunoblotted with indicated antibodies. L) The HMGCS1‐7KR mutant is more stable than HMGCS1‐WT in the presence of CSN6 based on steady‐state expression studies. M Representative immunoblots showing HMGCS1 7KR mutant protein turnover rate in 293T cells. The HMGCS1 7KR mutant has a slower turnover rate.
Figure 5
Figure 5
SPOP is involved in HMGCS1 dysregulation. A) Amino acid sequence alignment of putative SPOP binding consensus (SBC) motifs in HMGCS1. MacroH2A, ERG and BRD4 are known SPOP substrates containing well‐characterized SBC motifs. B) SPOP KD increased HMGCS1 steady‐state expression in 293T and Huh‐7 cell line. C) Immunoblot analysis of immunoprecipitates obtained from 293T cells transfected with indicated constructs and treated with MG132 for 6 h (left panel). HMGCS1 interacts with SPOP in vitro (right panel). Indicated constructs were transcribed and translated using TnT kit. Protein‐protein interaction was assayed by co‐IP experiments using indicated antibodies. HMGCS1 interacts with SPOP. D) Representative immunoblots showing HMGCS1 protein turnover rate in 293T cells treated with CHX, in the presence of SPOP. SPOP overexpression increased the turnover rate of HMGCS1. E) Immunoblot analysis of HMGCS1 ubiquitination from 293T cells transfected with the indicated constructs and treated with MG132 for 6 h. F) Immunoblots showing HMGCS1 steady‐state expression in indicated 293T cells transfected with HMGCS1‐ΔSBC. HMGCS1‐ΔSBC is resistant to SPOP‐mediated degradation. G) HMGCS1‐WT, but not HMGCS1‐ΔSBC, interacts with SPOP based on IP assay. H) SPOP overexpression cannot increase HMGCS1‐ΔSBC protein turnover rates in 293T cells with CHX treatment. I) HMGCS1‐ΔSBC is resistant to poly‐ubiquitination assayed by ubiquitination assay. J) Immunoblot of HMGCS1 poly‐ubiquitination in an in vitro ubiquitination assay by the CUL3‐RBX1‐SPOP E3 ligase complex. K) HMGCS1 interacts with SPOP and CSN6 in liver cancer cell. Immunoblot analysis of the indicated proteins from immunoprecipitates obtained from Huh‐7 cells treated with MG132 for 6 h. L) CSN6 KD led to reduced HMGCS1 steady‐state expression via upregulating SPOP. Immunoblot analysis of indicated proteins in 293T cells transfected with the indicated constructs. M) CSN6 KD‐mediated increased ubiquitination of HMGCS1 is SPOP‐dependent. Immunoblot analysis of poly‐ubiquitinated HMGCS1 in 293T cells transfected with the indicated constructs and treated with MG132 for 6 h.
Figure 6
Figure 6
CSN6‐MDM2‐SPOP axis is involved in HMGCS1 dysregulation. A) Amino acid sequence alignment of putative MDM2 binding consensus motifs in SPOP. P53 and NUMB are known MDM2 substrates containing well‐characterized consensus motifs. B) Protein–protein interaction was assayed by co‐IP experiments using indicated antibodies. MDM2 interacts with CSN6 and SPOP. C) Protein‐protein interaction was assayed by co‐IP experiments using indicated antibodies. CSN6 interacts with MDM2 and SPOP. D) MDM2 overexpression decreases SPOP expression. E) Representative immunoblots showing SPOP protein turnover rate in 293T cells treated with CHX, in the presence of MDM2. MDM2 overexpression increased the turnover rate of SPOP. F,G) Immunoblot analysis of SPOP ubiquitination from 293T cells transfected with the indicated constructs and treated with MG132 for 6 h. H) Representative immunoblots showing SPOP and MDM2 expression in cancer cells transfected with shCSN6. Silencing CSN6 increased SPOP steady‐state expression in liver cancer cell lines. I) Representative immunoblots showing SPOP and MDM2 protein turnover rate in 293T cells treated with CHX (left), in the presence of shCSN6. Silencing CSN6 decreased SPOP protein turnover rates. J) Immunoblot analysis of indicated proteins in liver tissues of Csn6 fl/fl and Csn6 LKO mice. K) CSN6 depletion leads to decreased MDM2 expression and increased SPOP protein expression. Scale bar, 50 µm. *, p < 0.05; **, p < 0.01; n = 3.
Figure 7
Figure 7
Activated CSN6‐HMGCS1 signaling provides vulnerability for HFD‐induced liver tumor growth. A) Schematic depiction of generating liver‐specific Csn6 LKO (HDTI) mice employing hydrodynamic tail vein injection (HDTI) strategy. Mice were grouped into CD and HFD based on diet feeding. CD, control diet; HFD, high fat diet. AAV‐Cre; AAV8‐Cre recombinase. B) Representative macroscopic photographs of livers with tumor growth in indicated groups. Arrow heads indicate tumor nodules of HCC. The average liver tumor numbers in each group were shown. C) Representative H&E staining of liver tissues in indicated groups. Scale bar, 2 mm. D) Quantification of serum cholesterol, TG, ALT, AST and LDH in each group of mice. E) qPCR quantification of mRNA of indicated HCC markers in tumor tissues. *, p < 0.05; **, p < 0.01; n = 3. F qPCR quantification of mRNA of indicated inflammatory target genes in tumor tissues. *, p < 0.05; **, p < 0.01; ns, not significant; n = 3. G) Cytokine array screening of the serum from indicated group of mice by luminex technology (Plex pro mouse Cytokine). The cytokine levels were presented as a heat map. H) Schematic depiction of generating orthotopic liver cancer model using Huh‐7 cells infected with AAV‐shHMGCS1 under CD or HFD conditions. I) Representative macroscopic photographs of liver with tumor growth in indicated group from orthotopic Huh‐7 liver cancer model. The average liver tumor diameter was shown. J) Quantification of serum cholesterol, TG, and glucose in indicated groups of mice from orthotopic Huh‐7 liver cancer model. K) Representative Ki‐67 staining from AAV‐shHMGCS1 treated Huh‐7 orthotopic cancer model. Scale bar, 50 µm. L) Survival curve generated from indicated orthotopic Huh‐7 liver cancer model. **, p < 0.01.
Figure 8
Figure 8
Targeting HMGCS1‐YAP1 axis suppresses HCC growth. A) Combination targeting YAP1 and HMGCS1 inhibits tumor growth in PDX (patient derived xenograft) models. Human liver cancer tissues were grown as tumor xenografts in NCG mice. Growth curves demonstrate the proliferation of PDX tumors in each indicated treatment group: AAV‐shHMGCS1(1 × 1012 v g mL‐1, 5 µL), verteporfin (100 mg kg−1 per day, I.P.), or a combination of both. Data are presented as mean ± SD. **, p < 0.01. B) Tumor mass was measured for each group. C) Representative Images of the PDX tumors were harvested at the end of the experiment. D) Immunoblot analysis of protein levels of IGFBP3, Axl, Integrin β2, CYR61, HMGCS1 and CSN6 in the PDX tumor tissues. E) Representative IHC images of Ki‐67, cleaved‐Caspase3, HMGCS1, survivin and HE staining in PDX tumors from the indicated treatment groups were shown. Scale bars, 50 µm. F) Quantification of the indicated protein expressions was shown. **, p < 0.01; n = 3.

References

    1. Llovet J. M., Pinyol R., Kelley R. K., El‐Khoueiry A., Reeves H. L., Wang X. W., Gores G. J., Villanueva A., Nat. Cancer 2022, 3, 386. - PMC - PubMed
    1. Aizarani N., Saviano A., Sagar, L. M. , Durand S., Herman J. S., Pessaux P., Baumert T. F., Grun D., Nature 2019, 572, 199. - PMC - PubMed
    1. Kettner N. M., Voicu H., Finegold M. J., Coarfa C., Sreekumar A., Putluri N., Katchy C. A., Lee C., Moore D. D., Fu L., Cancer Cell 2016, 30, 909. - PMC - PubMed
    1. a) Luo J., Yang H., Song B. L., Nat. Rev. Mol. Cell Biol. 2020, 21, 225; - PubMed
    2. b) Cao Z., Fan‐Minogue H., Bellovin D. I., Yevtodiyenko A., Arzeno J., Yang Q., Gambhir S. S., Felsher D. W., Cancer Res. 2011, 71, 2286; - PMC - PubMed
    3. c) Lei K., Kurum A., Kaynak M., Bonati L., Han Y., Cencen V., Gao M., Xie Y. Q., Guo Y., Hannebelle M. T. M., Wu Y., Zhou G., Guo M., Fantner G. E., Sakar M. S., Tang L., Nat. Biomed. Eng. 2021, 5, 1411; - PMC - PubMed
    4. d) Liao P., Wang W., Wang W., Kryczek I., Li X., Bian Y., Sell A., Wei S., Grove S., Johnson J. K., Kennedy P. D., Gijon M., Shah Y. M., Zou W., Cancer Cell 2022, 40, 365. - PMC - PubMed
    1. a) Lu X. Y., Shi X. J., Hu A., Wang J. Q., Ding Y., Jiang W., Sun M., Zhao X., Luo J., Qi W., Song B. L., Nature 2020, 588, 479; - PubMed
    2. b) Goldstein J. L., Brown M. S., Cell 2015, 161, 161. - PMC - PubMed

MeSH terms