. 2024 Apr;11(14):e2303177.
doi: 10.1002/advs.202303177. Epub 2024 Feb 2.

NAMPT-Driven M2 Polarization of Tumor-Associated Macrophages Leads to an Immunosuppressive Microenvironment in Colorectal Cancer

Affiliations

NAMPT-Driven M2 Polarization of Tumor-Associated Macrophages Leads to an Immunosuppressive Microenvironment in Colorectal Cancer

Sun Mi Hong et al. Adv Sci (Weinh). 2024 Apr.

Abstract

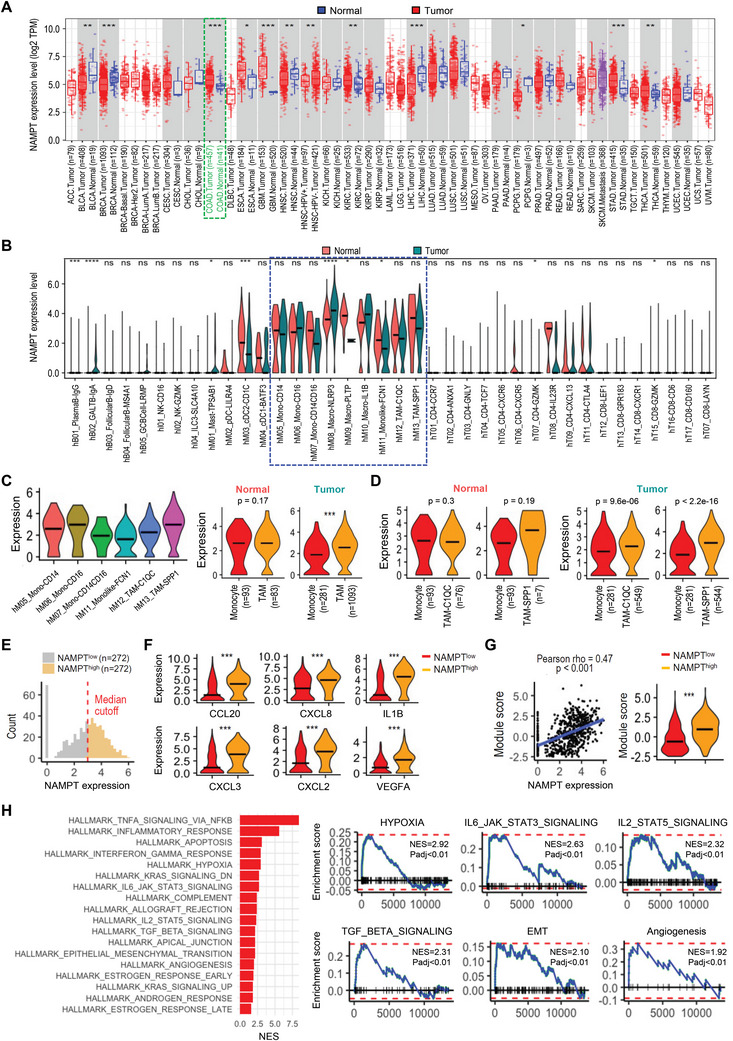
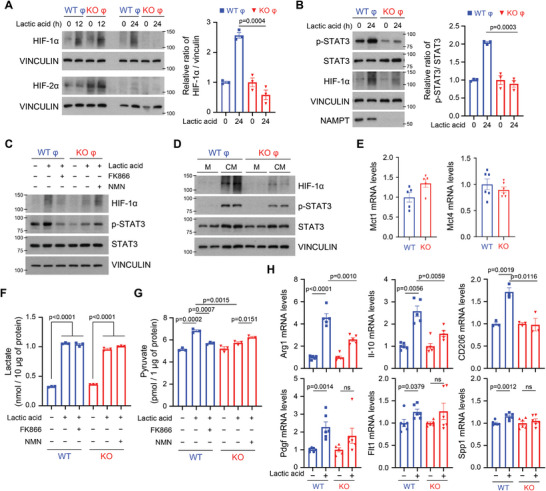
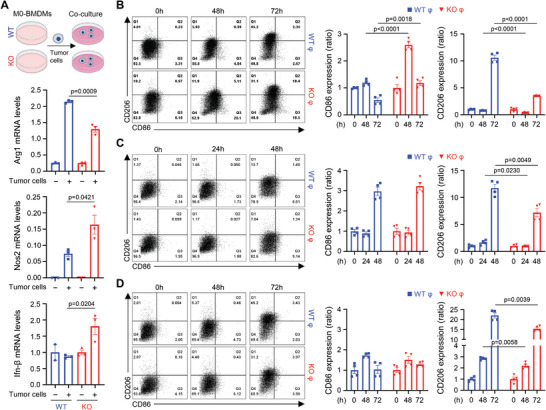
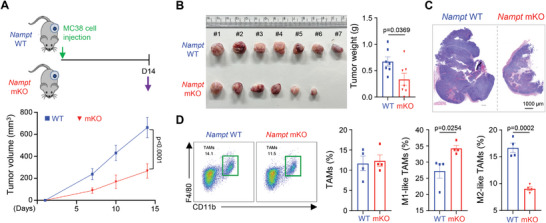
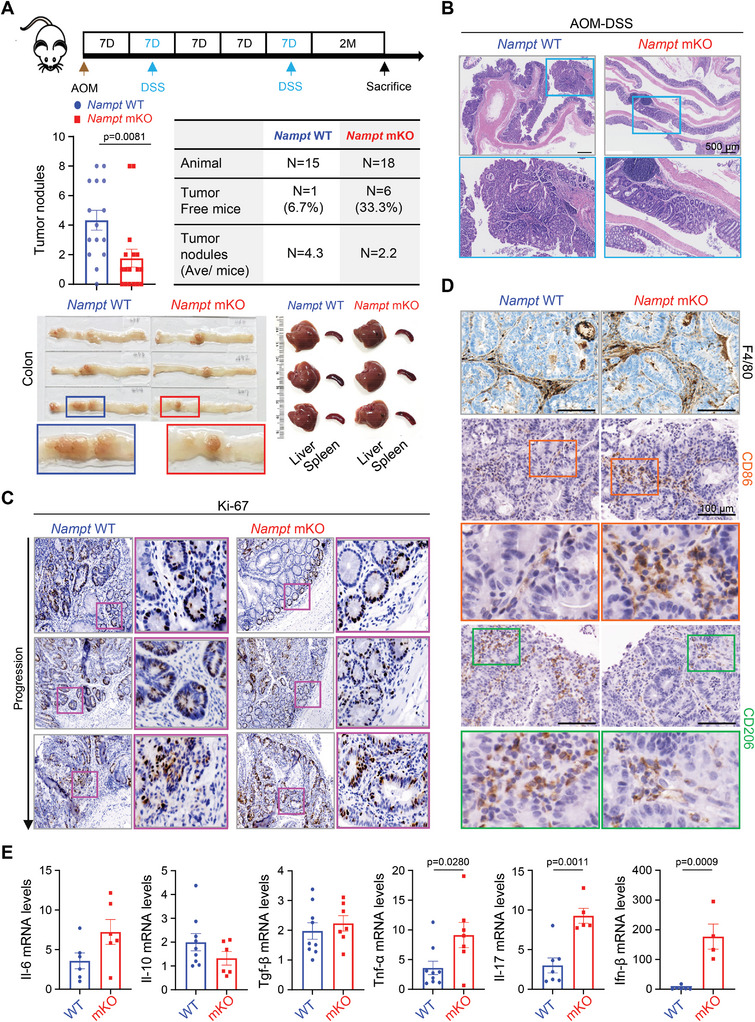
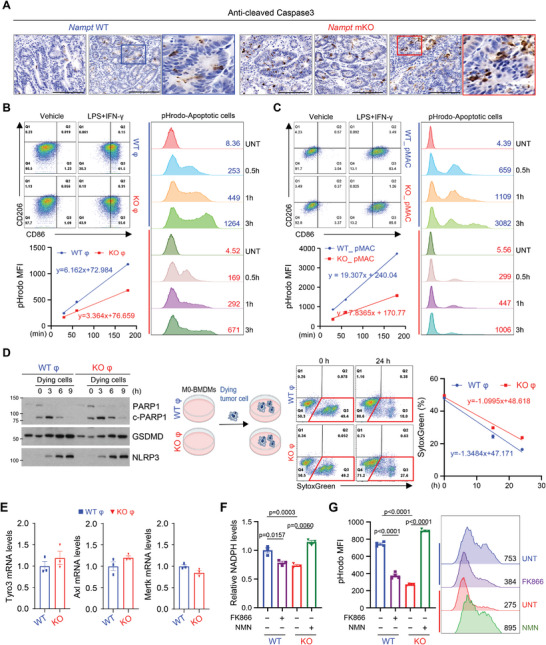
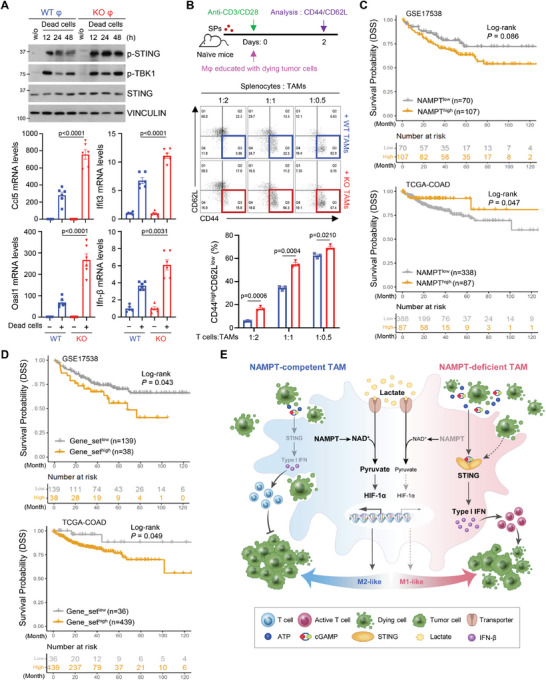
Nicotinamide phosphoribosyltransferase (NAMPT) is a metabolic enzyme with key roles in inflammation. Previous studies have examined the consequences of its upregulated expression in cancer cells themselves, but studies are limited with respect to its role in the other cells within the tumor microenvironment (TME) during colorectal cancer (CRC) progression. Using single-cell RNA sequencing (scRNA-seq) data, it is founded that NAMPT is highly expressed in SPP1+ tumor-associated macrophages (TAMs), a unique subset of TAMs associated with immunosuppressive activity. A NAMPThigh gene signature in SPP1+ TAMs correlated with worse prognostic outcomes in CRC patients. The effect of Nampt deletion in the myeloid compartment of mice during CRC development is explored. NAMPT deficiency in macrophages resulted in HIF-1α destabilization, leading to reduction in M2-like TAM polarization. NAMPT deficiency caused significant decreases in the efferocytosis activity of macrophages, which enhanced STING signaling and the induction of type I IFN-response genes. Expression of these genes contributed to anti-tumoral immunity via potentiation of cytotoxic T cell activity in the TME. Overall, these findings suggest that NAMPT-initiated TAM-specific genes can be useful in predicting poor CRC patient outcomes; strategies aimed at targeting NAMPT may provide a promising therapeutic approach for building an immunostimulatory TME in CRC progression.

Keywords: CRC; HIF‐1α; M2‐like TAMs; NAMPT; STING.


Conflict of interest statement

The authors declare no conflict of interest.

Figures

Figure 1
Figure 1
NAMPT is highly expressed in tumor‐specific macrophages associated with pro‐tumoral property of TAMs. A) The mRNA expression of NAMPT in tumor and adjacent normal tissues across all TCGA tumors is shown. The statistical significance was computed by the Wilcoxon test (*: p‐value <0.05; **: p‐value <0.01; ***: p‐value <0.001). B) Relative expression of NAMPT mRNA in adjacent normal tissues and tumor tissues grouped by cell types is shown. The black line represents median expression. C) Relative expression of NAMPT mRNA is shown for tumor tissues grouped by selected myeloid cell clusters. The black line represents median expression. (left). Relative expression of NAMPT mRNA in monocytes (“hM05_Mono‐CD14”, “hM06_Mono‐CD16”, “hM07_Mono‐CD14CD16”, and “hM11_Monolike‐FCN1”) and TAMs (“hM12_TAM‐C1QC” and “hM13_TAM‐SPP1”) is shown for adjacent normal tissues (middle) and tumor tissues (right). n and p indicate the number of cells and t‐test p values (*<0.05, **<0.01, ***<0.001), respectively. The black line represents median expression. D) Relative expression of NAMPT mRNA in monocytes (”hM05_Mono‐CD14”, “hM06_Mono‐CD16”, “hM07_Mono‐CD14CD16”, and “hM11_Monolike‐FCN1”) and TAMs (“hM12_TAM‐C1QC” or “hM13_TAM‐SPP1”) is shown for adjacent normal tissues (left) and tumor tissues (right). n and p indicate the number of cells and t‐test p values (*<0.05, **<0.01, ***<0.001), respectively. The black line represents median expression. E) Density plot showing distribution of NAMPT expression in NAMPThigh and NAMPTlow SPP1+ TAMs. F) Relative expression of known TAM markers mediating M1/M2 polarization is shown for SPP1+ TAMs. T‐test p values (*<0.05, **<0.01, ***<0.001). The black line represents median expression. G) Correlation of NAMPT expression with module score of CCL20, CXCL8, IL1B, CXCL3, CXCL2, and VEGFA in SPP1+ TAMs (left). Module scores of NAMPThigh and NAMPTlow SPP1+ TAMs are shown (right). T‐test p values (*<0.05, **<0.01, ***<0.001) are shown. The black line represents median expression. H) Top enriched Hallmark gene sets in the NAMPThigh group compared to the NAMPTlow group in SPP1+ TAMs. Normalized enrichment scores (NES) are shown (left; adjusted p value<0.05). GSEA plots of selected top‐ranked Hallmark gene sets (right). NES and adjusted p values (Padj) are shown.
Figure 2
Figure 2
NAMPT potentiates the HIF‐1a/STAT signaling pathway when under lactic acidosis conditions. A,B) The expression levels of the indicated proteins were assessed in WT and Nampt KO macrophages treated with 15 mM lactic acid via western blotting (left). Quantification of the protein amounts is shown as a ratio of HIF‐1α to vinculin and p‐STAT3 to STAT3 (right). C) WT and Nampt KO macrophages were pretreated with 20 nM FK866 or 1 mM NMN for 6 h, followed by incubation with 15 mM lactic acid for 24 h. Cell lysates were subjected to western blotting. D) WT and Nampt KO macrophages were incubated with conditioned medium (CM) collected from MC38 cells for 24 h. The indicated proteins were analyzed by western blotting. E) mRNA levels of Mct1 and Mct4 genes in macrophages from WT and Nampt mKO mice were analyzed by quantitative real‐time PCR (qRT‐PCR). mRNA levels of Mct1 and Mct4 were normalized by mRNA level of Tbp1. F‐G) Concentrations of intracellular lactate (F) and pyruvate (G) were measured in WT and Nampt KO macrophages pretreated with 20 nM FK866 or 1 mM NMN for 6 h, followed by incubation with 15 mM lactic acid for 12 h. H) mRNA levels of angiogenesis‐ and M2 polarization‐related genes were quantified in WT and Nampt KO macrophages treated with 15 mM lactic acid using qRT‐PCR. mRNA levels of the indicated genes were normalized to the mRNA level of Tbp1. Results are represented as the mean ± SEM. Statistical analysis was performed using the unpaired two‐tailed Student's t‐test.
Figure 3
Figure 3
Macrophage NAMPT drives TAM polarity toward M2‐like phenotypes. A) mRNA of Arg‐1, Nos2 and Ifn‐β were quantified in WT and Nampt KO macrophages co‐cultured with MC38 cells for 12 h. mRNA levels of the indicated genes were normalized to the mRNA level of Tbp1. B‐D) BMDMs were directly co‐cultured with tumor cells for the indicated times (B) and were co‐cultured with tumor cells using a transwell system for the indicated times (C). MC38 tumor‐conditioned medium was used as <3‐kDa fractions to stimulate macrophages for the indicated times (D). Representative flow cytometry plots (left) and bar graph (right). Results are represented as the mean ± SEM. Statistical analysis was performed using the unpaired two‐tailed Student's t‐test.
Figure 4
Figure 4
Macrophage‐specific deletion of Nampt alters TAM polarization in TME. A) MC38 cells were subcutaneously injected into WT (n = 7) and Nampt mKO (n = 7) mice (upper panel). Tumor diameters were measured at 7, 10 and 14 days after inoculation of MC38 cells (lower panel). B) Representative tumor images (left) and tumor weight (right) at day 14 in WT and Nampt mKO groups. C) Representative images of tumor tissues by H&E staining from WT and Nampt mKO mice. Scale bar = 1000 µm. D) The proportion of TAMs among CD45+ immune cells from WT and Nampt mKO groups (n = 4 per group) is shown (left). The proportion of CD86high TAMs (M1‐like TAMs) and CD206high TAMs (M2‐like TAMs) in WT and Nampt mKO groups (n = 4 per group) is shown (right). Results are represented as the mean ± SEM. Statistical analysis was performed using the unpaired two‐tailed Student's t‐test.
Figure 5
Figure 5
Macrophage‐specific deletion of Nampt attenuates colitis‐induced tumorigenesis. A) Groups of WT and Nampt mKO mice were subjected to the AOM/DSS‐induced CRC model. A schematic representation of the AOM/DSS treatment is shown (upper panel). Number of tumor nodules and percentage of tumor‐free mice in AOM/DSS‐treated WT (n = 15) and Nampt mKO (n = 18) mice are shown (middle panel). Representative images of colonic tissues, liver, and spleen tissues from WT and Nampt mKO mice treated with AOM/DSS (lower panel). B) Representative images of H&E staining of colonic tumor tissues are shown. Scale bar = 500 µm. C,D) Immunohistochemistry of Ki‐67 (C), F4/80, CD86 and CD206 (D) in colonic tumor tissues from WT and Nampt mKO mice treated with AOM/DSS. Scale bar = 100 µm. E) Relative mRNA levels of cytokines in colonic tumor tissues from WT and Nampt mKO mice treated with AOM/DSS are shown. Results are represented as the mean ± SEM. Statistical analysis was performed using the unpaired two‐tailed Student's t‐test.
Figure 6
Figure 6
NAMPT in macrophages is required for efficient clearance of apoptotic tumor cells. A) Paraffin‐embedded colonic tumor sections from AOM/DSS‐treated mice were stained with anti‐cleaved caspase3. Scale bar = 100 µm. B,C) Flow cytometry analysis of CD86 and CD206 expressions in CD11b+F4/80+ macrophages upon LPS/IFN‐γ treatment (left upper). The phagocytic activity of BMDMs (B, left bottom) and pMAC (C, left bottom), treated with LPS/IFN‐γ for 12 h was measured from 30 min to 180 min after adding dying MC38 cells labeled with pHrodo green dye using flow cytometry. Representative histogram of pHrodo intensity is shown (B and C, right).D) Western blot analysis of co‐culture experiment of BMDMs with dying MC38 cells for different time points (left). Flow cytometry analysis of SytoxGreen‐stained population during co‐culture of BMDMs and dying MC38 cells (right). E) Relative mRNA levels of Tyro3, Axl, Mertk genes in BMDMs from WT and Nampt mKO mice. F) NADPH levels are measured in WT and Nampt KO BMDMs treated with FK866 or NMN. G) BMDMs were treated with LPS/IFN‐γ for 12 h in the presence or absence of FK866 or NMN. The phagocytic activity of BMDMs was measured 2 h after adding dying MC38 cells labeled with pHrodo green dye by using flow cytometry (left). Representative histogram of pHrodo intensity is shown (right). Results are represented as the mean ± SEM. Statistical analysis was performed using the unpaired two‐tailed Student's t‐test.
Figure 7
Figure 7
Enhanced STING‐dependent type I IFN responses promote cytotoxic T cell activity in NAMPT‐deficient macrophages. A) BMDMs from WT and Nampt mKO mice were treated with dying MC38 cells for the indicated times. The indicated proteins were analyzed by western blotting (upper) and mRNA levels of Ifn‐β and IFN response genes were analyzed by qRT‐PCR (bottom). mRNA levels of the indicated genes were normalized to the mRNA levels of Tbp1. B) A Schematic diagram of co‐culture with TAMs and splenocytes. To obtain the trained TAMs, BMDMs were cultured with dying tumor cells for 48 h. TAMs were incubated with splenocytes from naïve mice for 2 days. FACS analysis of the proportion of effector cells (CD44highCD62Llow) of CD8+ T cells co‐cultured with TAMs is shown. Results are represented as the mean ± SEM. Statistical analysis was performed using the unpaired two‐tailed Student's t‐test. C) Disease‐specific survival Kaplan‐Meier (KM) curves showing NAMPTlow (grey) and NAMPThigh (yellow) groups in a colon cancer patient cohort (top: GSE17538, bottom: TCGA‐COAD). The log‐rank p‐value (P) and the number of patients successfully stratified (n) as determined from univariate Cox regression analysis are shown. D) Disease‐specific survival Kaplan‐Meier (KM) curves showing the two groups stratified by gene signatures (n = 55) highly enriched in NAMPThigh TAMs (GSE146771) in a colon cancer patient cohort (top: GSE17538, bottom: TCGA‐COAD. The log‐rank p‐value (P) and the number of patients successfully stratified (n) determined from univariate Cox regression analysis are shown. E) Diagram for reprogramming of NAMPT‐dependent TAM phenotype in TME.

References

    1. Ganesh K., Stadler Z. K., Cercek A., Mendelsohn R. B., Shia J., Segal N. H., Diaz L. A. Jr., Nat. Rev. Gastroenterol. Hepatol. 2019, 16, 361. - PMC - PubMed
    1. Schmitt M., Greten F. R., Nat. Rev. Immunol. 2021, 21, 653. - PubMed
    1. Lasry A., Zinger A., Ben‐Neriah Y., Nat. Immunol. 2016, 17, 230. - PubMed
    1. Anderson N. M., Simon M. C., Curr. Biol. 2020, 30, R921. - PMC - PubMed
    1. Zhang X., Ji L., Li M. O., Immunity 2023, 56, 14. - PMC - PubMed

Substances