. 2024 Apr;11(14):e2305979.
doi: 10.1002/advs.202305979. Epub 2024 Feb 2.

A Single-Atom Manganese Nanozyme Mn-N/C Promotes Anti-Tumor Immune Response via Eliciting Type I Interferon Signaling

Affiliations

A Single-Atom Manganese Nanozyme Mn-N/C Promotes Anti-Tumor Immune Response via Eliciting Type I Interferon Signaling

Wen Qiao et al. Adv Sci (Weinh). 2024 Apr.

Abstract

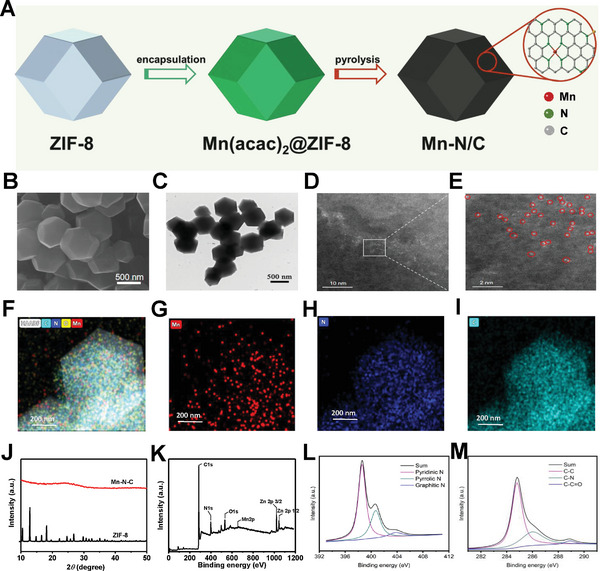
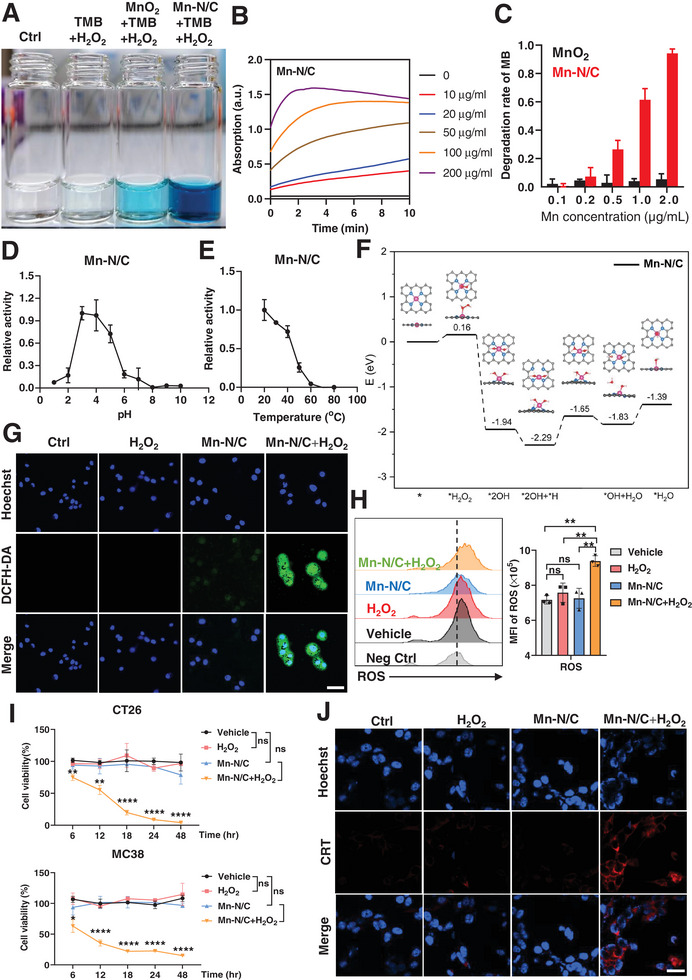
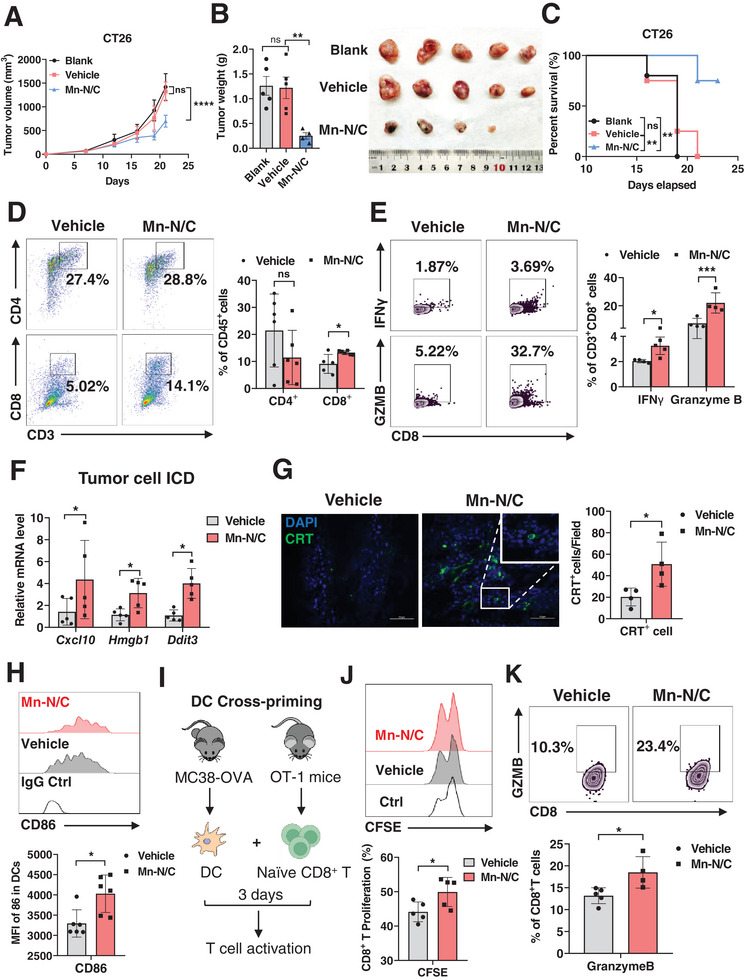
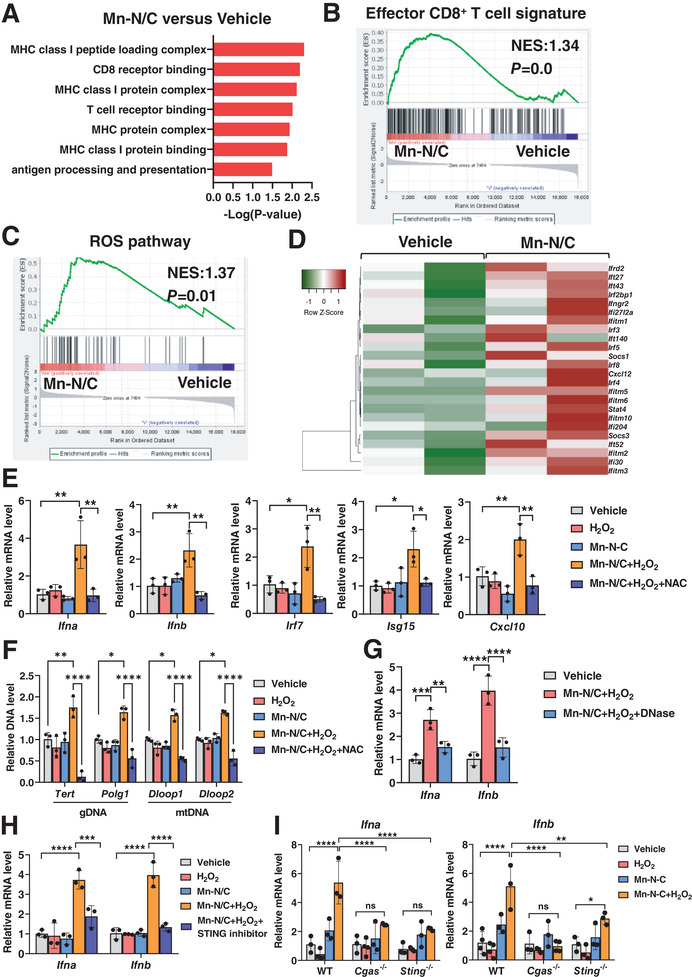
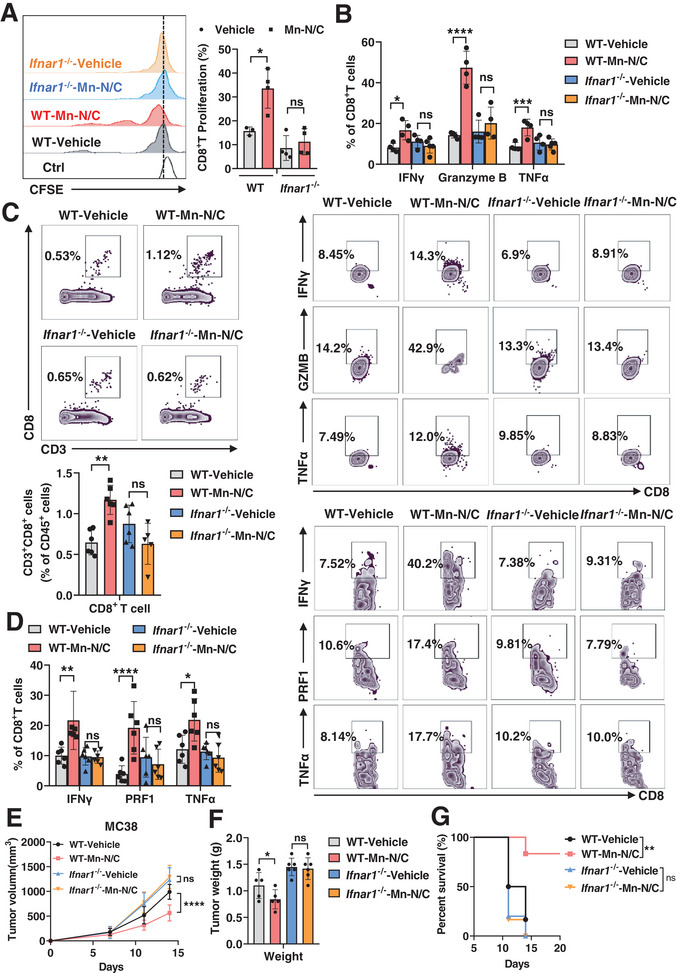
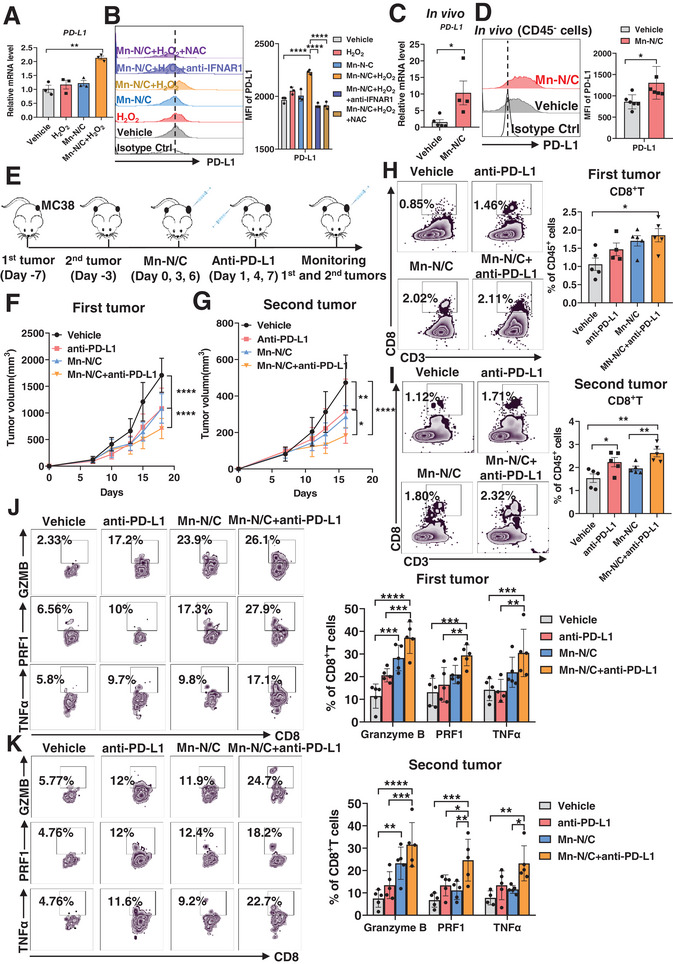
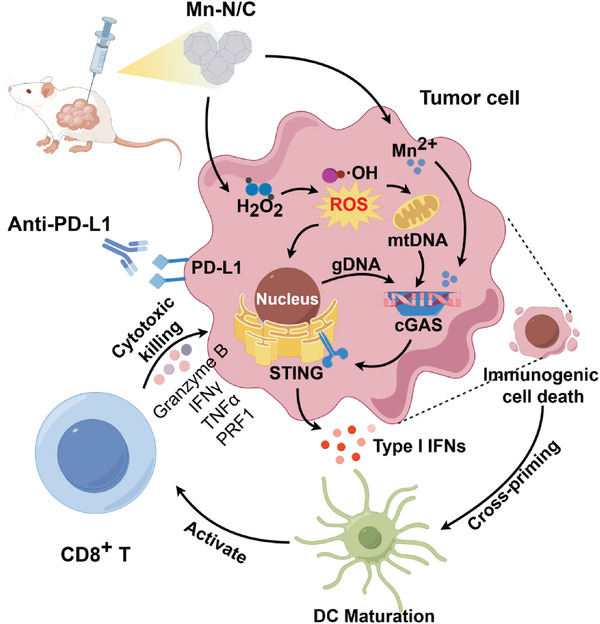
Tumor microenvironment (TME)-induced nanocatalytic therapy is a promising strategy for cancer treatment, but the low catalytic efficiency limits its therapeutic efficacy. Single-atom catalysts (SACs) are a new type of nanozyme with incredible catalytic efficiency. Here, a single-atom manganese (Mn)-N/C nanozyme is constructed. Mn-N/C catalyzes the conversion of cellular H2O2 to ∙OH through a Fenton-like reaction and enables the sufficient generation of reactive oxygen species (ROS), which induces immunogenic cell death (ICD) of tumor cells and significantly promotes CD8+T anti-tumor immunity. Moreover, RNA sequencing analysis reveals that Mn-N/C treatment activates type I interferon (IFN) signaling, which is critical for Mn-N/C-mediated anti-tumor immune response. Mechanistically, the release of cytosolic DNA and Mn2+ triggered by Mn-N/C collectively activates the cGAS-STING pathway, subsequently stimulating type I IFN induction. A highly efficient single-atom nanozyme, Mn-N/C, which enhances anti-tumor immune response and exhibits synergistic therapeutic effects when combined with the anti-PD-L1 blockade, is proposed.

Keywords: ROS; anti‐tumor immunity; nanomedicine; single‐atom nanozyme; type I interferon.


Conflict of interest statement

The authors declare no conflict of interest.

Figures

Figure 1
Figure 1
Characterization of single‐atom manganese nanozyme Mn‐N/C. A) Schematic illustration of the formation of Mn‐N/C single‐atom nanozyme. B) SEM micrograph. C) TEM micrograph. D,E) AC‐HAADF‐STEM micrograph. F–I) the EDS mapping of Mn, N, and C of prepared Mn‐N/C. J) XRD patterns of the ZIF‐8 and Mn‐N/C. K) XPS survey spectra of Mn‐N/C. L,M) XPS spectra for C 1s and N 1s of Mn‐N/C.
Figure 2
Figure 2
The peroxidase‐like activity of Mn‐N/C and ROS generation. A) Typical photographs of TMB reaction solutions oxidized by Mn‐N/C or MnO2 when incubated at room temperature. B) The time‐dependent absorbance changes at 652 nm in the absence (black) or presence of different concentrations of Mn‐N/C. C) ROS scavenging ability of Mn‐N/C and MnO2 determined by UV–vis absorbance based on methylene blue (MB). Data are shown as mean±SEM (n = 3). D) The peroxidase‐like catalytic activity of Mn‐N/C under different pH conditions. Data are shown as mean±SEM (n = 3). E) The peroxidase‐like catalytic activity of Mn‐N/C under different temperatures. Data are shown as mean±SEM (n = 3). F) DFT studies on the peroxidase‐like activity of Mn‐N/C. In the energy profiles, the most favorable paths of H2O2 dissociation into surface OH species in the acidic condition. The Mn, C, N, and H atoms were given in pink, gray, blue, and white, respectively. G) Confocal imaging of ROS generation in CT26 tumor cells after treatment with H2O2 or Mn‐N/C (100 µg/mL). DCFH‐DA was used as a fluorescent probe for ROS imaging. Scale bar: 50 µm. H) FACS analysis (left) and the quantification (right) of ROS production in MC38 tumor cells after vehicle or Mn‐N/C treatment for 24 h. Quantitative data are shown as mean±SEM (n = 3). One‐way ANOVA and Sidak's multiple comparisons test were performed. I) The cell viability of CT26 and MC38 tumor cells treated with H2O2 or Mn‐N/C for the indicated time points by CCK8 assays. Quantitative data are shown as mean±SEM (n = 3). Two‐way ANOVA (mixed model) and Sidak's multiple comparisons test were performed. J) Immunofluorescence staining of CRT in MC38 tumor cells after treatment with H2O2 or Mn‐C/N for 24 h. Scale bar, 20 µm. *, p < 0.05; **, p < 0.01; ***, p < 0.001; ****, p < 0.0001; ns, no significance
Figure 3
Figure 3
Mn‐N/C inhibits tumor growth and promotes anti‐tumor immunity. A) Tumor growth curve of CT26 in the WT mice intratumorally injected with vehicle, Mn‐N/C, or without treatment (Blank). Data are shown as mean±SEM (n = 4–5 mice per group). Two‐way ANOVA (mixed model) and Sidak's multiple comparisons test were performed. B) The images of the tumor mass and tumor weight from CT26 tumor‐bearing mice in blank, vehicle, and Mn‐N/C groups. Data are shown as mean±SEM (n = 4–5 mice per group). Two‐tailed unpaired t‐test was performed for the comparison between the two groups. C) Kaplan–Meier analysis of mice survival in blank, vehicle, and Mn‐N/C groups as A described (n = 4–5 mice per group). D) FACS analysis (left) and quantification (right) of tumor‐infiltrating CD4+ and CD8+ T cells in the mice treated with vehicle or Mn‐N/C. Data are shown as mean±SEM (n = 5–6 mice per group). Two‐way ANOVA and Sidak's multiple comparisons test were performed. E) FACS analysis (left) and quantification (right) of IFNγ+ and Granzyme B+ of tumor‐infiltrating CD8+ T cells in the mice treated with vehicle or Mn‐N/C. Data are shown as mean±SEM (n = 4–5 mice per group). Two‐way ANOVA and Sidak's multiple comparisons test were performed. F) Real‐time PCR analysis of Cxcl10, Hmgb1, and Ddit3 gene expression levels in the tumor cells (RFP+) sorted from MC38‐OVA‐RFP tumor‐bearing mice with vehicle or Mn‐N/C treatment. Data are shown as mean±SEM (n = 5). Two‐way ANOVA and Sidak's multiple comparisons test were performed. G) The immunofluorescence (left) and the quantification (right) of CRT in MC38 tumors treated with vehicle or Mn‐N/C. Scale bar, 50 µm. Two‐tailed unpaired t‐test was performed for the comparisons between the two groups. H) FACS analysis (above) and quantification (below) of CD86 expression of DCs in the draining lymph nodes from MC38‐OVA‐RFP tumor‐bearing mice treated with vehicle or Mn‐N/C. Data are shown as mean±SEM (n = 6 mice per group). Two‐tailed unpaired t‐test was performed for the comparisons between the two groups. I) Schematic illustration of the analysis of DC‐cross priming. naïve CD8+ T cells purified from OT‐1 mice were co‐cultured with DCs sorted from the draining lymph nodes of MC38‐OVA tumor‐bearing mice with vehicle or Mn‐N/C treatment for 3 days to evaluate T cell activation. J) FACS analysis (above) of CFSE and quantification (below) of T cell proliferation after co‐culturing with DCs for 3 days as I described. Data are shown as mean±SEM (n = 4–5 mice per group). Two‐tailed unpaired t‐test was performed for the comparisons between the two groups. K) FACS analysis (above) and quantification (below) of Granzyme B+ of CD8+T cells after co‐culturing with DCs for 3 days as I described. Data are shown as mean±SEM (n = 4–5 mice per group). Two‐tailed unpaired t‐test was performed for the comparisons between the two groups. *, p < 0.05; **, p < 0.01; ***, p < 0.001; ****, p < 0.0001; ns, no significance
Figure 4
Figure 4
Mn‐N/C activates type I IFN signaling by cGAS/STING‐dependent cytosolic DNA sensing. A) GO enrichment gene analysis of pathways in tumor tissues of MC38‐bearing mice with vehicle or Mn‐N/C treatment. B) GSEA analysis of enrichment of CD8+ T cell effector signatures in tumor tissues of MC38 tumor‐bearing mice with vehicle or Mn‐N/C treatment. C) GSEA analysis of enrichment of ROS pathway signatures in tumor tissues of MC38‐bearing mice with vehicle or Mn‐N/C treatment. D) Heatmap of type I IFN gene signatures in tumor tissues of MC38‐bearing mice with vehicle or Mn‐N/C treatment. E) Real‐time PCR analysis of Ifna, Ifnb, Irf7, Isg15, and Cxcl10 gene expression levels in MC38 tumor cells treated with H2O2, Mn‐N/C, or plus with NAC (1 mm) for 24 h. Data are shown as mean±SEM (n = 3). Two‐tailed unpaired t‐test was performed for the comparisons between the two groups. F) Cytosolic amount of gDNA and mtDNA in MC38 tumor cells treated with H2O2, Mn‐N/C, or plus with NAC (1 mm) treatment for 24 h. Data are shown as mean±SEM (n = 3). Two‐way ANOVA and Sidak's multiple comparisons test were performed. G) Real‐time PCR analysis of Ifna and Ifnb expression in MC38 tumor cells treated with Mn‐N/C and H2O2, or plus with DNase for 24 h. Data are shown as mean±SEM (n = 3). Two‐way ANOVA and Sidak's multiple comparisons test were performed. H) Real‐time PCR analysis of Ifna and Ifnb expression in MC38 tumor cells treated with Mn‐N/C, H2O2, or plus with STING inhibitor H151 for 24 h. Data are shown as mean±SEM (n = 3). Two‐way ANOVA and Sidak's multiple comparisons test were performed. I) Real‐time PCR analysis of Ifna and Ifnb expression in WT, Cgas −/−, Sting −/− MC38 tumor cells treated with H2O2, Mn‐N/C for 24 h. Data are shown as mean±SEM (n = 3). Two‐way ANOVA and Sidak's multiple comparisons test were performed. *, p < 0.05; **, p < 0.01; ***, p < 0.001; ****, p < 0.0001; ns, no significance
Figure 5
Figure 5
Type I interferon signaling is critical for Mn‐N/C‐mediated anti‐tumor immune response. A) FACS analysis (left) of CFSE and the quantification (right) of OT‐1 T cell proliferation after co‐cultured with DCs sorted from lymph nodes of WT and Ifnar1−/− MC38‐OVA tumor‐bearing mice with vehicle or Mn‐N/C treatment. Data are shown as mean±SEM (n = 4 per group). Two‐way ANOVA and Sidak's multiple comparisons test were performed. B) FACS analysis (below) and the quantification (above) of IFNγ+, Granzyme B+, TNFα+ of OT‐1 CD8+ T cells after co‐culture with DCs as A described. Data are shown as mean±SEM (n = 4 mice per group). Two‐way ANOVA and Sidak's multiple comparisons test were performed. C) FACS analysis (above) and the quantification (below) of tumor‐infiltrating CD8+ T cells in WT and Ifnar1−/− MC38 tumor‐bearing mice with vehicle or Mn‐N/C treatment. Data are shown as mean±SEM (n = 5–6 mice per group). Two‐way ANOVA and Sidak's multiple comparisons test were performed. D) FACS analysis (right) and the quantification (left) of IFNγ+, PRF1+ (Perforin), TNFα+ of CD8+ T cells in WT and Ifnar1−/− MC38 tumor‐bearing mice with vehicle or Mn‐N/C treatment. Data are shown as mean±SEM (n = 5–6 mice per group). Two‐way ANOVA and Sidak's multiple comparisons test were performed. E) Tumor growth curve of MC38 in WT and Ifnar1−/− mice with vehicle or Mn‐N/C treatment. Data are shown as mean±SEM (n = 5–6 mice per group). Two‐way ANOVA (mixed model) and Sidak's multiple comparisons test were performed. F) MC38 tumor weight in WT and Ifnar1−/− mice with vehicle or Mn‐N/C treatment 14 days after tumor cell inoculation. Data are shown as mean±SEM (n = 5–6 mice per group). G) Kaplan–Meier analysis of WT and Ifnar1 −/− mice survival with vehicle or Mn‐N/C treatment (n = 5–6 mice per group). *, p < 0.05; **, p < 0.01; ***, p < 0.001; ****, p < 0.0001; ns, no significance
Figure 6
Figure 6
A combination of Mn‐N/C and PD‐L1 blockade synergistically suppresses tumor growth. A) Real‐time PCR analysis of PD‐L1 mRNA expression of MC38 tumor cells treated with H2O2, Mn‐N/C for 24 h. Quantitative data are shown as mean±SEM (n = 3). One‐way ANOVA and Sidak's multiple comparisons test were performed. B) FACS analysis (left) and the quantification (right) of PD‐L1 levels on the surface of MC38 tumor cells treated with H2O2, Mn‐N/C, or plus with anti‐IFNAR1 antibody or NAC treatment for 24 h. Quantitative data are shown as mean±SEM (n = 3). One‐way ANOVA and Sidak's multiple comparisons test were performed. C) Real‐time PCR analysis of PD‐L1 mRNA expression of tumor cells (RFP+) sorted from MC38‐OVA tumor‐bearing mice with vehicle or Mn‐N/C treatment. Quantitative data are shown as mean±SEM (n = 3). Two‐tailed unpaired t‐test was performed for the comparisons between the two groups. D) FACS analysis (left) and the quantification (right) of PD‐L1 levels in CD45 cells from MC38 tumor‐bearing mice with vehicle or Mn‐N/C treatment. Data are shown as mean±SEM (n = 6 mice per group). Two‐tailed unpaired t‐test was performed for the comparisons between the two groups. E) Schematic illustration of a bilateral model of MC38 tumors subcutaneously implanted on C57BL/6 mice and treated with vehicle or Mn‐N/C, or plus with anti‐PD‐L1 antibody. F,G) Tumor growth curve of the first tumor (F) and the second tumor (G) of MC38 in the WT mice treated as E described. Data are shown as mean±SEM (n = 5 mice per group). Two‐way ANOVA (mixed model) and Sidak's multiple comparisons test were performed. H,I) FACS analysis (left) and the quantification (right) of tumor‐infiltrating CD8+ T cells in the first tumor (H) and the second tumor (I) of MC38 tumor‐bearing mice treated as E described. Data are shown as mean±SEM (n = 5 mice per group). Two‐tailed unpaired t‐test was performed for the comparisons between the two groups. J,K) FACS analysis (left) and the quantification (right) of Granzyme B +, PRF1+, TNFα+ of CD8+ T cells in the first tumor (J) and the second tumor (K) of MC38 tumor‐bearing mice treated as E described. Data are shown as mean±SEM (n = 5 mice per group). Two‐way ANOVA and Sidak's multiple comparisons test were performed. *, p < 0.05; **, p < 0.01; ***, p < 0.001; ****, p < 0.0001; ns, no significance
Figure 7
Figure 7
Schematic diagram of Mn‐N/C for activating anti‐tumor immune response. Conceptual and effective mechanisms of Mn‐N/C in triggering immunogenic cell death and remodeling tumor immune microenvironment.

Similar articles

Cited by

References

    1. Sung H., Ferlay J., Siegel R. L., Laversanne M., Soerjomataram I., Jemal A., Bray F., CA Cancer J. Clin. 2021, 71, 209. - PubMed
    1. Behranvand N., Nasri F., Zolfaghari Emameh R., Khani P., Hosseini A., Garssen J., Falak R., Cancer Immunol. Immunother. 2022, 71, 507. - PMC - PubMed
    1. a) Kim T. K., Vandsemb E. N., Herbst R. S., Chen L., Nat. Rev. Drug Discov. 2022, 21, 529; - PubMed
    2. b) Sharma P., Goswami S., Raychaudhuri D., Siddiqui B. A., Singh P., Nagarajan A., Liu J., Subudhi S. K., Poon C., Gant K. L., Herbrich S. M., Anandhan S., Islam S., Amit M., Anandappa G., Allison J. P., Cell 2023, 186, 1652. - PubMed
    1. a) Jia C., Guo Y., Wu F. G., Small 2022, 18, e2103868; - PubMed
    2. b) Tang Z., Liu Y., He M., Bu W., Angew. Chem. Int. Ed. Engl. 2019, 58, 946. - PubMed
    1. a) Gao L., Zhuang J., Nie L., Zhang J., Zhang Y., Gu N., Wang T., Feng J., Yang D., Perrett S., Yan X., Nat. Nanotechnol. 2007, 2, 577; - PubMed
    2. b) Huang Y., Ren J., Qu X., Chem. Rev. 2019, 119, 4357. - PubMed