. 2024 Apr;11(14):e2308496.
doi: 10.1002/advs.202308496. Epub 2024 Feb 2.

Zygotic Splicing Activation of the Transcriptome is a Crucial Aspect of Maternal-to-Zygotic Transition and Required for the Conversion from Totipotency to Pluripotency

Affiliations

Zygotic Splicing Activation of the Transcriptome is a Crucial Aspect of Maternal-to-Zygotic Transition and Required for the Conversion from Totipotency to Pluripotency

Hua Zhang et al. Adv Sci (Weinh). 2024 Apr.

Abstract

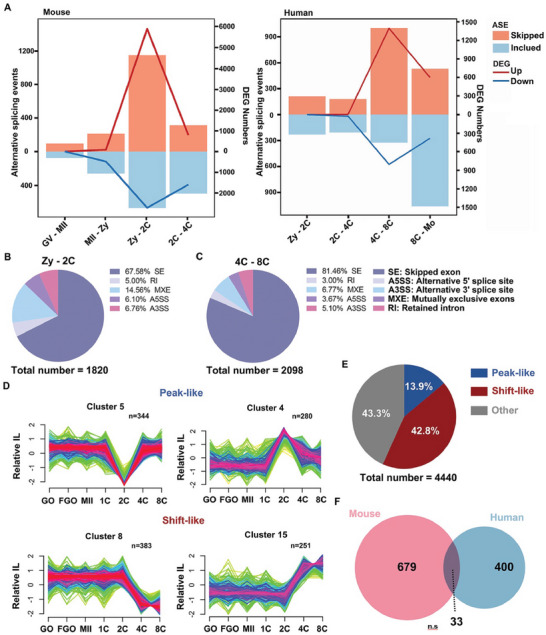
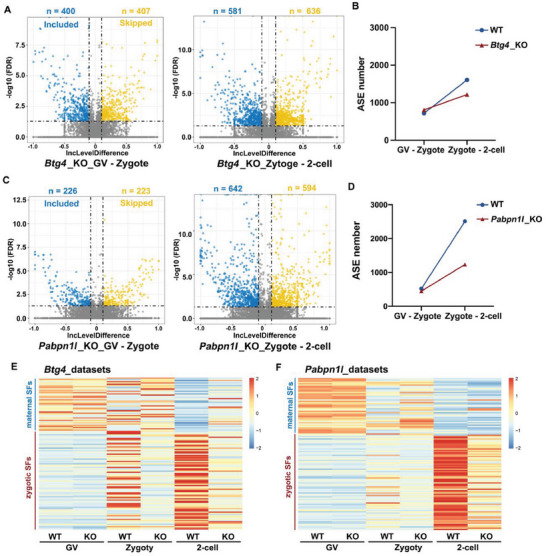
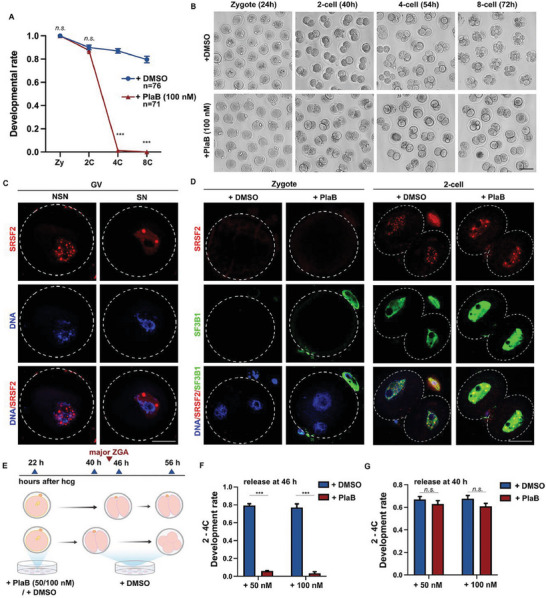
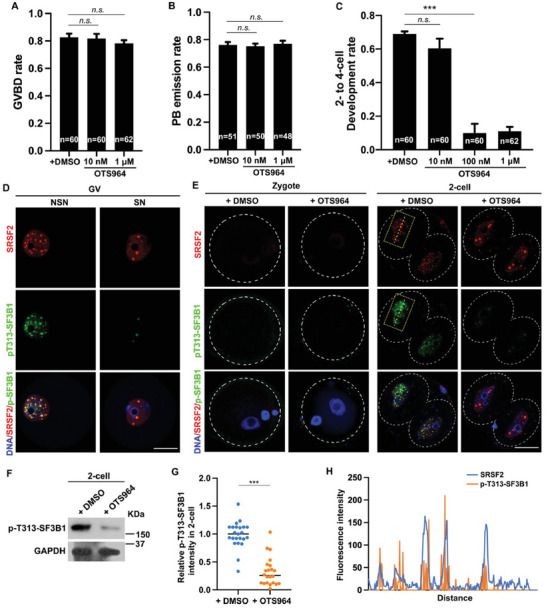
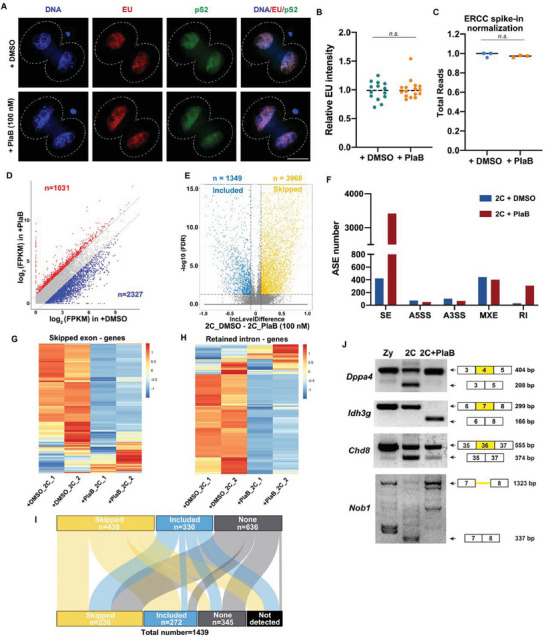
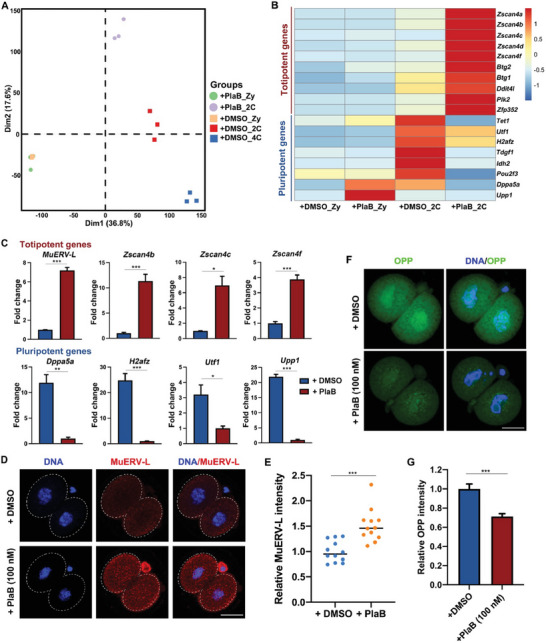
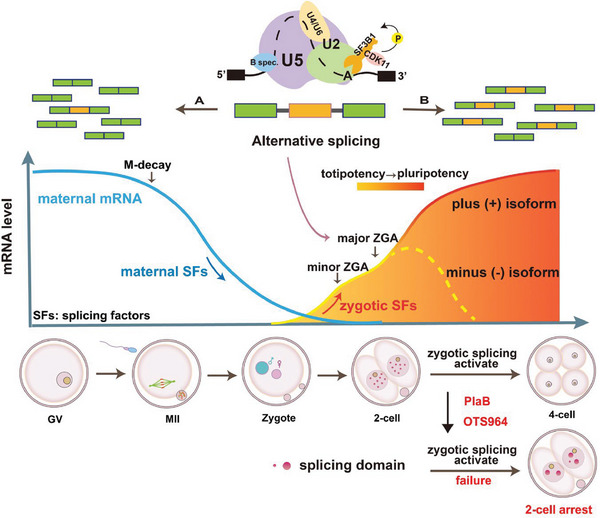
During maternal-to-zygotic transition (MZT) in the embryo, mRNA undergoes complex post-transcriptional regulatory processes. However, it is unclear whether and how alternative splicing plays a functional role in MZT. By analyzing transcriptome changes in mouse and human early embryos, dynamic changes in alternative splicing during MZT are observed and a previously unnoticed process of zygotic splicing activation (ZSA) following embryonic transcriptional activation is described. As the underlying mechanism of RNA splicing, splicing factors undergo dramatic maternal-to-zygotic conversion. This conversion relies on the key maternal factors BTG4 and PABPN1L and is zygotic-transcription-dependent. CDK11-dependent phosphorylation of the key splicing factor, SF3B1, and its aggregation with SRSF2 in the subnuclear domains of 2-cell embryos are prerequisites for ZSA. Isoforms generated by erroneous splicing, such as full-length Dppa4, hinder normal embryonic development. Moreover, alternative splicing regulates the conversion of early embryonic blastomeres from totipotency to pluripotency, thereby affecting embryonic lineage differentiation. ZSA is an essential post-transcriptional process of MZT and has physiological significance in generating new life. In addition to transcriptional activation, appropriate expression of transcript isoforms is also necessary for preimplantation embryonic development.

Keywords: RNA processing; alternative splicing; early embryo; splicing factors; totipotency and pluripotency; zygotic genome activation.


Conflict of interest statement

The authors declare no conflict of interest.

Figures

Figure 1
Figure 1
Dynamic changes in alternative splicing in human and mouse early embryos. A) The alternative splicing event (ASE, FDR < 0.05 and |ILD| > 0.1) and differentially expressed genes (DEGs, FDR < 0.05 and FPKM |Log2 fold change| > 2 or < 0.5) number of mouse oocytes and early embryos in different stages. FDR, false discovery rate; ILD, IncLevelDifference; FPKM, fragments per kilobase of transcript per million mapped reads. B) The ratio of different ASEs in mouse embryos at the 2‐cell stage. C) The ratio of different ASEs in human embryos at the 4‐ to 8‐cell stage. D) Representative examples of two major mouse IncLevel (IL) cluster types (peak‐like and shift‐like) from Mfuzz. E) The ratio of two major cluster types in all stages. The white numbers show the percentages of peak‐like, shift‐like, and other types. F) Venn diagrams showing the overlap of genes with ASEs from mice and humans (FDR > 0.05, (|ILD| > 0.1). n.s.: non‐significant. GV, germinal vesicle oocyte; MII, MII oocyte; Zy, zygote; 2C, 2‐cell; 4C, 4‐cell; 8C, 8‐cell; and Mo, morula.
Figure 2
Figure 2
Failure of maternal‐to‐zygotic transition affects the activation of alternative splicing. A) The ASEs at different stages in Btg4‐knockout (KO) oocytes and embryos are shown with a volcano map. B) The total number of ASEs in Btg4‐wild‐type (WT) and Btg4‐KO oocytes at different stages. C) The ASEs at different stages in Pabpn1l‐KO oocytes and embryos are shown with a volcano map. D) The total number of ASEs in Pabpn1l‐WT and Pabpn1l‐KO oocytes at different stages. E,F) Heatmap showing the expression levels of different splicing factors in Btg4‐WT, Btg4‐KO, Pabpn1l ‐WT, and Pabpn1l‐KO oocytes and embryos.
Figure 3
Figure 3
Zygotic splicing activation failure leads to the arrest of embryonic development at 2‐cell stage. A) The development rates of preimplantation embryos after treatment with pladienolide B (PlaB; 100 nm) or dimethylsulfoxide (DMSO) when embryos reached corresponding stages. The numbers of analyzed embryos are indicated (n). n = 3 biological replicates. Error bars, standard error of the mean (SEM); n.s.: non‐significant. *** p < 0.001 by two‐tailed Student's t‐test. B) Representative images of preimplantation embryos at different stages after treatment with PlaB (100 nm). Scale bar, 100 µm. Time after human chorionic gonadotropin (hCG) injection is indicated (h). C) Immunofluorescent staining showing the speckles of SRSF2 and DAPI in oocytes at non‐surrounded nucleolus (NSN) and surrounded nucleolus (SN) stages. Scale bar, 20 µm. D) Immunofluorescent staining showing the speckles of SRSF2 and the expression level of SF3B1 in zygote and 2‐cell embryos after treatment with PlaB (100 nm) or DMSO. Scale bar, 20 µm. E) Illustration of the time points when the samples were released for experiments in (F) and (G). F,G) The 2–4‐cell development rates of preimplantation embryos after release from DMSO or PlaB treatment at different time points. Error bars, SEM; n.s.: non‐significant. *** p < 0.001 by two‐tailed Student's t‐test.
Figure 4
Figure 4
Phosphorylation of SF3B1 at the 2‐cell stage is essential for zygotic splicing activation. A) Comparison of germinal vesicle breakdown (GVBD) rates in cultured oocytes treated with dimethyl sulfoxide (DMSO) or OTS964. B) The rates of polar body emission (PBE) in cultured oocytes treated with DMSO or OTS964. When oocytes had undergone GVBD within 6 h, they were selected for further culture. C) The development rates of 2–4‐cell embryos after treatment with DMSO or OTS964. The numbers of analyzed embryos are indicated (n). n = 3 biological replicates. Error bars, SEM; n.s.: non‐significant. *** p < 0.001 by two‐tailed Student's t‐test. D) Immunofluorescent staining showing the speckles of SRSF2 and the levels of p‐T313‐SF3B1 in oocytes at the NSN and SN stages. Scale bar, 20 µm. E) Immunofluorescent staining showing the speckles of SRSF2 and the expression levels of SF3B1 in zygotes and 2‐cell embryos after treatment with PlaB (100 nm) or DMSO. Scale bar, 20 µm. F) Western blotting results of p‐T313‐SF3B1 in 2‐cell embryos after treatment from the zygote stage with DMSO or OTS964. G) Quantification of p‐T313‐SF3B1 signal intensity in (C). *** p < 0.001 by two‐tailed Student's t‐test. H) ImageJ was used to quantitatively analyze the distribution of SRSF2 and p‐T313‐SF3B1 in (C), indicated by a yellow dotted line within the square frame.
Figure 5
Figure 5
Dynamic changes in transcript isoforms and expression levels in embryos treated with PlaB. A) Immunofluorescent staining of 5‐ethynyl uridine (EU) and pS2 fluorescence showing RNA transcription in 2‐cell embryos treated with PlaB or DMSO. B) Quantification of EU signal intensity in (A). Error bars, SEM; n.s.: non‐significant. C) Total mRNA quantification of 2‐cell embryos treated with PlaB or DMSO. The results were normalized to an External RNA Controls Consortium (ERCC) spike‐in. Error bars, SEM; n.s.: non‐significant. D) Scatter plot comparing the expressing level of transcripts between 2‐cell embryos treated with PlaB or DMSO. Transcript levels that decreased or increased by more than twofold in 2‐cell embryos treated with PlaB are highlighted in blue or red, respectively. E) Volcano plot showing changes in transcript isoforms skipped or included in 2‐cell embryos treated with PlaB or DMSO. F) Change in the numbers of five different ASEs in 2‐cell embryos treated with PlaB or DMSO. G,H) Heatmap of genes showing the normalized expression levels of transcripts with a skipped exon (SE) or an intron retained (IR) in 2‐cell embryos treated with PlaB. The value in the figure represents the relative mRNA level. I) The global changes of genes during the zygote to 2‐cell undergoing differential SE events after treatment with PlaB. Top column: genes undergoing differential SE events during the zygote to 2‐cell. Lower column: genes undergoing differential SE events during 2‐cell stage after treatment with PlaB. Each bar represents the class of differential SE events. Skipped: More exons skipped (ILD>0.1, FDR<0.05); Included: More exons included (ILD←0.1, FDR<0.05); none: showing no difference; not detected: genes not detected during the 2‐cell stage after treatment with PlaB. J) Reverse transcription‐polymerase chain reaction analysis results of different transcript isomers of genes after PlaB treatment.
Figure 6
Figure 6
Impact of Dppa4 alternative splicing on preimplantation mouse embryo development. A) FPKM values of Idh3g and Dppa4 derived from RNA‐seq data. B) The western blotting results confirmed that the deletion of exon 7 of Idh3g resulted in abnormal protein expression. C) The western blotting results confirmed that the deletion of the SAP domain of Dppa4 resulted in the translation of a smaller protein isoform. D) Fluorescence microscopy results showing mCherry‐DPPA4 (mC‐DPPA4) and mC‐DPPA4△SAP expression in 2‐cell stage embryos (40 h after hCG). E) Representative images of preimplantation embryos at 4‐cell stage (54 h after hCG). Scale bar, 100 µm. F) Development rates of cultured control and mC‐DPPA4△SAP‐ and mC‐DPPA4‐overexpressing zygotes. Error bars, SEM; n.s.: non‐significant. * p < 0.05, ** p < 0.01, *** p < 0.001 by two‐tailed Student's t‐test.
Figure 7
Figure 7
Effect of PlaB treatment on totipotent and pluripotent gene expression levels in 2‐cell embryos. A) Transcriptome‐based PCA of embryos treated with PlaB or DMSO. B) Heatmap of the relative expression levels of representative totipotent and pluripotent genes in 2‐cell embryos treated with PlaB or DMSO. C) RT‐qPCR validation of the expression levels of totipotent and pluripotent genes in 2‐cell embryos treated with PlaB or DMSO. Error bars, SEM. * p < 0.05, ** p < 0.01, *** p < 0.001 by two‐tailed Student's t‐test. D) Immunofluorescent staining showing the level of MuERV‐L in 2‐cell embryos treated with PlaB or DMSO. Scale bar, 20 µm. E) Quantification of MuERV‐L signal intensity in (F). *** p < 0.001. F) O‐propargyl‐puromycin (OPP) staining results showing protein synthesis activity at zygote and 2‐cell stages in 2‐cell embryos treated with PlaB or DMSO. Before staining, these embryos were incubated in a medium containing 20 µm OPP for 30 min. Scale bar, 20 µm. G) Quantification of OPP signal intensity in (D). Error bars, SEM. *** p < 0.001.
Figure 8
Figure 8
Summary of the pattern and functions of alternative splicing during the development of preimplantation mouse embryos and zygotic genome activation. mRNA undergoes complex regulation during oocyte maturation and early embryonic development, including M‐decay and zygotic genome activation (ZGA). Maternal mRNA (including maternal splicing factors) follows a degradation trend represented by the blue curve. The red‐yellow curve represents the activation of zygotic transcripts (including zygotic splicing factors), with the transition from yellow to red indicating the conversion of early embryos from totipotency to pluripotency. During this process, alternative splicing is activated to produce different isoforms, ensuring normal embryonic development by allowing the function of the plus isoform, while degrading the minus isoform. Zygotic splicing activation (ZSA) involves the formation of multiple splicing domains by the splicing factor SRSF2, while treatment with SF3B1 inhibitors results in fewer and larger splicing domains, leading to arrested embryonic development at the 2‐cell stage.

References

    1. Tadros W., Lipshitz H. D., Development 2009, 136, 3033. - PubMed
    1. Sha Q. Q., Zhu Y. Z., Li S., Jiang Y., Chen L., Sun X. H., Shen L., Ou X. H., Fan H. Y., Nucleic Acids Res. 2020, 48, 879. - PMC - PubMed
    1. Yu C., Ji S.‐Y., Sha Q.‐Q., Dang Y., Zhou J.‐J., Zhang Y.‐L., Liu Y., Wang Z.‐W., Hu B., Sun Q.‐Y., Sun S.‐C., Tang F., Fan H.‐Y., Nat. Struct. Mol. Biol. 2016, 23, 387. - PubMed
    1. Zhao L. W., Zhu Y. Z., Chen H., Wu Y. W., Pi S. B., Chen L., Shen L., Fan H. Y., EMBO Rep. 2020, 21, e49956. - PMC - PubMed
    1. Sha Q. Q., Yu J. L., Guo J. X., Dai X. X., Jiang J. C., Zhang Y. L., Yu C., Ji S. Y., Jiang Y., Zhang S. Y., Shen L., Ou X.‐H., Fan H.‐Y., EMBO J. 2018, 37, 99333. - PMC - PubMed

LinkOut - more resources