. 2024 Apr;11(14):e2307920.
doi: 10.1002/advs.202307920. Epub 2024 Feb 2.

Spatiotemporal Controllable Sono-Nanovaccines Driven by Free-Field Based Whole-Body Ultrasound for Personalized Cancer Therapy

Affiliations

Spatiotemporal Controllable Sono-Nanovaccines Driven by Free-Field Based Whole-Body Ultrasound for Personalized Cancer Therapy

Yang Wang et al. Adv Sci (Weinh). 2024 Apr.

Abstract

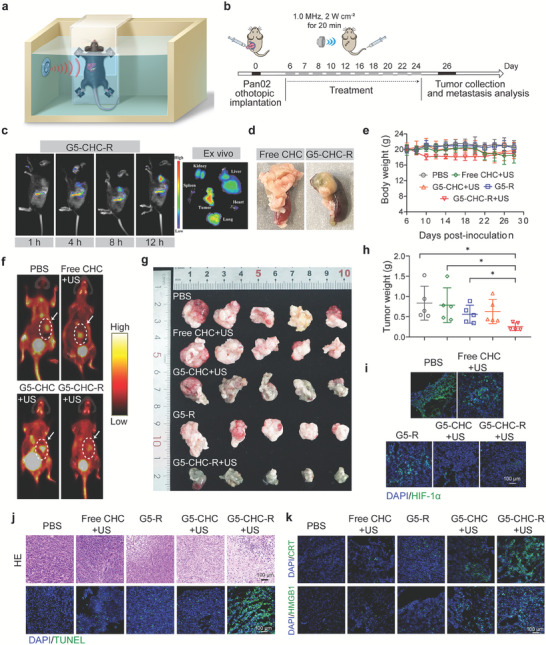
Therapeutic cancer vaccines fail to produce satisfactory outcomes against solid tumors since vaccine-induced anti-tumor immunity is significantly hampered by immunosuppression. Generating an in situ cancer vaccine targeting immunological cold tumor microenvironment (TME) appears attractive. Here, a type of free-field based whole-body ultrasound (US)-driven nanovaccines are constructed, named G5-CHC-R, by conjugating the sonosensitizer, Chenghai chlorin (CHC) and the immunomodulator, resiquimod (R848) on top of a super small-sized dendrimeric nanoscaffold. Once entering tumors, R848 can be cleaved from a hypoxia-sensitive linker, thus modifying the TME via converting macrophage phenotypes. The animals bearing orthotopic pancreatic cancer with intestinal metastasis and breast cancer with lung metastasis are treated with G5-CHC-R under a free-field based whole-body US system. Benefit from the deep penetration capacity and highly spatiotemporal selectiveness, G5-CHC-R triggered by US represented a superior alternative for noninvasive irradiation of deep-seated tumors and magnification of local immune responses via driving mass release of tumor antigens and "cold-warm-hot" three-state transformation of TME. In addition to irradiating primary tumors, a robust adaptive anti-tumor immunity is potentiated, leading to successful induction of systemic tumor suppression. The sono-nanovaccines with good biocompatibility posed wide applicability to a broad spectrum of tumors, revealing immeasurable potential for translational research in oncology.

Keywords: nanovaccines; tumor associated macrophages; tumor microenvironment modulation; ultrasound‐driven; whole‐body sonodynamic therapy.


Conflict of interest statement

The authors declare no conflict of interest.

Figures

Figure 1
Figure 1
Schematic illustration of the structure of the sono‐nanovaccines and their therapeutical mechanisms driven by the free‐field based whole‐body US irradiation. Scheme of the sono‐nanovaccines, G5‐CHC‐R (upper), and schematic diagram of the sono‐nanovaccines for direct tumor cells killing as well as amplifying the cascade of the immune responses via “cold‐warm‐hot” three‐state transformation of TME (lower). MDSC, myeloid‐derived suppressor cell; M2 MΦ, M2‐phenotypic macrophage; M1 MΦ, M1‐phenotypic macrophage; imDC, immature dendritic cell; mDC, mature dendritic cell; CTL, cytotoxic T lymphocyte; CRT, calreticulin; HMGB1, high mobility group box protein 1.
Figure 2
Figure 2
Schematic and characterization of the US‐driven sono‐nanovaccines, G5‐CHC‐R. a) Schematic illustration of the preparation of CHC. (i) Acetone, Reflux, 2 h. (ii) Et2O, HCl, yield 1.1%. (iii) 5% H2SO4 in CH3OH, 25 °C, 4 h; CH3OH, CH3ONa, 25 °C, 12 h, yield 23%. (iv) 5% KOH, THF, 40 °C, 12 h, yield 81%. b) Snythetic illustration of G5‐CHC‐R. (i) CHC, HOBt, EDC, 2 h. (ii) R848‐NTR‐COOH, NHS, EDC, 12 h. (iii) Methoxyl PEG carboxyl (Mw 2000), NHS, EDC, 12 h. Conjugation numbers, p = 14–18 per G5, b = 17–20 per G5. c,d) Hydrodynamic diameters in PBS pH 7.4 (c) and zeta potentials in water (d) of G5, G5‐R, G5‐CHC and G5‐CHC‐R measured by DLS. e) UV–vis absorbance spectra of free CHC, G5‐CHC, G5‐R and G5‐CHC‐R. f) TEM image showing the spherical morphology of G5‐CHC‐R with good dispersity. Scale bars, 100 nm. g) Long‐term stability of G5‐R, G5‐CHC, and G5‐CHC‐R in PBS pH 7.4 at room temperature for 7 days (n = 3). h) ESR spectra of G5‐CHC‐R with US irradiation. i) HPLC analysis demonstrating the release of R848 from G5‐CHC‐R triggered by NRT (100 µg mL−1) and NADH (100 µM). j) Ratios of M1 versus M2 phenotypic macrophages measured by flow cytometry (n = 3). k) CLSM images of 3D tumor spheroids after incubating with free CHC and G5‐CHC‐R at CHC concentration of 50 µg mL−1 for 4 h (Ex 559 nm, Em 650–700 nm, scale bar, 50 µm). l) Line‐scanning profiles showing the gray value indicated by the white lines shown in (k). m) Evaluation of sonotoxicity of G5‐CHC and G5‐CHC‐R against 4T1 cells by MTT assay. In vitro US irradiation condition was 1 MHz, 3 W cm−2 for 20 min (n = 6). n) Detecting ROS generation on 4T1 cells with an intracellular ROS‐specific probe, DCFH‐DA (Ex 450–490 nm, Em 500–550 nm, scale bar, 50 µm). o) The changes of mitochondrial membrane potentials of 4T1 cells after being treated with G5‐CHC‐R with US, stained with Rhodamine 123 (Ex 450–490 nm, Em 500–550 nm, scale bar, 50 µm). CCCP was set as positive control. p,q) 4T1 cells were incubated with free CHC, G5‐R, G5‐CHC, and G5‐CHC‐R for 4 h then following the US treatment (1 MHz, 3 W cm−2) for 20 min. ATP levels in the supernatants were analyzed as in (p) (n = 3) and CRT exposure was analyzed by flow cytometry in (q) (n = 3). Data represented mean ± SD. Statistical significance was calculated via Student's t‐test (m) or one‐way ANOVA with Dunnett's multiple comparison test (j,p,q); ns means no significant difference. p‐value: * p <0.05, ** p <0.01, *** p <0.001, and **** p <0.0001.
Figure 3
Figure 3
The sono‐nanovaccines driven by the free‐field‐based whole‐body US system inhibited primary tumor growth in the orthotopic pancreatic cancer model with intestinal metastasis. a) Schematic illustration of equipment setup for free‐field based whole‐body US irradiation in vivo. b) Time course for the experimental design. A murine pancreatic cancer model with intestinal metastasis was established via orthotopic inoculation of 5 × 105 Pan02 cells per mouse. Different groups were intravenous administration with PBS, free CHC, G5‐CHC, G5‐R, and G5‐CHC‐R at 15 mg CHC kg−1 body weight (for G5‐R, 1 mg R848 kg−1 body weight). For the groups with US irradiation, the mice were kept in the whole‐body US system shown in (a) to receive irradiation at 1.0 MHz, 2 W cm−2 for 20 min. c) In vivo real‐time fluorescence imaging of model mice after intravenous injection of G5‐CHC‐R at different time points, as well as the ex vivo tissue images after 12 h post‐injection (Ex 665 nm, Em 700 nm). d) The photograph of the pancreatic tumor indicated color change after three consecutive doses of G5‐CHC‐R. e) The body weights of different groups with various treatments (n  =  5). f) Noninvasive evaluation of primary tumor burdens in the pancreas by micro PET/CT (coronal view). g) The photographs of the excised pancreatic tumors at the endpoint (n  =  5). h) Average weights of excised primary pancreatic tumors of different treated groups (n  =  5). i,k) Immunofluorescence staining with HIF‐1α (i), CRT, and HMGB1 (k) in the excised tumor tissues after various treatments. Scale bar, 100 µm. j) Representative H&E and TUNEL images of tumor sections. Scale bar, 100 µm. Data represented mean ± SD. Statistical significance was calculated via Student's t‐test (h) or one‐way ANOVA with Dunnett's multiple comparison test; p‐value: * p < 0.05, ** p < 0.01, *** p < 0.001, and **** p <0.0001.
Figure 4
Figure 4
The free‐field‐based whole‐body US‐driven nanovaccines amplified the cascade of the immune responses in tumor situ via “cold‐warm‐hot” three‐state transformation of TME. a–c) Pancreatic tumor tissues were analyzed on day 26 for F4/80+CD86+ M1‐like (a) (n = 5) and F4/80+CD206+ M2‐like (b) (n = 5) macrophages measured by flow cytometry, and corresponding immunofluorescence images stained with indicated antibodies and DAPI (c). Scale bar, 100 µm. d,e) Number of CD11b+Gr‐1+ MDSC cells as a percentage of the total CD45+ leucocytes (d) (n = 5) and representative dot plots (e) in tumor tissues. f) Number of CD80+ DCs as a percentage of the total CD11c+ cell population in tumor tissues (n = 5). g) Number of CD8+ T cells as a percentage of the total CD3+ cell population in tumor tissues (n = 5). h) Immunofluorescence analysis of CD8+ T cells and IFN‐γ production on the tissue sections of the collected primary tumors. Scale bar, 100 µm. i–l) DCs in tumor‐draining lymph nodes were analyzed for their activated status (CD80+CD86+) and cross‐presenting capacities (MHC‐I+CD8+), shown as representative dot plots (i,j) and percentage analysis (k,l) (n = 5). Data represented mean ± SD. Statistical significance was calculated via Student's t‐test or one‐way ANOVA with Dunnett's multiple comparison test (a,b,d,f,g,k,l); p‐value: * p <0.05, ** p <0.01, *** p <0.001, and **** p <0.0001.
Figure 5
Figure 5
The free‐field‐based whole‐body US‐driven nano vaccines potentiated systemic anti‐tumor immune responses to attenuate intestinal metastasis. a) Representative photographs showing the gross appearance of tumor nodules in the intestines and corresponding H&E staining of tissue sections. Scale bar, 500 µm. b) Average weights of spleens for each group and corresponding representative photos (n = 5). c,d) Splenocytes from different treated groups were analyzed for percentages of CD8+ T cells in the total CD3+ cell population, shown as representative dot plots (c) and histograms (d) (n = 5). e,f) The representative dot plots (e) and histograms (f) show the expression of activation marker CD69 in CD8+ T cell population (n = 5). g–i) The representative dot plots (g) and histograms (h,i) show proportions of CD62L+CD44+ central memory T cells (TCM) and CD62LCD44+ effector memory T cells (TEM) in CD8+ T cells in the spleens (n = 5). Data represented mean ± SD. Statistical significance was calculated via Student's t‐test or one‐way ANOVA with Dunnett's multiple comparison tests (b,d,f,h,i); p‐value: * p <0.05, ** p <0.01, *** p <0.001, and **** p <0.0001.
Figure 6
Figure 6
Anti‐tumor activities and TME alternations elicited by the free‐field based whole‐body US‐driven nano vaccines in spontaneous breast cancer with lung metastasis model. a) Time course for the experimental design. A murine breast cancer with spontaneous lung metastasis was established via injection of 5 × 105 4T1 cells into the second pair of mammary glands of female BALB/c mice. Different groups were intravenous administration with PBS, free CHC, G5‐CHC, G5‐R, and G5‐CHC‐R at 15 mg CHC kg−1 body weight (for G5‐R, 1 mg R848 kg−1 body weight). For the groups with US irradiation, the mice were kept in the free‐field based whole‐body US system to receive irradiation at 1.0 MHz, 2 W cm−2 for 30 min. b,c) Monitoring average tumor sizes (a) and individual tumor growth curve (c) for each group versus days after tumor inoculation. d) Photographs of excised breast tumors at the endpoint. e) Representative images of tumor sections of different treated groups stained with H&E and TUNEL. Scale bar, 100 µm. f,g) Breast tumor tissues were analyzed on day 26 for F4/80+CD206+ M2‐like and F4/80+CD86+ M1‐like macrophages measured by flow cytometry, shown as representative dot plots (f) and histograms (g) (n = 5). h,j) Number of CD11b+Gr‐1+ MDSC cells as a percentage of the total CD45+ leucocytes (h) (n = 5) and representative dot plots (j) in tumor tissues. i,k) Number of CD86+CD80+ mature DCs as a percentage of the total CD11c+ cell population (i) (n = 5) and representative dot plots (k) in tumor tissues. Data represented mean ± SD. Statistical significance was calculated via Student's t‐test or one‐way ANOVA with Dunnett's multiple comparison tests (b, f‐k); p‐value: * p <0.05, ** p <0.01, *** p <0.001, and **** p <0.0001.
Figure 7
Figure 7
The free‐field based whole‐body US‐driven nanovaccines synergistically controlled lung metastasis via systemic anti‐tumor immunity. a) Representative photographs of excised lungs of different treated groups and corresponding tissue sections stained with H&E. b) Average lung weights measured at endpoint (n = 4). c,d) Splenocytes from different treated groups were analyzed for percentages of CD8+ T cells in the total CD3+ cell population, shown as histograms (c) (n = 5) and representative dot plots (d). e) The histograms showing the expression of activation marker CD69 in CD8+ T cell population in the spleens (n = 4). f) The histograms showing the persentages of CD44+ memory T cells in CD8+ T cell population in the spleens (n = 4). Data represented mean ± SD. Statistical significance was calculated via Student's t‐test or one‐way ANOVA with Dunnett's multiple comparison tests (b,c,e,f); ns means no significant difference. p‐value: * p <0.05, ** p <0.01, *** p <0.001, and **** p <0.0001.

Similar articles

Cited by

References

    1. a) Farkona S., Diamandis E. P., Blasutig I. M., BMC Med. 2016, 14, 73; - PMC - PubMed
    2. b) Waldman A. D., Fritz J. M., Lenardo M. J., Nat. Rev. Immunol. 2020, 20, 651; - PMC - PubMed
    3. c) Peterson C., Denlinger N., Yang Y., Cancers 2022, 14, 3972; - PMC - PubMed
    4. d) Kumar A., Swain C. A., Shevde L. A., Cancer Metastasis Rev. 2021, 40, 549. - PubMed
    1. a) Galon J., Bruni D., Nat. Rev. Drug Discov. 2019, 18, 197; - PubMed
    2. b) Bonaventura P., Shekarian T., Alcazer V., Valladeau‐Guilemond J., Valsesia‐Wittmann S., Amigorena S., Caux C., Depil S., Front. Immunol. 2019, 10, 168. - PMC - PubMed
    1. a) Ugel S., De Sanctis F., Mandruzzato S., Bronte V., J. Clin. Invest. 2015, 125, 3365; - PMC - PubMed
    2. b) Mantovani A., Allavena P., Marchesi F., Garlanda C., Nat. Rev. Drug Discov. 2022, 21, 799; - PMC - PubMed
    3. c) Gabrilovich D. I., Nagaraj S., Nat. Rev. Immunol. 2009, 9, 162; - PMC - PubMed
    4. d) Barry S. T., Gabrilovich D. I., Sansom O. J., Campbell A. D., Morton J. P., Nat. Rev. Cancer 2023, 23, 216. - PubMed
    1. Saxena M., van der Burg S. H., Melief C. J. M., Bhardwaj N., Nat. Rev. Cancer 2021, 21, 360. - PubMed
    1. a) Lin M. J., Svensson‐Arvelund J., Lubitz G. S., Marabelle A., Melero I., Brown B. D., Brody J. D., Nat. Cancer 2022, 3, 911; - PubMed
    2. b) Hu Z., Ott P. A., Wu C. J., Nat. Rev. Immunol. 2018, 18, 168; - PMC - PubMed
    3. c) Shao K., Singha S., Clemente‐Casares X., Tsai S., Yang Y., Santamaria P., ACS Nano 2015, 9, 16; - PubMed
    4. d) Singha S., Shao K., Ellestad K. K., Yang Y., Santamaria P., ACS Nano 2018, 12, 10621; - PubMed
    5. e) Singha S., Shao K., Yang Y., Clemente‐Casares X., Sole P., Clemente A., Blanco J., Dai Q., Song F., Liu S. W., Yamanouchi J., Umeshappa C. S., Nanjundappa R. H., Detampel P., Amrein M., Fandos C., Tanguay R., Newbigging S., Serra P., Khadra A., Chan W. C. W., Santamaria P., Nat. Nanotechnol. 2017, 12, 701. - PubMed

LinkOut - more resources