. 2024 Apr;11(14):e2305856.
doi: 10.1002/advs.202305856. Epub 2024 Feb 2.

Targeting Grancalcin Accelerates Wound Healing by Improving Angiogenesis in Diabetes

Affiliations

Targeting Grancalcin Accelerates Wound Healing by Improving Angiogenesis in Diabetes

Peng Xiang et al. Adv Sci (Weinh). 2024 Apr.

Abstract

Chronic diabetic wounds are a serious complication of diabetes and often result in limb amputations and confer high mortality rates. The proinflammatory secretome in the wound perpetuates defective neovascularization and contributes to dysregulated tissue repair. This study aims to design a gelatin methacrylamide (GelMA) hydrogel to sustained the release of grancalcin-neutralizing antibody (GCA-NAb) and evaluate it as a potential scaffold to promote diabetic wound healing. Results show that the expression of grancalcin(GCA), a protein secreted by bone marrow-derived immune cells, is elevated in the wound sites of individuals and animals with diabetic ulcers. Genetic inhibition of grancalcin expression accelerates vascularization and healing in an animal model. Mechanistic studies show that grancalcin binds to transient receptor potential melastatin 8(TRPM8) and partially inactivates its downstream signaling pathways, thereby impairing angiogenesis in vitro and ex vivo. Systemic or topical administration of a GCA-NAb accelerate wound repair in mice with diabetes. The data suggest that GCA is a potential therapeutic target for the treatment of diabetic ulcers.

Keywords: angiogenesis; bone marrow‐derived cell; diabetic wound; grancalcin‐neutralizing antibody; hydrogel.


Conflict of interest statement

The authors declare no conflict of interest.

Figures
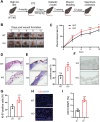
Figure 1
Figure 1
GCA deficiency accelerates wound healing in diabetes. A) The process of the diabetic wound molding model in wild‐type (WT) and GCA knockout (KO) mice (n = 5). Representative wound photographs B) and wound‐healing rates C) at days 0, 3, 6, 9, and 12. D) Representative hematoxylin–eosin‐stained wound sections on Day 12 (scale bars, 200 µm). E) Representative image of Masson's trichrome staining of the wound sections on Day 12 (scale bars, 200 µm). F,G) Immunohistochemical staining and quantitative analysis of Ki67 expression in wound sections on Day 12 (scale bars, 100 µm). Immunofluorescence staining H) and quantitative analysis of CD31 I) expression at the wound site on Day 12 (scale bars, 100 µm). Data are shown as the mean ± SD. * p < 0.05; ** p < 0.01; *** p < 0.001; **** p < 0.0001.
Figure 2
Figure 2
Enrichment of GCA in myeloid cells of diabetic ulcers. A) Western blot analysis of GCA in normal skin tissue and tissue from diabetic ulcer (n = 3); GAPDH was used as a loading control B) The mRNA levels of GCA were analyzed by qRT‐PCR in human skin tissue from diabetic ulcer (n = 6). Immunofluorescence staining C) and quantitative analysis D) of GCA in human skin tissue(n = 12; scale bars, 200 µm). E) Bioinformatic analysis of scRNA‐seq of wound‐derived skin tissues from normal and diabetic mice. Violin plots of log‐transformed expression of GCA‐related genes in the cell populations of normal F) and diabetic G) mice. H) Heatmap of GCA expression in the wound‐derived skin cells of normal and diabetic mice. I) Western blotting was performed to detect GCA expression in bone marrow‐derived cells (BMC) from normal and diabetic mice; GAPDH was used as a loading control (n = 3). T‐distributed stochastic neighbor embedding (tSNE) plot showing the clustering of neutrophils J) and MPs K) based on GCA expression. Violin plots of GCA expression in clusters of neutrophils L) and MPs M). Highly expressed differentially expressed genes in neutrophil_1 N) and MPs_1 O) clusters in normal and diabetic mice. Data are shown as the mean ± SD. **** p < 0.0001.
Figure 3
Figure 3
Myeloid‐specific GCA knockout accelerates wound healing in diabetic mice. A) Molding of diabetic wounds in FLOX and CKO mice(n = 5). Representative wound photographs B) and wound‐healing rates C) at days 0, 3, 6, 9, and 12. D) Representative hematoxylin–eosin‐stained wound sections on Day 12 (scale bars, 200 µm). E) Representative image of Masson's trichrome staining of the wound sections on Day 12 (scale bars, 200 µm). Immunohistochemical staining E) and quantitative analysis F) of Ki67 expression in the wound sections on Day 12 (scale bars, 200 and 50 µm). Immunofluorescence staining H) and quantitative analysis I) of CD31 in wounds on Day 12 (scale bars, 100 µm). Representative images of the dorsal skin were captured using a laser Doppler imager for each group J). Quantitative analysis of perfusion K) of the back skin in mice is shown 7 days post‐injury (the solid circle indicates the wound bed in each group of mice). Data are shown as the mean ± SD. ** p < 0.01; *** p < 0.001; **** p < 0.0001.
Figure 4
Figure 4
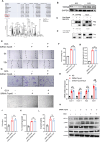
GCA impair tube formation and migration in endothelial cells. GCA‐induced functional changes in HUVEC, including migration, tube formation, and the expression of various angiogenic factors. Live cell images A) were captured 12 h after the wound‐healing assay (scale bars, 50 µm), and the wound recovery rate B)was quantified using ImageJ (n = 3). Representative images C) of invasive cells in the lower chamber that were stained with crystal violet and obtained to evaluate the migration ability of HUVECs (n = 3) in the PBS and GCA groups (scale bars, 100 µm). Quantification of migration ability is shown in the histogram D). Representative images E) of the tube‐formation assays were taken after 6 h, with or without GCA treatment (scale bars, 100 µm); Nb nodes F), total branching length F), and number of branch points H) were measured and analyzed using ImageJ (n = 3). (I) Quantification of angiogenesis‐related gene expression in HUVEC after 24 h GCA treatment. J) Protein expression levels of HIF‐1α, p‐Erk1/2, and VEGF were analyzed by Western blot in HUVECs cultured under GCA or PBS for 48 h. GAPDH as a loading control. Data are shown as the mean ± SD. ** p < 0.01; *** p < 0.001; **** p < 0.0001.
Figure 5
Figure 5
TRPM8 is a receptor of GCA in endothelial cells. A) TRPM8 protein binding to GCA was identified by LC‐MS/MS analysis. B) TRPM8 expression in HUVECs was determined by Western blotting after incubation with normal or high glucose. Immunoprecipitation (IP) analysis of Flag‐TRPM8 C) and Myc‐GCA D) binding. GCA and siRNA‐Trpm8 treatments induced functional changes in HUVECs (n = 3), including migration, tube formation, and expression of various angiogenic factors. Live cell images E) were captured 12 h after the wound‐healing assay (scale bars, 100 µm), and the wound‐recovery rate F) was quantified using ImageJ. Representative images of invasive cells G) in the lower chamber stained with crystal violet were obtained to evaluate the migratory ability of HUVECs(scale bars, 100 µm); and quantitative analysis H)of migration ability. Representative images of HUVEC tube formation I)(scale bars, 100 µm). Nb nodes J), total branching length K), and number of branch points L) were measured and analyzed using ImageJ. M) mRNA expression of vasculogenesis‐related genes. N) Protein expression levels of HIF‐1α, p‐Erk1/2, and VEGF were analyzed by Western blot, with GAPDH as a loading control. Data are presented as mean ± SEM. NS, not significant;** p < 0.01; *** p < 0.001; **** p < 0.0001.
Figure 6
Figure 6
GCA‐NAb accelerates wound healing in diabetic mice. A) Schematic representation of the wound‐healing model for evaluating the therapeutic potential of GCA‐NAb. Representative wound photographs B) and wound‐healing rates C) at days 0, 3, 6, 9, and 12(n = 5). D) Representative hematoxylin–eosin‐stained wound sections on Day 12 (scale bars, 200 µm). E) Representative image of Masson's trichrome staining of the wound sections on Day 12 (scale bars, 200 µm). Immunohistochemical staining F) and quantitative analysis G) of Ki67 expression in the wound sections on Day 12 (scale bars, 200 and 50 µm). Immunofluorescence staining H) and quantitative analysis I) of CD31 in wounds on Day 12 (scale bars,100 µm). Representative images of the dorsal skin were captured using a laser Doppler imager for each group J), and quantitative analysis of perfusion (right) of the dorsal skin of mice is shown & days post‐injury (solid circle indicates the wound bed in each group of mice, n = 5). Data are shown as the mean ± SD. * p < 0.05; ** p < 0.01; *** p < 0.001; **** p < 0.0001.
Figure 7
Figure 7
GCA‐neutralizing antibody‐embedded hydrogels enhance wound healing in diabetic mice. A)SEM images of GelMA and GelMA‐GCA‐NAb hydrogel(scale bars, 50 µm). B) Degradation percentage of GelMA and GelMA‐GCA‐NAb hydrogel (n  = 3). C)Stress of GelMA and GelMA‐GCA‐NAb hydrogel (n  = 3). D) Cumulative amount of protein released by GelMA‐GCA‐NAb(n = 3). E) Schematic depiction of the wound‐healing model for the evaluation of the therapeutic potential of GelMA‐GCA‐Nab (n = 5). Representative wound photographs F) and wound healing rates G) at days 0, 3, 6, 9, and 12.Immunofluorescence staining H) and quantitative analysis I) of CD31 in wounds on Day 12 (scale bars, 100 µm). Representative images of the dorsal skin were captured using a laser Doppler imager for each group.,and quantitative analysis of perfusion of the dorsal skin in miceJ) is shown 7 days post‐injury (the solid circle indicates the wound bed in each group of mice). Data are shown as the mean ± SD. ** p < 0.01; *** p < 0.001; **** p < 0.0001.

References

    1. Mcdermott K., Fang M., Boulton A. J. M., Selvin E., Hicks C. W., Diabetes Care 2023, 46, 209. - PMC - PubMed
    1. Armstrong D. G., Boulton A. J. M., Bus S. A., N. Engl. J. Med. 2017, 376, 2367. - PubMed
    1. Cao Y., Gang X., Sun C., Wang G., J Diabetes Res. 2017, 2017, 9328347. - PMC - PubMed
    1. Lopes L., Setia O., Aurshina A., Liu S., Hu H., Isaji T., Liu H., Wang T., Ono S., Guo X., Yatsula B., Guo J., Gu Y., Navarro T., Dardik A., Stem Cell Res Ther 2018, 9, 188. - PMC - PubMed
    1. Sávio‐Silva C., Beyerstedt S., Soinski‐Sousa P. E., Casaro E. B., Balby‐Rocha M. T. A., Simplício‐Filho A., Alves‐Silva J., Rangel É. B., Stem Cells Int 2020, 2020, 8833725. - PMC - PubMed

Substances

LinkOut - more resources