

The validity of electronic health data for measuring smoking status: a systematic review and meta-analysis
- PMID: 38308231
- PMCID: PMC10836023
- DOI: 10.1186/s12911-024-02416-3
The validity of electronic health data for measuring smoking status: a systematic review and meta-analysis
Abstract
Background: Smoking is a risk factor for many chronic diseases. Multiple smoking status ascertainment algorithms have been developed for population-based electronic health databases such as administrative databases and electronic medical records (EMRs). Evidence syntheses of algorithm validation studies have often focused on chronic diseases rather than risk factors. We conducted a systematic review and meta-analysis of smoking status ascertainment algorithms to describe the characteristics and validity of these algorithms.
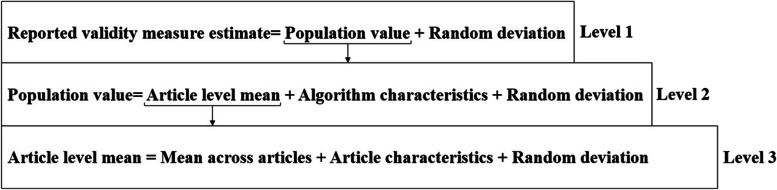
Methods: The Preferred Reporting Items for Systematic Reviews and Meta-Analyses guidelines were followed. We searched articles published from 1990 to 2022 in EMBASE, MEDLINE, Scopus, and Web of Science with key terms such as validity, administrative data, electronic health records, smoking, and tobacco use. The extracted information, including article characteristics, algorithm characteristics, and validity measures, was descriptively analyzed. Sources of heterogeneity in validity measures were estimated using a meta-regression model. Risk of bias (ROB) in the reviewed articles was assessed using the Quality Assessment of Diagnostic Accuracy Studies-2 tool.
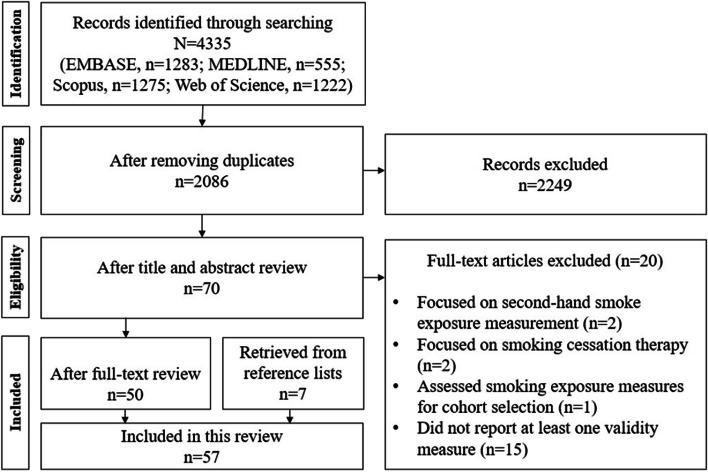
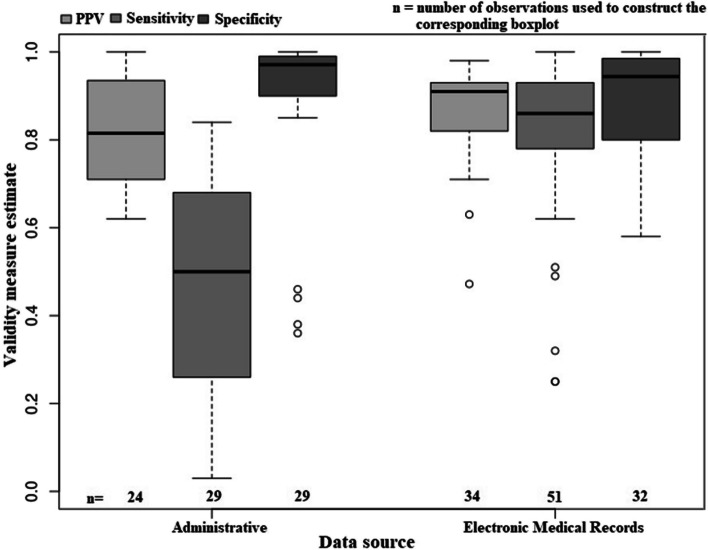
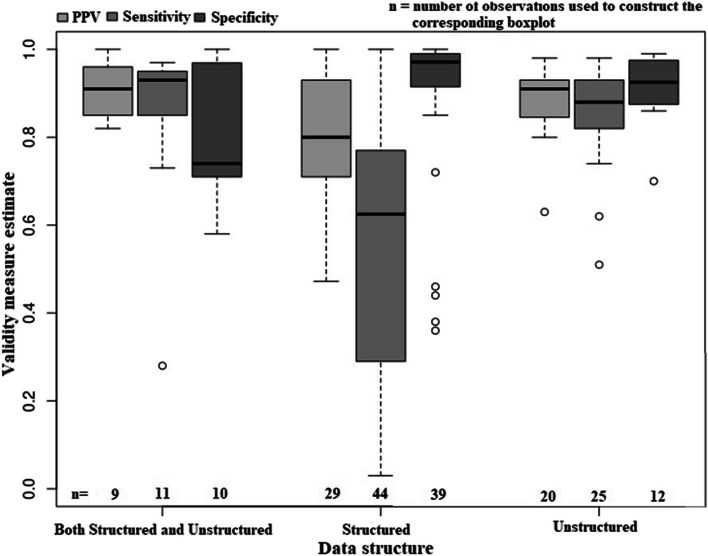
Results: The initial search yielded 2086 articles; 57 were selected for review and 116 algorithms were identified. Almost three-quarters (71.6%) of algorithms were based on EMR data. The algorithms were primarily constructed using diagnosis codes for smoking-related conditions, although prescription medication codes for smoking treatments were also adopted. About half of the algorithms were developed using machine-learning models. The pooled estimates of positive predictive value, sensitivity, and specificity were 0.843, 0.672, and 0.918 respectively. Algorithm sensitivity and specificity were highly variable and ranged from 3 to 100% and 36 to 100%, respectively. Model-based algorithms had significantly greater sensitivity (p = 0.006) than rule-based algorithms. Algorithms for EMR data had higher sensitivity than algorithms for administrative data (p = 0.001). The ROB was low in most of the articles (76.3%) that underwent the assessment.
Conclusions: Multiple algorithms using different data sources and methods have been proposed to ascertain smoking status in electronic health data. Many algorithms had low sensitivity and positive predictive value, but the data source influenced their validity. Algorithms based on machine-learning models for multiple linked data sources have improved validity.
Keywords: Algorithms; Electronic health records; Review; Routinely collected health data; Validation study.
© 2024. The Author(s).
Conflict of interest statement
The authors declare no competing interests.
Figures


References
-
- Kierkegaard P. Electronic health record: wiring Europe’s healthcare. Comput Law Secur Rev. 2011;27(5):503–515. doi: 10.1016/j.clsr.2011.07.013. - DOI
-
- World Health Organization. Tobacco fact sheet from WHO providing key facts and information on surveillance. https://www.who.int/news-room/fact-sheets/detail/tobacco. Accessed 10 Apr 2022.
Publication types
MeSH terms
LinkOut - more resources
Full Text Sources
